Important: This documentation is about an older version. It's relevant only to the release noted, many of the features and functions have been updated or replaced. Please view the current version.
Amazon CloudWatch data source
Grafana ships with built-in support for Amazon CloudWatch. This topic describes queries, templates, variables, and other configuration specific to the CloudWatch data source.
For instructions on how to add a data source to Grafana, refer to the administration documentation. Only users with the organization administrator role can add data sources. Administrators can also provision the data source with Grafana’s provisioning system, and should control pricing and manage service quotas accordingly.
Once you’ve added the data source, you can configure it so that your Grafana instance’s users can create queries in its query editor when they build dashboards and use Explore.
Note: To troubleshoot issues while setting up the CloudWatch data source, check the
/var/log/grafana/grafana.logfile.
Configure the data source
Click Connections in the left-side menu.
Under Your connections, click Data sources.
Enter
CloudWatchin the search bar.Click CloudWatch.
The Settings tab of the data source is displayed.
Configure AWS authentication
A Grafana plugin’s requests to AWS are made on behalf of an AWS Identity and Access Management (IAM) role or IAM user. The IAM user or IAM role must have the associated policies to perform certain API actions.
For authentication options and configuration details, refer to AWS authentication.
IAM policy examples
To read CloudWatch metrics and EC2 tags, instances, regions, and alarms, you must grant Grafana permissions via IAM. You can attach these permissions to the IAM role or IAM user you configured in AWS authentication.
Metrics-only:
{
  "Version": "2012-10-17",
  "Statement": [
    {
      "Sid": "AllowReadingMetricsFromCloudWatch",
      "Effect": "Allow",
      "Action": [
        "cloudwatch:DescribeAlarmsForMetric",
        "cloudwatch:DescribeAlarmHistory",
        "cloudwatch:DescribeAlarms",
        "cloudwatch:ListMetrics",
        "cloudwatch:GetMetricData",
        "cloudwatch:GetInsightRuleReport"
      ],
      "Resource": "*"
    },
    {
      "Sid": "AllowReadingTagsInstancesRegionsFromEC2",
      "Effect": "Allow",
      "Action": ["ec2:DescribeTags", "ec2:DescribeInstances", "ec2:DescribeRegions"],
      "Resource": "*"
    },
    {
      "Sid": "AllowReadingResourcesForTags",
      "Effect": "Allow",
      "Action": "tag:GetResources",
      "Resource": "*"
    }
  ]
}
Logs-only:
{
  "Version": "2012-10-17",
  "Statement": [
    {
      "Sid": "AllowReadingLogsFromCloudWatch",
      "Effect": "Allow",
      "Action": [
        "logs:DescribeLogGroups",
        "logs:GetLogGroupFields",
        "logs:StartQuery",
        "logs:StopQuery",
        "logs:GetQueryResults",
        "logs:GetLogEvents"
      ],
      "Resource": "*"
    },
    {
      "Sid": "AllowReadingTagsInstancesRegionsFromEC2",
      "Effect": "Allow",
      "Action": ["ec2:DescribeTags", "ec2:DescribeInstances", "ec2:DescribeRegions"],
      "Resource": "*"
    },
    {
      "Sid": "AllowReadingResourcesForTags",
      "Effect": "Allow",
      "Action": "tag:GetResources",
      "Resource": "*"
    }
  ]
}
Metrics and Logs:
{
  "Version": "2012-10-17",
  "Statement": [
    {
      "Sid": "AllowReadingMetricsFromCloudWatch",
      "Effect": "Allow",
      "Action": [
        "cloudwatch:DescribeAlarmsForMetric",
        "cloudwatch:DescribeAlarmHistory",
        "cloudwatch:DescribeAlarms",
        "cloudwatch:ListMetrics",
        "cloudwatch:GetMetricData",
        "cloudwatch:GetInsightRuleReport"
      ],
      "Resource": "*"
    },
    {
      "Sid": "AllowReadingLogsFromCloudWatch",
      "Effect": "Allow",
      "Action": [
        "logs:DescribeLogGroups",
        "logs:GetLogGroupFields",
        "logs:StartQuery",
        "logs:StopQuery",
        "logs:GetQueryResults",
        "logs:GetLogEvents"
      ],
      "Resource": "*"
    },
    {
      "Sid": "AllowReadingTagsInstancesRegionsFromEC2",
      "Effect": "Allow",
      "Action": ["ec2:DescribeTags", "ec2:DescribeInstances", "ec2:DescribeRegions"],
      "Resource": "*"
    },
    {
      "Sid": "AllowReadingResourcesForTags",
      "Effect": "Allow",
      "Action": "tag:GetResources",
      "Resource": "*"
    }
  ]
}
**Cross-account observability: (see below) **
{
  "Version": "2012-10-17",
  "Statement": [
    {
      "Action": ["oam:ListSinks", "oam:ListAttachedLinks"],
      "Effect": "Allow",
      "Resource": "*"
    }
  ]
}
Configure CloudWatch settings
Namespaces of Custom Metrics
Grafana can’t load custom namespaces through the CloudWatch GetMetricData API.
To make custom metrics appear in the data source’s query editor fields, specify the names of the namespaces containing the custom metrics in the data source configuration’s Namespaces of Custom Metrics field. The field accepts multiple namespaces separated by commas.
Timeout
Configure the timeout specifically for CloudWatch Logs queries.
Log queries don’t keep a single request open, and instead periodically poll for results. Therefore, they don’t recognize the standard Grafana query timeout. Because of limits on concurrently running queries in CloudWatch, they can also take longer to finish.
X-Ray trace links
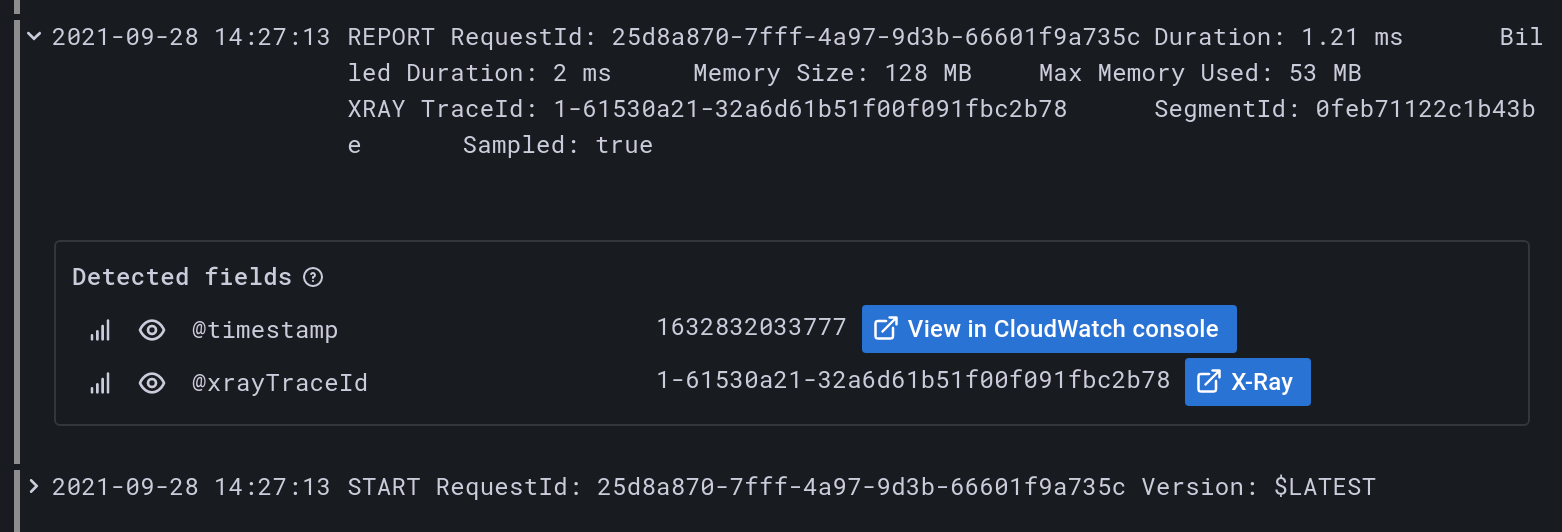
To automatically add links in your logs when the log contains the @xrayTraceId field, link an X-Ray data source in the “X-Ray trace link” section of the data source configuration.

The data source select contains only existing data source instances of type X-Ray. To use this feature, you must already have an X-Ray data source configured. For details, see the X-Ray data source docs.
To view the X-Ray link, select the log row in either the Explore view or dashboard Logs panel to view the log details section.
To log the @xrayTraceId, see the AWS X-Ray documentation.
To provide the field to Grafana, your log queries must also contain the @xrayTraceId field, for example by using the query fields @message, @xrayTraceId.

Configure the data source with grafana.ini
The Grafana configuration file includes an AWS section where you can configure data source options:
| Configuration option | Description |
|---|---|
allowed_auth_providers | Specifies which authentication providers are allowed for the CloudWatch data source. The following providers are enabled by default in open-source Grafana: default (AWS SDK default), keys (Access and secret key), credentials (Credentials file), ec2_IAM_role (EC2 IAM role). |
assume_role_enabled | Allows you to disable assume role (ARN) in the CloudWatch data source. The assume role (ARN) is enabled by default in open-source Grafana. |
list_metrics_page_limit | Sets the limit of List Metrics API pages. When a custom namespace is specified in the query editor, the List Metrics API populates the Metrics field and Dimension fields. The API is paginated and returns up to 500 results per page, and the data source also limits the number of pages to 500 by default. This setting customizes that limit. |
Provision the data source
You can define and configure the data source in YAML files as part of Grafana’s provisioning system. For more information about provisioning, and for available configuration options, refer to Provisioning Grafana.
Provisioning examples
Using AWS SDK (default):
apiVersion: 1
datasources:
  - name: CloudWatch
    type: cloudwatch
    jsonData:
      authType: default
      defaultRegion: eu-west-2
Using credentials’ profile name (non-default):
apiVersion: 1

datasources:
  - name: CloudWatch
    type: cloudwatch
    jsonData:
      authType: credentials
      defaultRegion: eu-west-2
      customMetricsNamespaces: 'CWAgent,CustomNameSpace'
      profile: secondary
Using accessKey and secretKey:
apiVersion: 1

datasources:
  - name: CloudWatch
    type: cloudwatch
    jsonData:
      authType: keys
      defaultRegion: eu-west-2
    secureJsonData:
      accessKey: '<your access key>'
      secretKey: '<your secret key>'
Using AWS SDK Default and ARN of IAM Role to Assume:
apiVersion: 1
datasources:
  - name: CloudWatch
    type: cloudwatch
    jsonData:
      authType: default
      assumeRoleArn: arn:aws:iam::123456789012:root
      defaultRegion: eu-west-2
Query the data source
The CloudWatch data source can query data from both CloudWatch metrics and CloudWatch Logs APIs, each with its own specialized query editor.
For details, see the query editor documentation.
Use template variables
Instead of hard-coding details such as server, application, and sensor names in metric queries, you can use variables. Grafana lists these variables in dropdown select boxes at the top of the dashboard to help you change the data displayed in your dashboard. Grafana refers to such variables as template variables.
For details, see the template variables documentation.
Import pre-configured dashboards
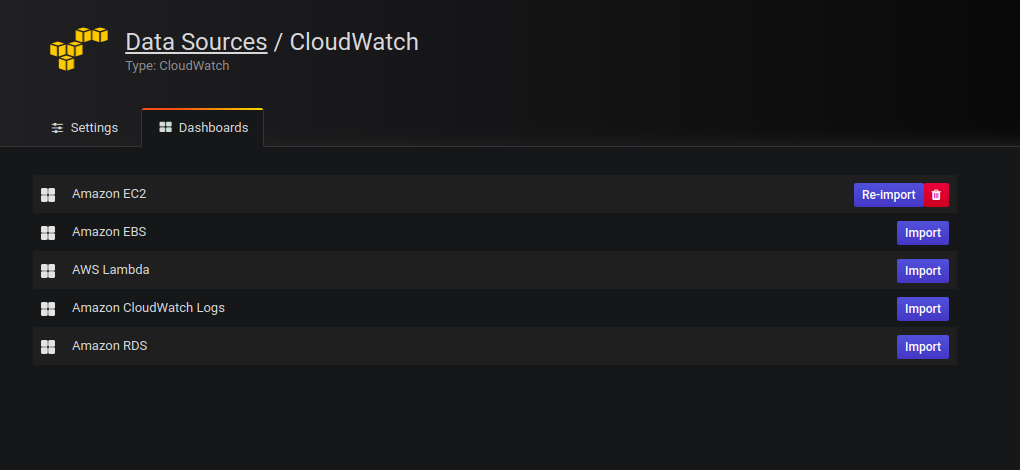
The CloudWatch data source ships with curated and pre-configured dashboards for five of the most popular AWS services:
- Amazon Elastic Compute Cloud:
Amazon EC2 - Amazon Elastic Block Store:
Amazon EBS - AWS Lambda:
AWS Lambda - Amazon CloudWatch Logs:
Amazon CloudWatch Logs - Amazon Relational Database Service:
Amazon RDS
To import curated dashboards:
Navigate to the data source’s configuration page.
Select the Dashboards tab.
This displays the curated selection of importable dashboards.
Select Import for the dashboard to import.

To customize an imported dashboard:
To customize one of these dashboards, we recommend that you save it under a different name. If you don’t, upgrading Grafana can overwrite the customized dashboard with the new version.
Create queries for alerting
Alerting requires queries that return numeric data, which CloudWatch Logs support.
For example, you can enable alerts through the use of the stats command.
This is also a valid query for alerting on messages that include the text “Exception”:
filter @message like /Exception/
    | stats count(*) as exceptionCount by bin(1h)
    | sort exceptionCount desc
Note: If you receive an error like
input data must be a wide series but got ...when trying to alert on a query, make sure that your query returns valid numeric data that can be output to a Time series panel.
For more information on Grafana alerts, refer to Alerting.
Control pricing
The Amazon CloudWatch data source for Grafana uses ListMetrics and GetMetricData CloudWatch API calls to list and retrieve metrics.
Pricing for CloudWatch Logs is based on the amount of data ingested, archived, and analyzed via CloudWatch Logs Insights queries.
Each time you select a dimension in the query editor, Grafana issues a ListMetrics API request.
Each time you change queries in the query editor, Grafana issues a new request to the GetMetricData API.
Note: Grafana v6.5 and higher replaced all
GetMetricStatisticsAPI requests with calls to GetMetricData to provide better support for CloudWatch metric math, and enables the automatic generation of search expressions when using wildcards or disabling theMatch Exactoption. TheGetMetricStatisticsAPI qualified for the CloudWatch API free tier, butGetMetricDatacalls don’t.
For more information, refer to the CloudWatch pricing page.
Manage service quotas
AWS defines quotas, or limits, for resources, actions, and items in your AWS account. Depending on the number of queries in your dashboard and the number of users accessing the dashboard, you might reach the usage limits for various CloudWatch and CloudWatch Logs resources. Quotas are defined per account and per region.
If you use multiple regions or configured more than one CloudWatch data source to query against multiple accounts, you must request a quota increase for each account and region in which you reach the limit.
To request a quota increase, visit the AWS Service Quotas console. For more information, refer to the AWS documentation for Service Quotas and CloudWatch limits.
Cross-account observability
The CloudWatch plugin enables you to monitor and troubleshoot applications across multiple regional accounts. Using cross-account observability, you can seamlessly search, visualize and analyze metrics and logs without worrying about account boundaries.
To use this feature, configure in the AWS console under Cloudwatch Settings, a monitoring and source account, and then add the necessary IAM permissions as described above.
CloudWatch Logs data protection
CloudWatch Logs can safeguard data by using log group data protection policies. If you have data protection enabled for a log group, then any sensitive data that matches the data identifiers you’ve selected will be masked. In order to view masked data you will need to have the logs:Unmask IAM permission enabled. See the AWS documentation on how to help protect sensitive log data with masking to learn more about this.


