Important: This documentation is about an older version. It's relevant only to the release noted, many of the features and functions have been updated or replaced. Please view the current version.
Data sources
Grafana comes with built-in support for many data sources. If you need other data sources, you can also install one of the many data source plugins. If the plugin you need doesn’t exist, you can develop a custom plugin.
Each data source comes with a query editor, which formulates custom queries according to the source’s structure. After you add and configure a data source, you can use it as an input for many operations, including:
This documentation describes how to manage data sources in general, and how to configure or query the built-in data sources. For other data sources, refer to the list of datasource plugins. To develop a custom plugin, refer to Build a plugin.
Manage data sources
Only users with the organization administrator role can add or remove data sources. To access data source management tools in Grafana as an administrator, navigate to Configuration > Data Sources in the Grafana sidebar.
For details on data source management, including instructions on how to add data sources and configure user permissions for queries, refer to the administration documentation.
Use query editors

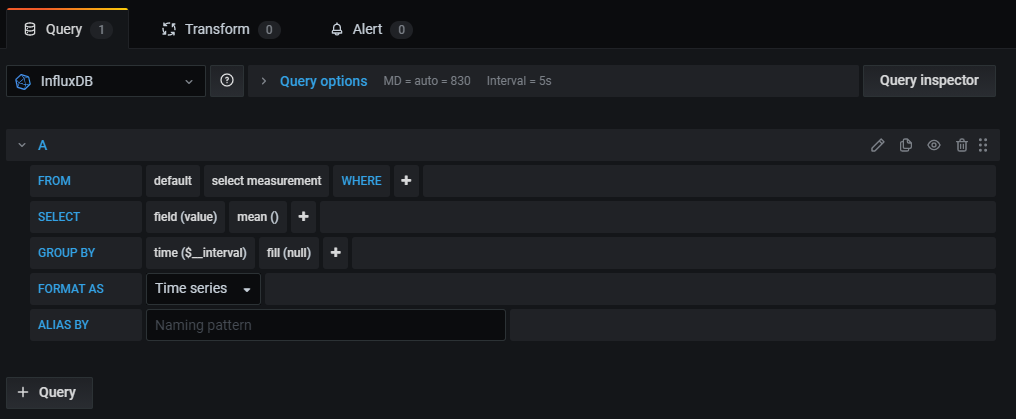
Each data source’s query editor provides a customized user interface that helps you write queries that take advantage of its unique capabilities. You use a data source’s query editor when you create queries in dashboard panels or Explore.
Because of the differences between query languages, each data source query editor looks and functions differently. Depending on your data source, the query editor might provide auto-completion features, metric names, variable suggestions, or a visual query-building interface.
For example, this video demonstrates the visual Prometheus query builder:
There’s supposed to be a video here, but for some reason there isn’t. Either we entered the id wrong (oops!), or Vimeo is down. If it’s the latter, we’d expect they’ll be back up and running soon. In the meantime, check out our blog!
For general information about querying in Grafana, and common options and user interface elements across all query editors, refer to Query and transform data.
Special data sources
Grafana includes three special data sources:
- Grafana: A built-in data source that generates random walk data and can poll the Testdata data source. Additionally, it can list files and get other data from a Grafana installation. This can be helpful for testing visualizations and running experiments.
- Mixed: An abstraction that lets you query multiple data sources in the same panel.
When you select Mixed, you can then select a different data source for each new query that you add.
- The first query uses the data source that was selected before you selected Mixed.
- You can’t change an existing query to use the Mixed data source.
- Grafana Play example: Mixed data sources
- Dashboard: A data source that uses the result set from another panel in the same dashboard. The dashboard data source can use data either directly from the selected panel or from annotations attached to the selected panel.
Built-in core data sources
These built-in core data sources are also included in the Grafana documentation:


