Important: This documentation is about an older version. It's relevant only to the release noted, many of the features and functions have been updated or replaced. Please view the current version.
View and filter alert rules
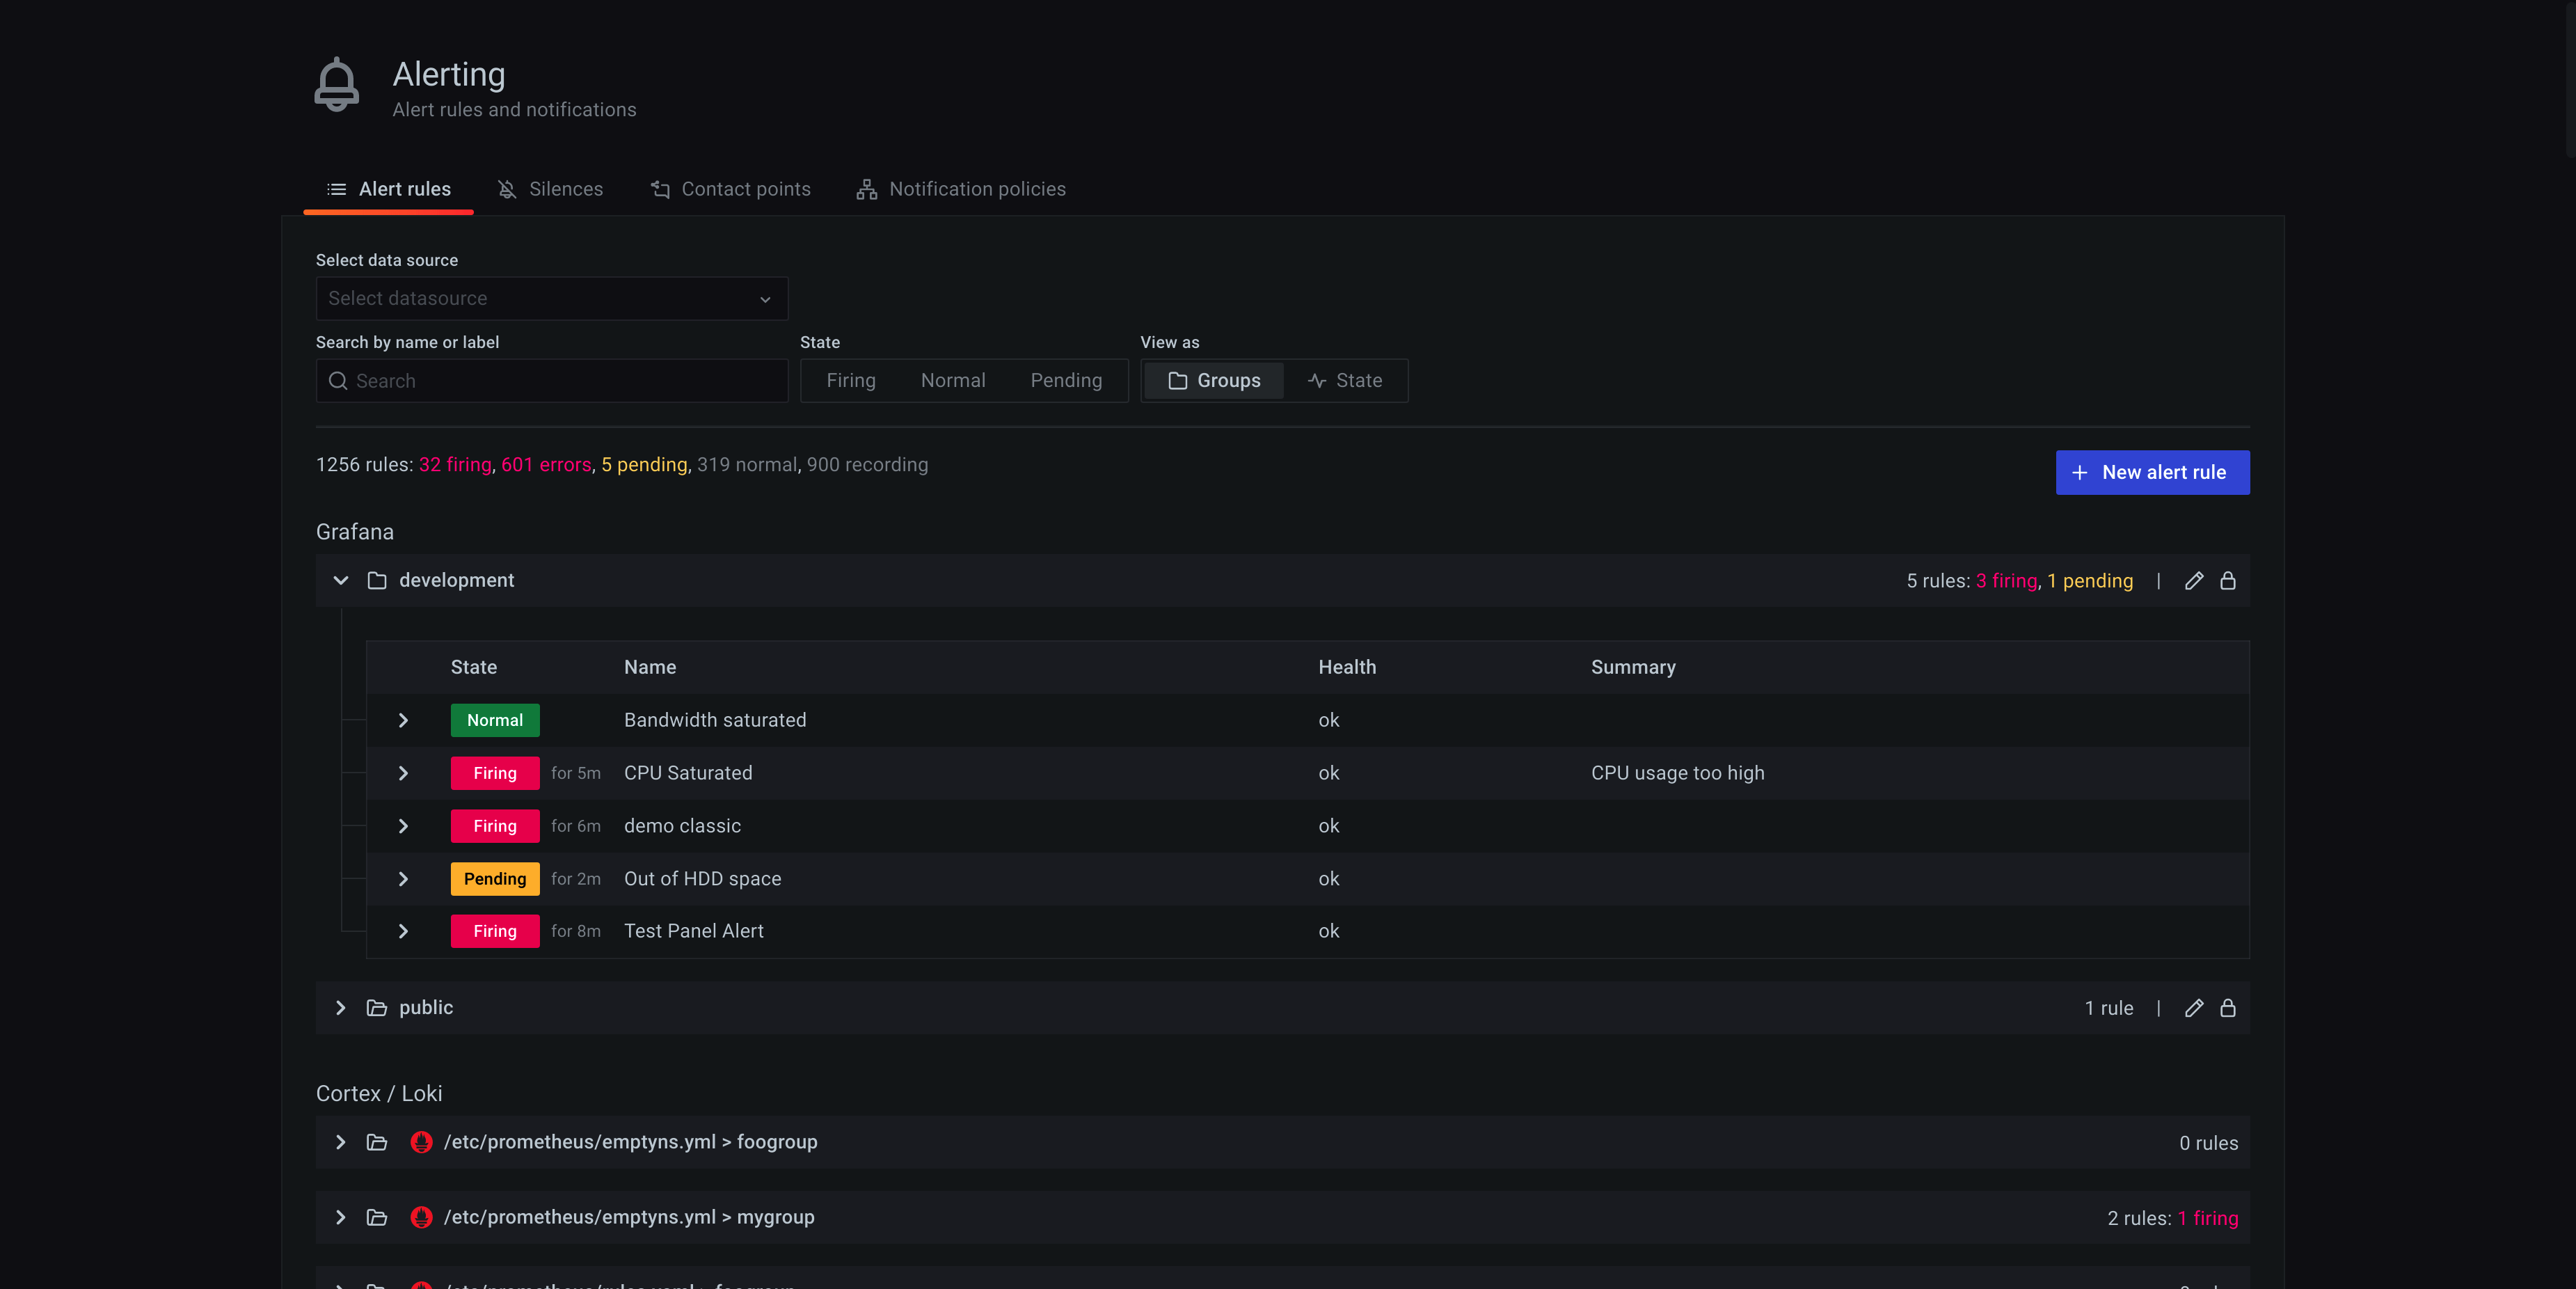
The Alerting page lists all existing alert rules. By default, rules are grouped by types of data sources. The Grafana section lists all Grafana managed rules. Alert rules for Prometheus compatible data sources are also listed here. You can view alert rules for Prometheus compatible data sources but you cannot edit them.
The Mimir/Cortex/Loki rules section lists all rules for Mimir, Cortex, or Loki data sources. Cloud alert rules are also listed in this section.
When managing large volumes of alerts, you can use extended alert rule search capabilities to filter on folders, evaluation groups, and rules. Additionally, you can filter alert rules by their properties like labels, state, type, and health.
View alert rules
To view alerting details:
- In the Grafana menu, click the Alerting (bell) icon to open the Alerting page. By default, the List view displays.
- In View as, toggle between Grouped or State views by clicking the relevant option. See Group view and State view for more information.
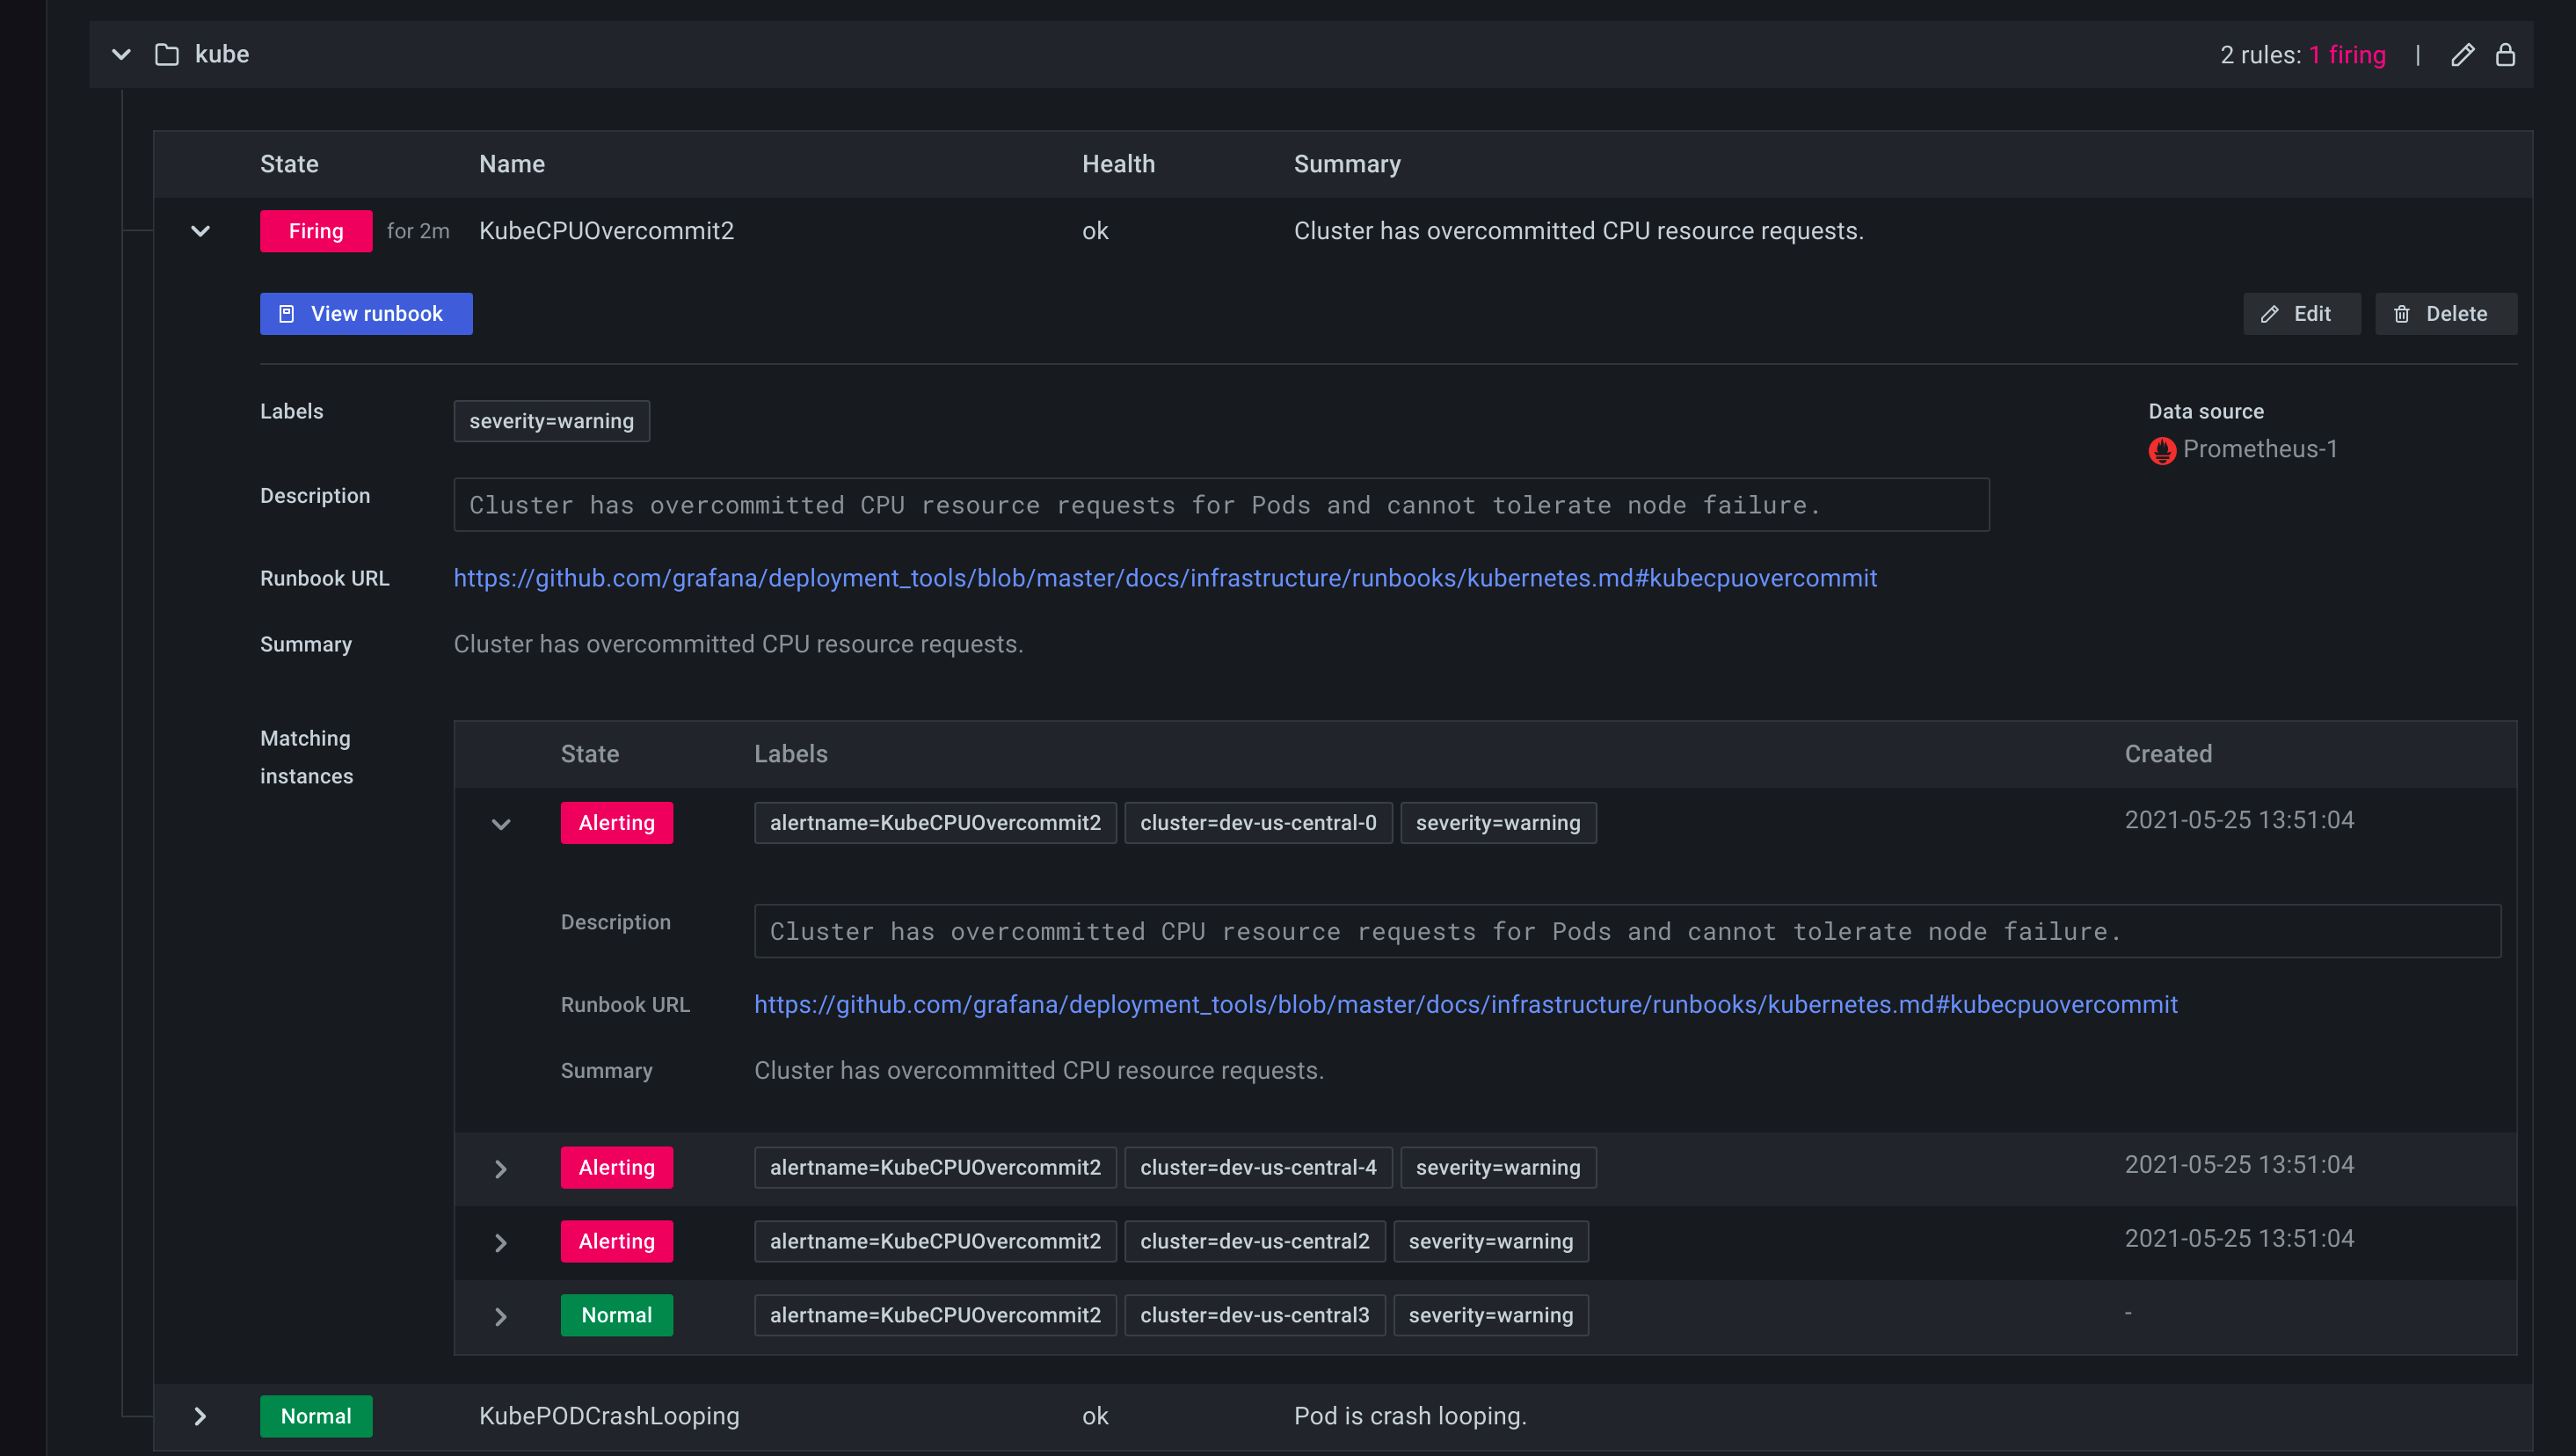
- Expand the rule row to view the rule labels, annotations, data sources the rule queries, and a list of alert instances resulting from this rule.

From the Alert list page, you can also make copies of alert rules to help you reuse existing alert rules.
Export alert rules
Click Export to create and tune an alert rule in the UI, then export to YAML or JSON, and use in the provisioning API or files. You can also export an entire rule group to review or use.
Note: This is supported in both the UI and provisioning API.
View query definitions for provisioned alerts
View read-only query definitions for provisioned alerts. Check quickly if your alert rule queries are correct, without diving into your “as-code” repository for rule definitions.
Grouped view
Grouped view shows Grafana alert rules grouped by folder and Loki or Prometheus alert rules grouped by namespace + group. This is the default rule list view, intended for managing rules. You can expand each group to view a list of rules in this group. Expand a rule further to view its details. You can also expand action buttons and alerts resulting from the rule to view their details.

State view
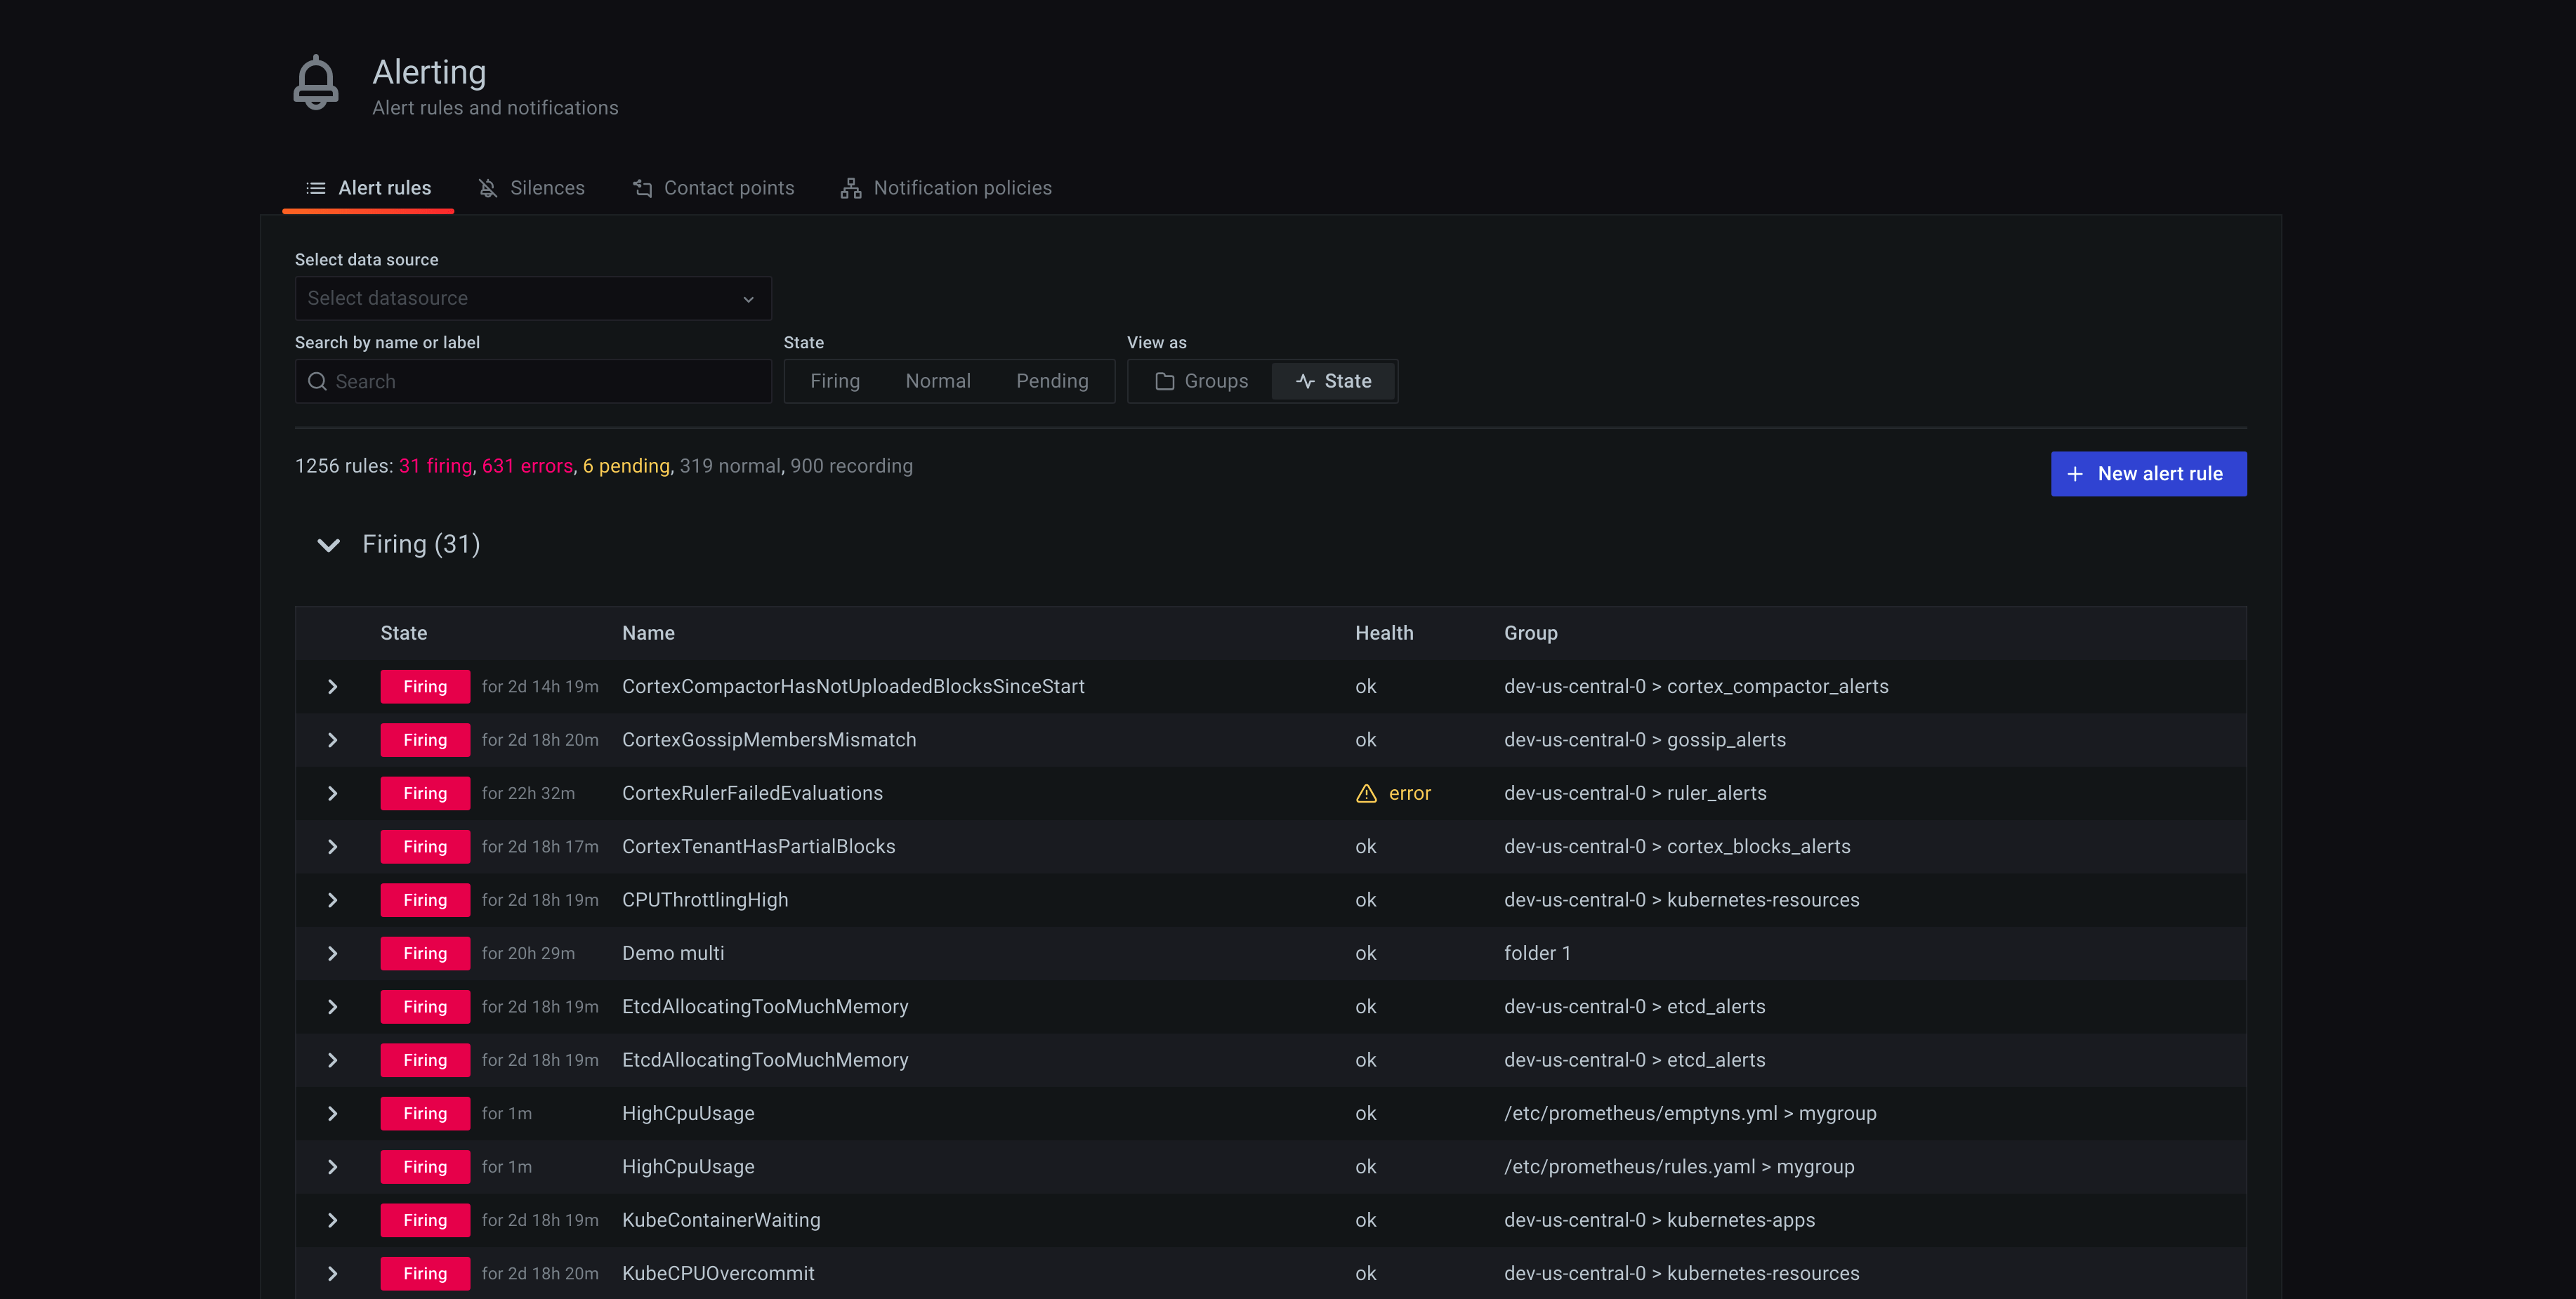
State view shows alert rules grouped by state. Use this view to get an overview of which rules are in what state. Each rule can be expanded to view its details. Action buttons and any alerts generated by this rule, and each alert can be further expanded to view its details.

Filter alert rules
To filter alert rules:
- From Select data sources, select a data source. You can see alert rules that query the selected data source.
- In the Search by label, enter search criteria using label selectors. For example,
environment=production,region=~US|EU,severity!=warning. - From Filter alerts by state, select an alerting state you want to see. You can see alerting rules that match the state. Rules matching other states are hidden.


