Important: This documentation is about an older version. It's relevant only to the release noted, many of the features and functions have been updated or replaced. Please view the current version.
What’s new in Grafana v8.3
Grafana 8.3 is an exciting release for Grafana Labs. This release includes the new Candlestick Panel, a new visualization suggestions engine and, for enterprise users, Recorded Queries.
For Open Source users it also marks the first time Grafana Alerting, formerly unified alerting, is enabled by default for new Grafana installations. Grafana Alerting in 8.3 is the flexible, single pane of glass for all your alerts. Included in this release is expanded provisioning support for notifiers, contact points, and alert rules, alongside auditing and role-based access control for our Enterprise customers.
We’ve summarized what’s new in the release here, but you might also be interested in the announcement blog post as well. If you’d like all the details you can check out the complete CHANGELOG.md.
Grafana OSS
Community Contributions
Grafana 8.3 includes many community contributions including the ability to interpolate variables in tags (#42318), fly-out sub-menu support (#41647), the addition of AWS RoboMaker & AWS Global Accelerator metrics to the AWS CloudWatch data source (#41450, #41236), as well as updates to the news panel (#41193), the plugin catalog (#40917), and many more. The Grafana Labs team is deeply grateful for all those who take the time to contribute and participate in the development of Grafana.
Accessibility
We’ve continued to make progress on improving Grafana’s accessibility. In Grafana 8.3 we’ve updated the main menu with improved keyboard navigation. We’ve also improved Grafana’s behavior when navigating through elements with the tab key (tab stops) and finished our work to make Grafana’s viewer roles compatible with assistive technologies such as screen readers. You can read our accessibility statement here and reach out to us with accessibility issues using our community Slack or our community forums.
Dashboards and Visualizations
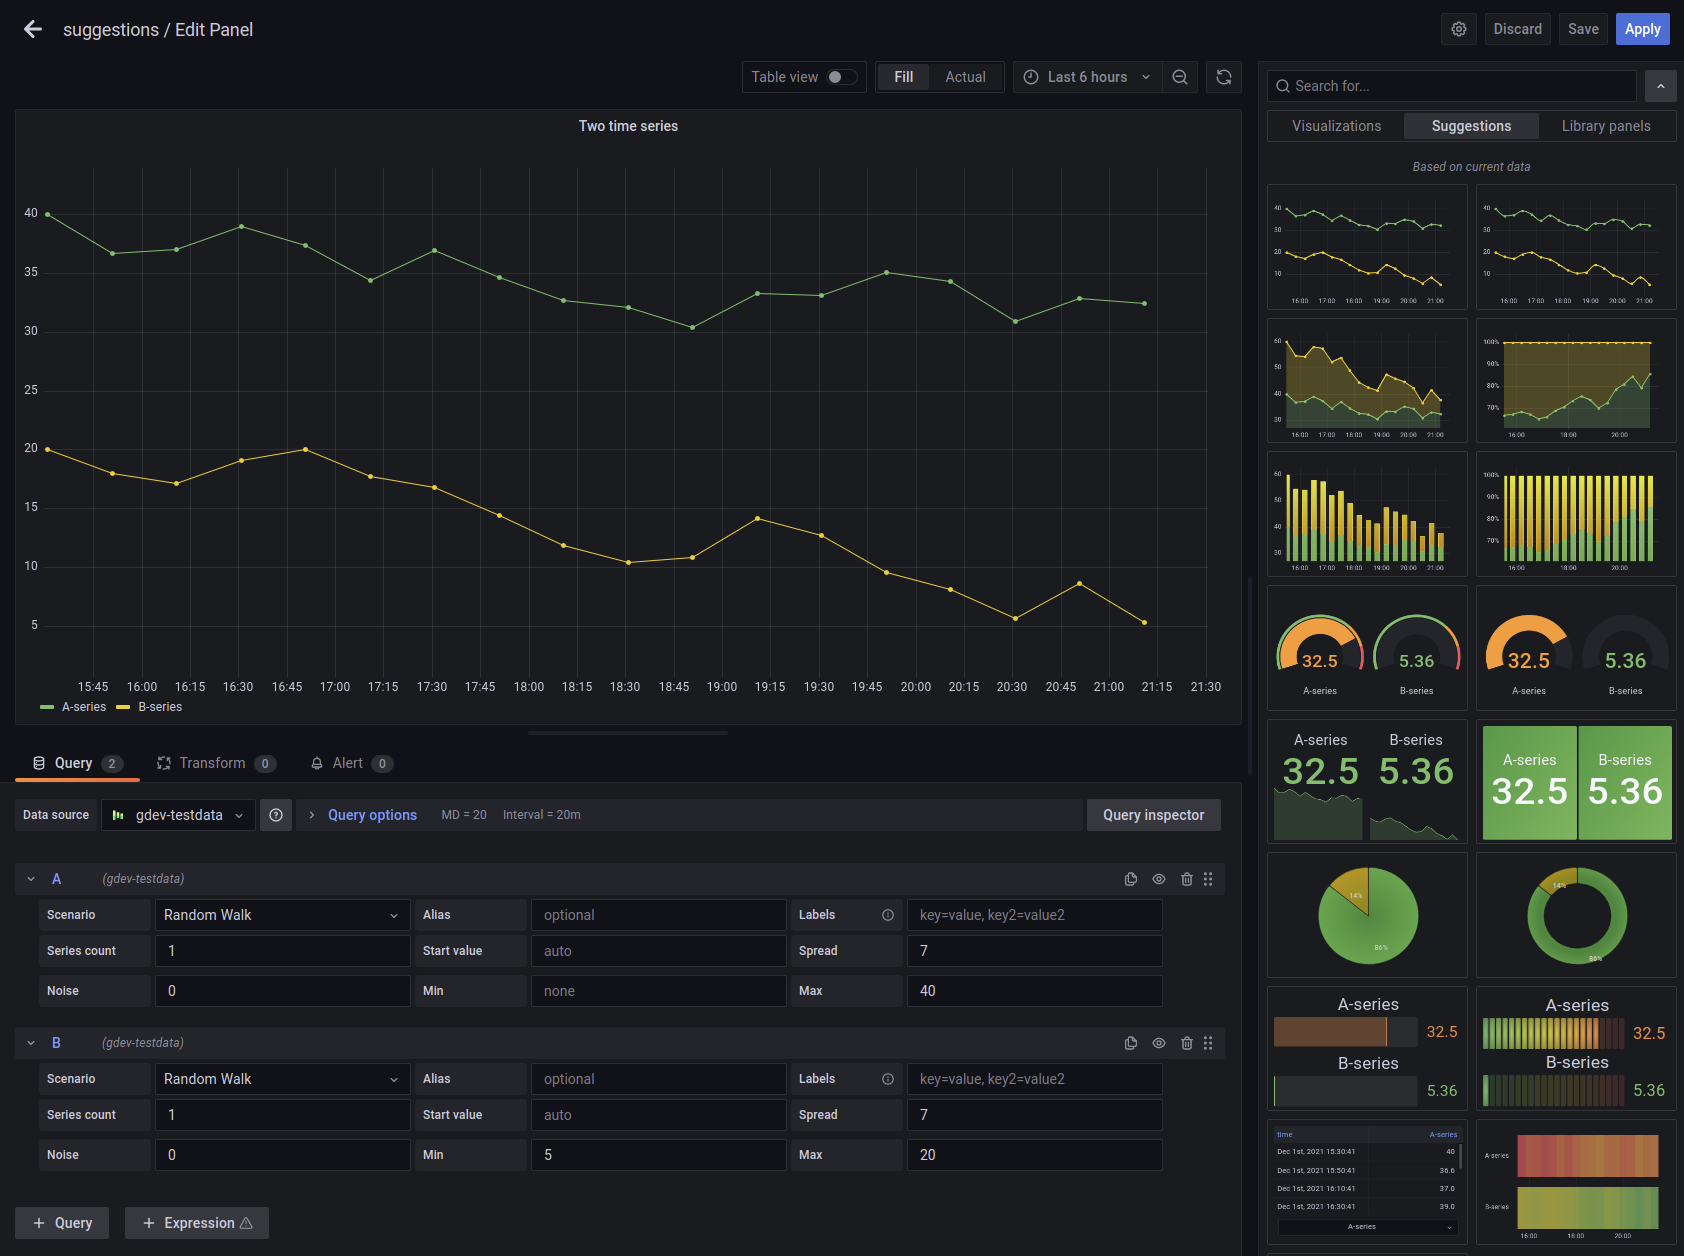
Panel Suggestions
Grafana will now make suggestions for visualization types based on the current data surfaced by a query or queries in a panel. This makes seeing available, possible interpretations of your data more straightforward and can be a useful jumping-off point when building panels and dashboards with specific goals in mind.
Candlestick Panel (Beta)
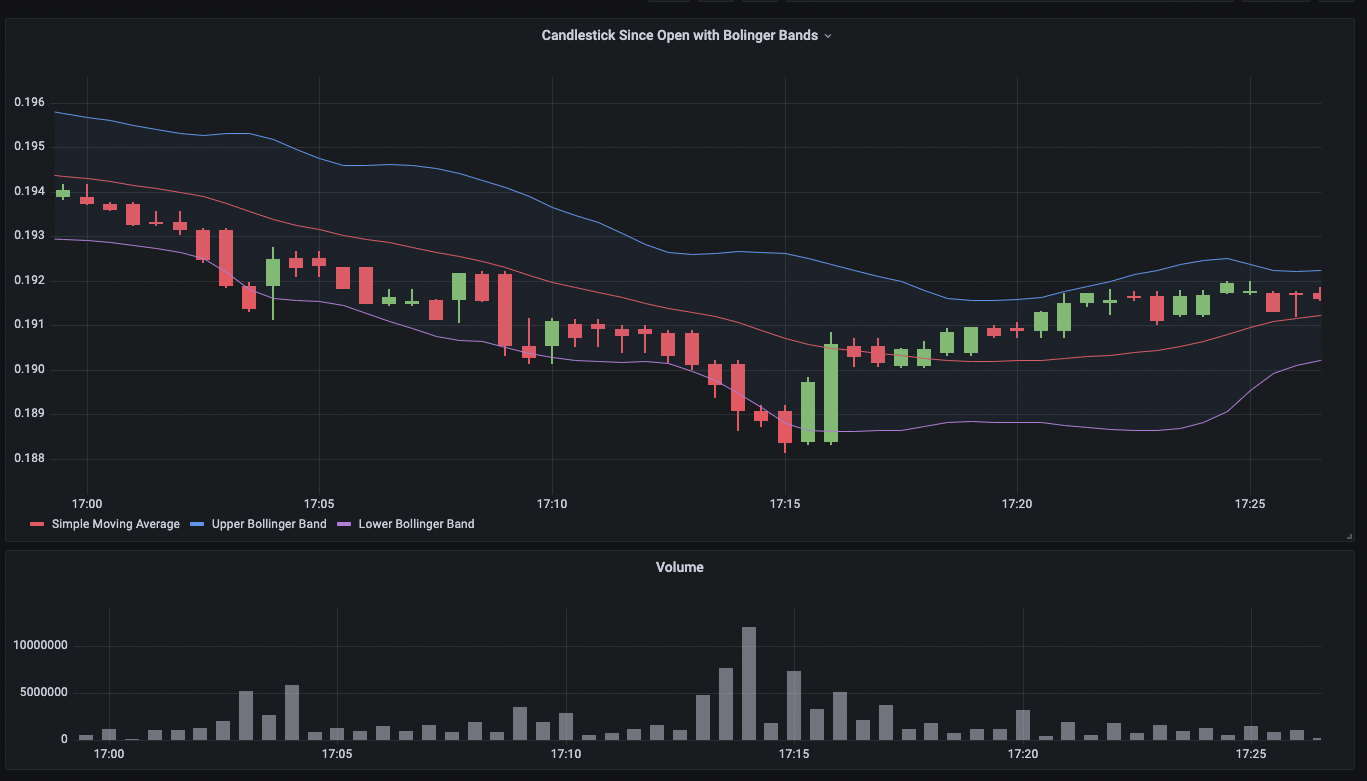
Grafana 8.3 includes a new Candlestick panel that is so much more. Beyond candlesticks and open, high, low, close, behaviors, it includes customizable up/down colors, bar color determined by intra-period or inter-period movement of the data, volume histogram with matching colors, and the ability to detach or create a separate volume histogram to allow for more flexible dashboard design. The candlestick panel is based upon our time series panel meaning it also has support for additional data with the same configuration options and styles.
Geomap updates
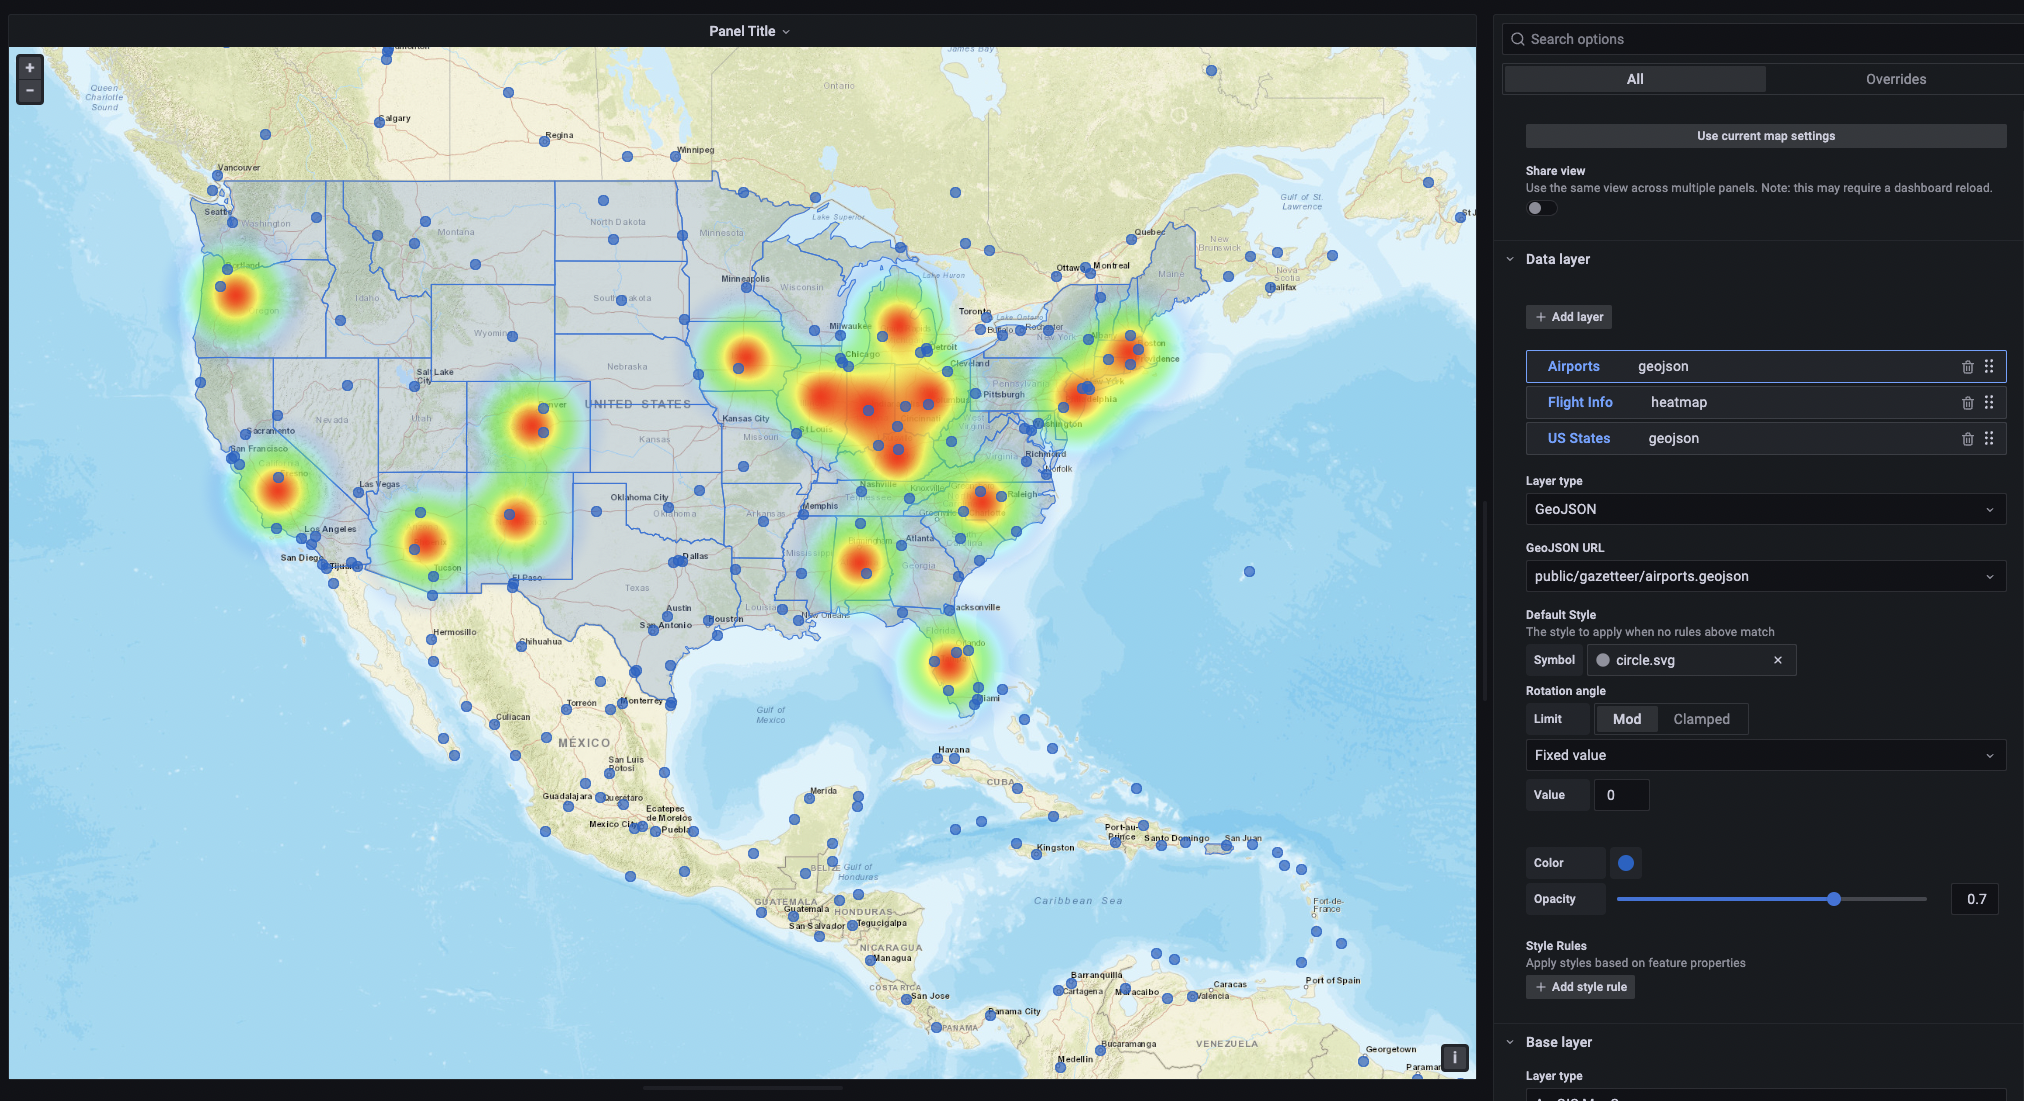
The Geomap panel has been updated to support multiple data layers. The panel can now be configured with multiple markers, heatmaps & GeoJSON layers. The layers can be individually configured, named, and re-ordered to create rich, multidimensional visualizations. Please see the documentation for details on how you can set up and configure these new configuration options.
Grafana Alerting
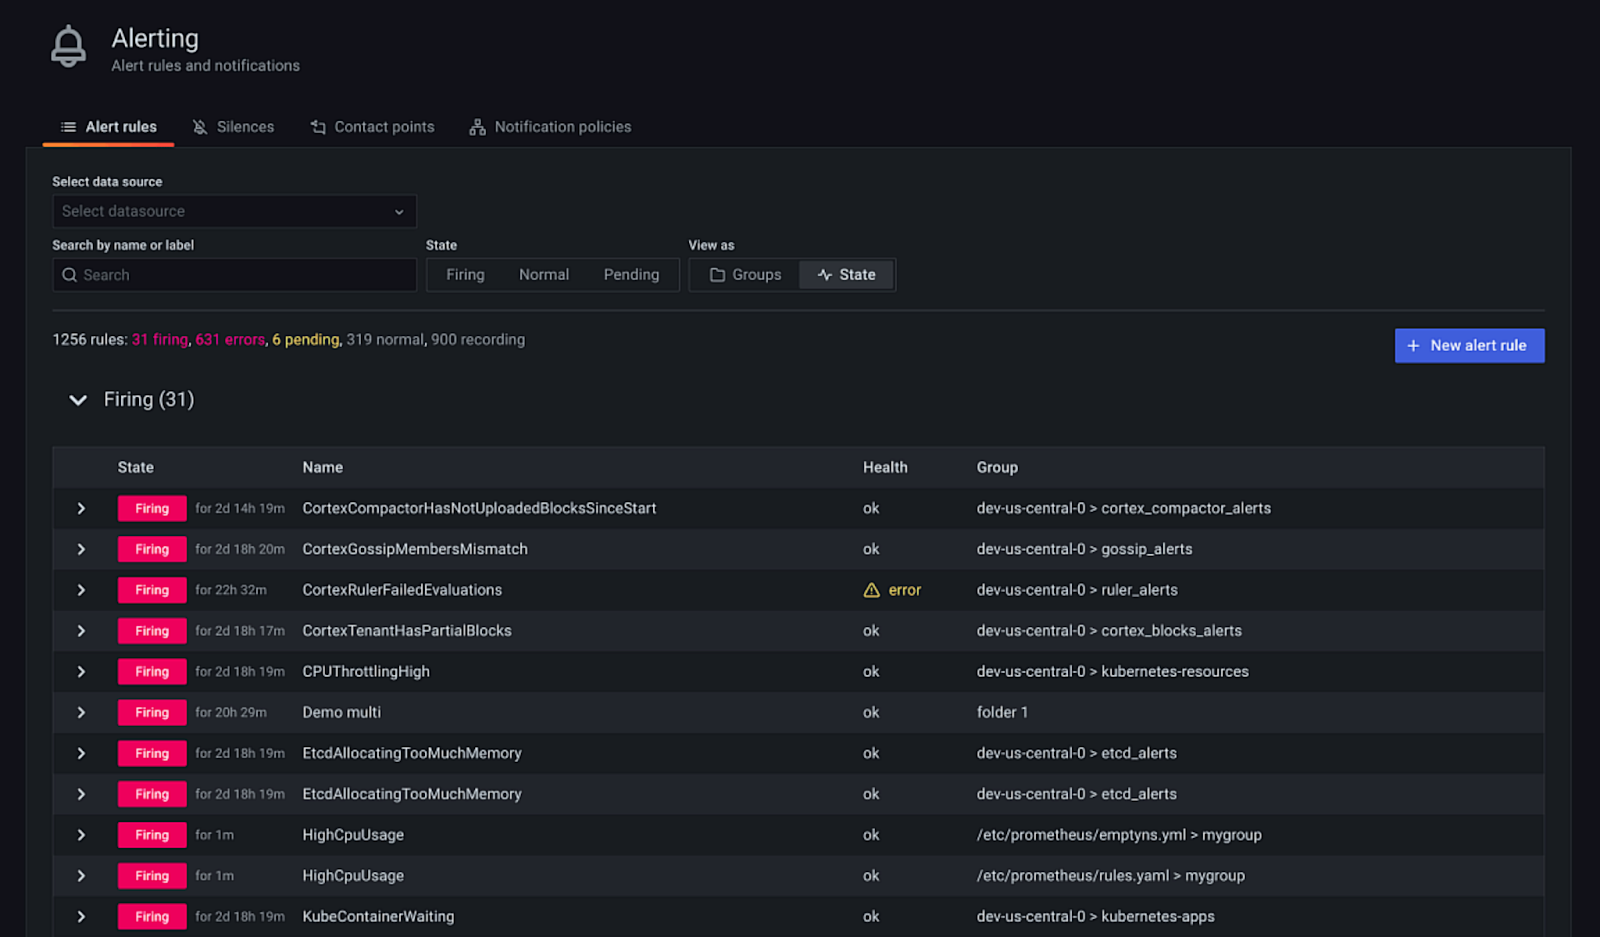
Grafana Alerting is now the default alerting experience for all new Open Source installations of Grafana 8.3. Grafana Alerting in 8.3 includes the ability to test contact points and notification routing. Grafana 8.3 also adds the ability to configure and use external, Prometheus-style alert managers from within the Grafana Alerting workflow.
Support for AWS CloudWatch Metrics Insights
Grafana and Amazon Managed Grafana now support AWS Metrics Insights – a fast, flexible, SQL-based query engine that enables you to identify trends and patterns across millions of operational metrics in real time.
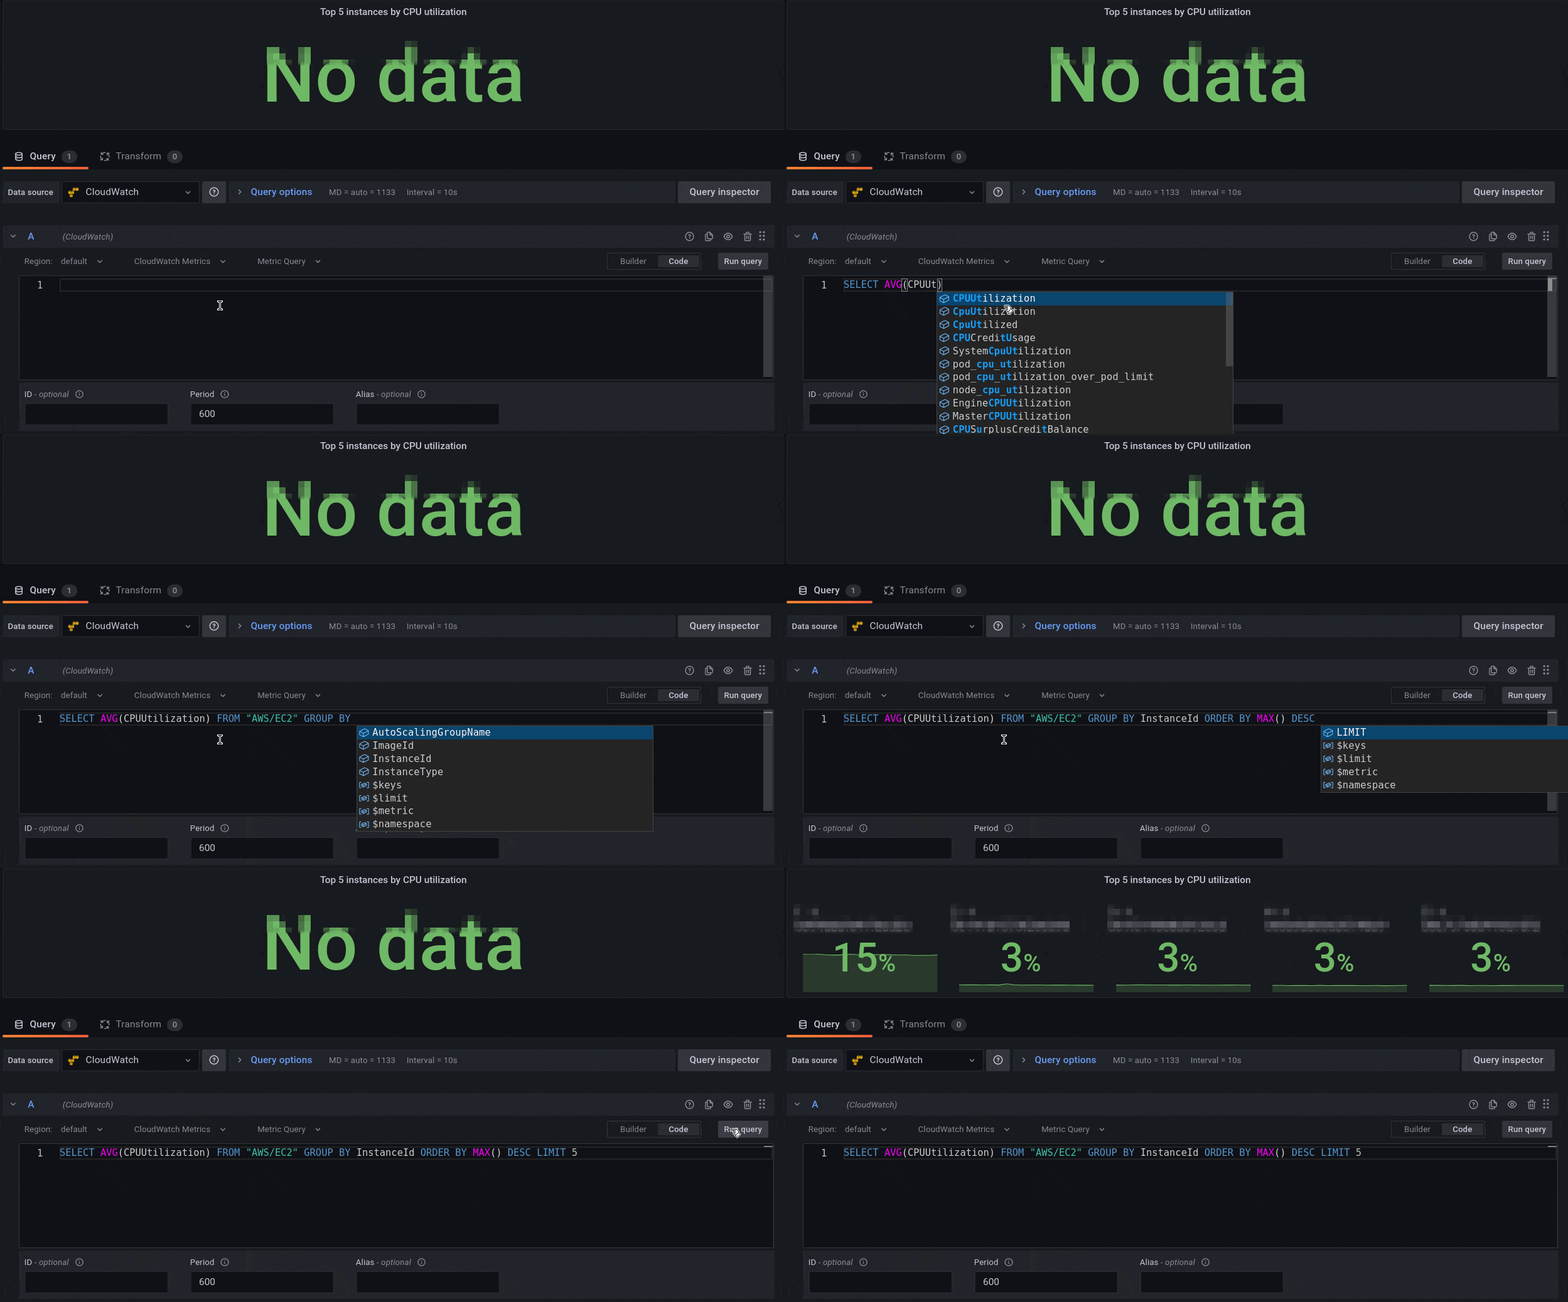
You can use Metrics Insights in the AWS CloudWatch plugin. Using this new feature is as simple as selecting the Metric Query type. The Metric Query type has two different modes: a Builder mode and a Code editor mode.
The example below demonstrates using the new Metrics Insight capability to view the top 5 instances with the highest average CPU Utilization, ordered by maximum, in descending order. The code editor has built-in autocompletion support that gives suggestions throughout the composition of the query.
Grafana Enterprise
Recorded Queries
Recorded queries turn “point in time” data into time series.
Recorded queries allow you to export the results of certain non-time series queries to the Enterprise backend in order to store data over time and allow customers to construct their own time series.
This new feature is especially helpful for Enterprise customers using plugins because many new plugins, like ServiceNow and Jira, don’t return time series so customers weren’t able to plot historical data over time. With recorded queries, now they can! For more information
Assign role-based permissions directly to users with the new role picker (beta)
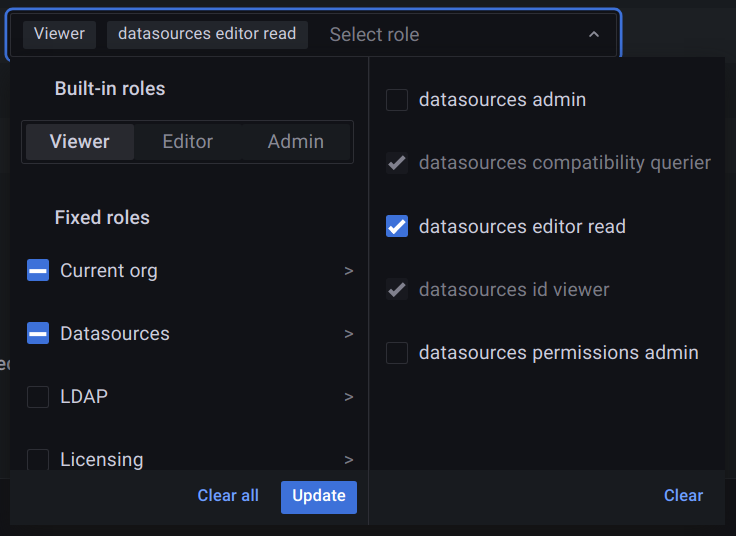
Sometimes the Viewer, Editor, and Admin roles just don’t fit what a certain user needs to do in Grafana. Now you can assign role-based roles directly to users, so they can create reports, use Explore mode, create data sources, and perform other specific actions in Grafana. The role picker can be access from the Grafana Admin user management page.
Use role-based access control for Organizations and Licensing (beta)
We’ve added new permissions to role-based access control to help you specify actions that users can perform. Now you can assign permissions to manage Organizations and License functions in Grafana, in addition to Users, Data Sources, Reports, and other resources. Role-based access control remains in beta and we will continue to add new permissions until all of Grafana’s endpoints are covered. For a complete list of the actions you can permit using role-based access control, see the reference.
Get your encryption key from a Key Management Service
Grafana’s database contains secrets, like the credentials used to query data sources, send alert notifications and perform other functions within Grafana. These secrets are encrypted using keys, which are usually stored in Grafana’s configuration file. Now you can get your encryption key from Amazon KMS, Azure Key Vault, or Hashicorp Vault. This allows you to centrally manage your Grafana encryption key and reduce the chances it will leak.
In order to support this, we’ve upgraded Grafana Enterprise to use envelope encryption, which complements the KMS integration by adding a layer of indirection to the encryption process. Instead of encrypting all secrets with a single key, Grafana uses a set of keys called data encryption keys (DEKs) to encrypt them. These data encryption keys are themselves encrypted with a single key encryption key (KEK). With envelope encryption, you can store a KEK in your KMS, and still quickly encrypt and decrypt data using DEKs stored within the Grafana database.
Pay the same for all users, regardless of their permissions
Are you tired of managing user permissions because your license only allows a certain number of Viewers and Editors or Admins? So were we. We’ve added support for combined user pricing, where all users cost the same and fall into the same license bucket in Grafana Enterprise. This is a specific license option and must be updated in your contract. To learn more, refer to our licensing docs. To switch to combined user pricing, contact your Grafana Labs account team.

Author dashboards faster with resource caching
Your query editor just became faster. Query caching improves query performance and sometimes reduces cost, by reducing the number of repetitive queries performed against data sources. Resource caching does the same thing but for resource calls, like retrieving the list of applications in the AppDynamics editor, the list of metrics from Datadog, or the list of values in a template variable dropdown. This makes for a zippier user experience for everyone writing queries in Grafana.
Review audit logs for more services, like alerting
Audit logs are a record of the actions users perform in Grafana, which you can investigate in case of a security incident or to understand Grafana usage better. We’ve added audit logs for new actions performed against plugins, data sources, library elements, and Grafana’s new alerting service. This ensures that if a user makes a change anywhere in Grafana Enterprise, you’ll have a record of it. For details, refer to the Auditing docs.


