Important: This documentation is about an older version. It's relevant only to the release noted, many of the features and functions have been updated or replaced. Please view the current version.
Tempo query editor
The Tempo data source’s query editor helps you query and display traces from Tempo in Explore.
This topic explains configuration and queries specific to the Tempo data source. For general documentation on querying data sources in Grafana, see Query and transform data.
Query Tempo search
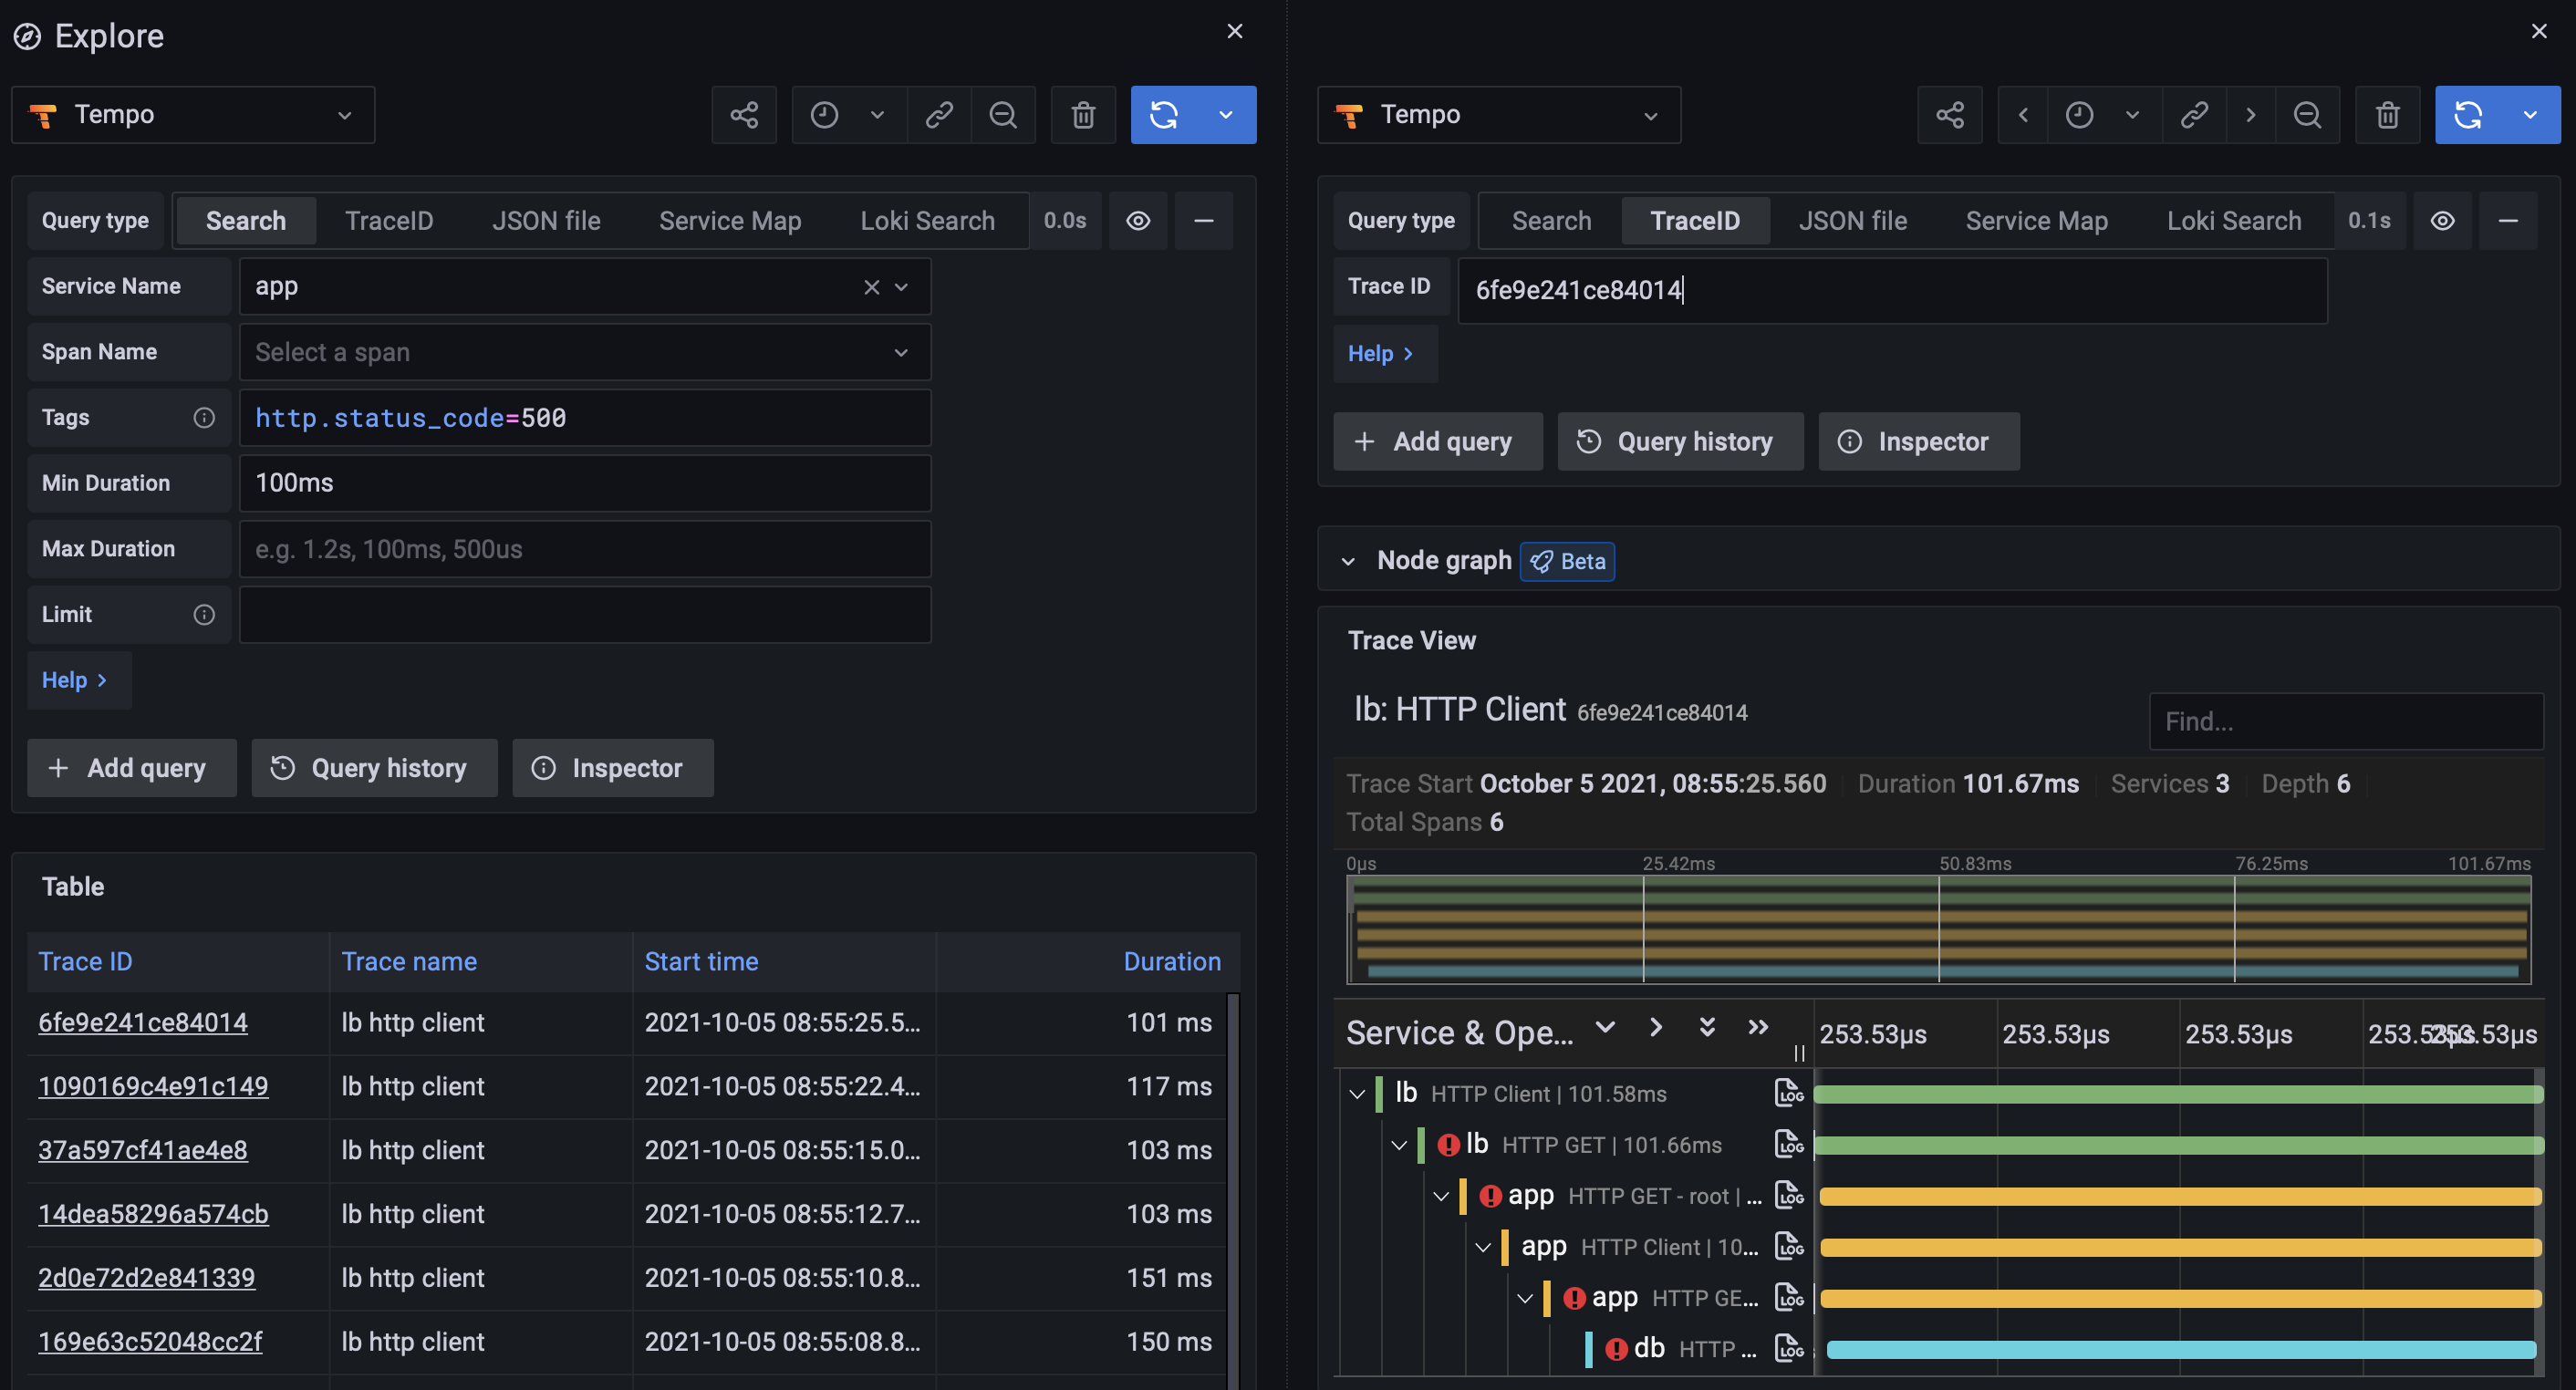
Tempo search is an experimental feature behind a feature toggle. Use this to search for traces by service name, span name, duration range, or process-level attributes that are included in your application’s instrumentation, such as HTTP status code and customer ID.
To configure Tempo and the Tempo data source for search, refer to Configure the data source.

Search recent traces
You can search recent traces held in Tempo’s ingesters. By default, ingesters store the last 15 minutes of tracing data.
To configure your Tempo data source to use this feature, refer to the Tempo documentation.
Search the backend datastore
Tempo includes the ability to search the entire backend datastore.
To configure your Tempo data source to use this feature, refer to the Tempo documentation.
Query Loki for traces
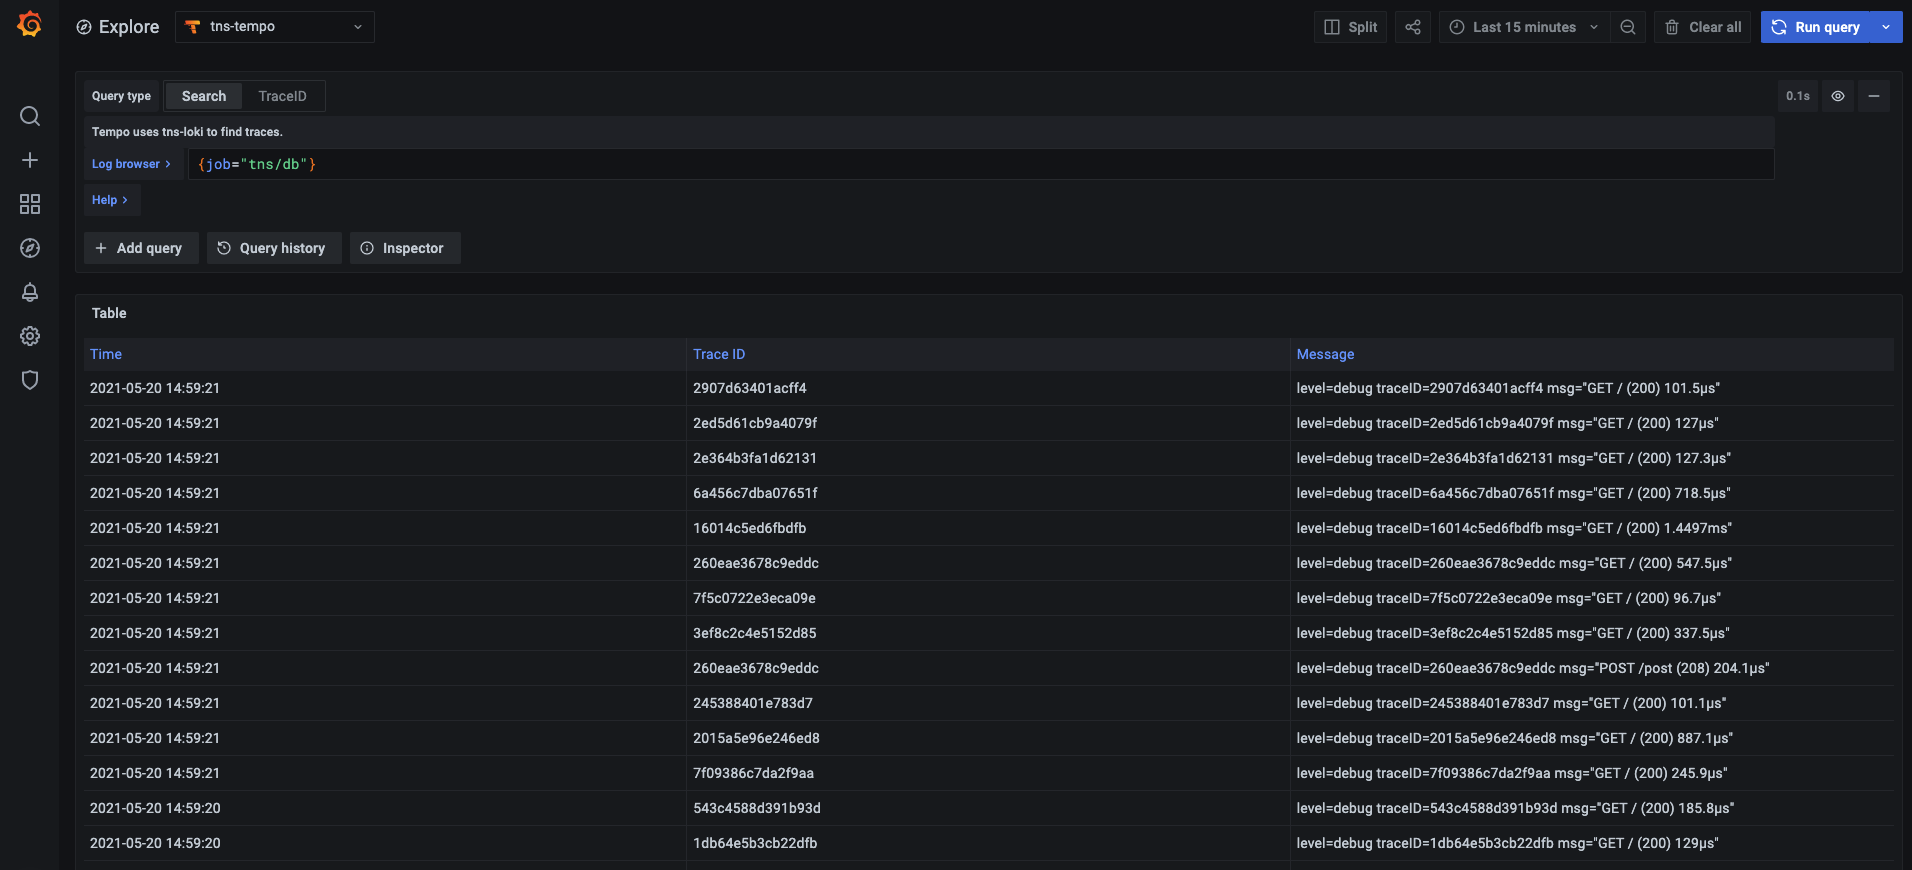
To find traces to visualize, you can use the Loki query editor. For results, you must configure derived fields in the Loki data source that point to this data source.

Trace ID search
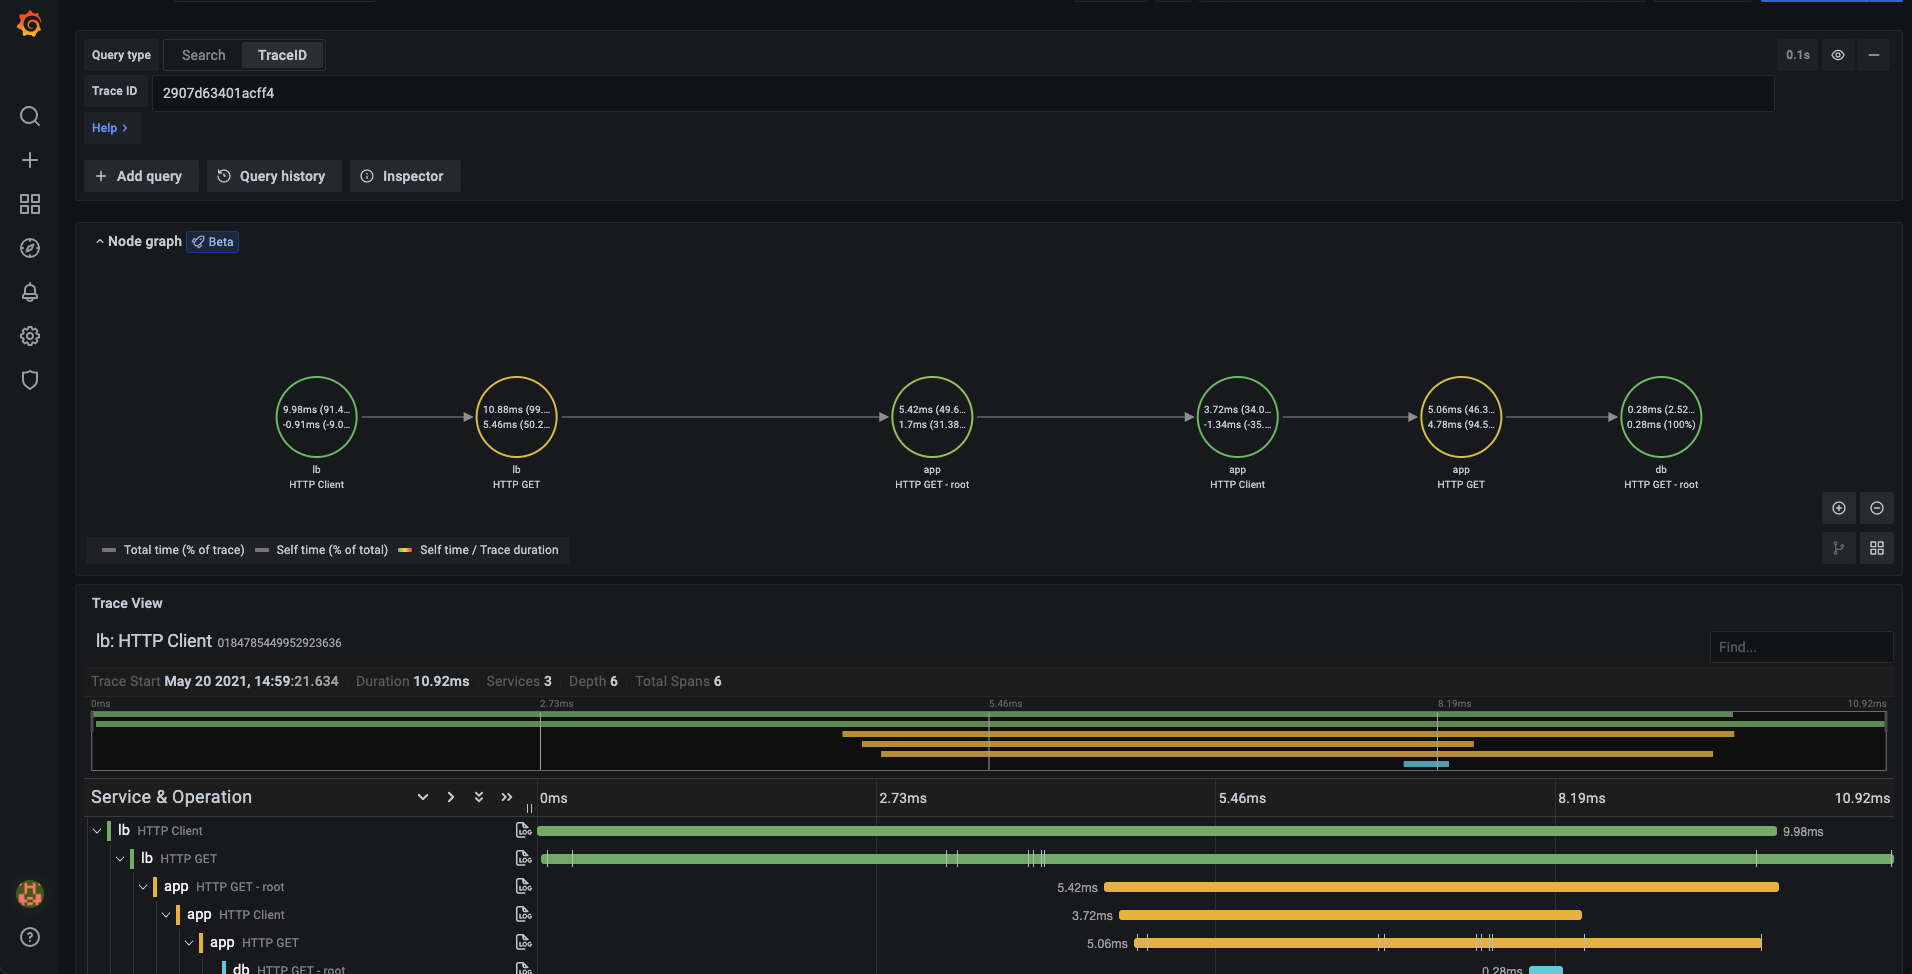
To query a particular trace:
- Select the TraceID query type.
- Enter the trace’s ID into the Trace ID field.


