Important: This documentation is about an older version. It's relevant only to the release noted, many of the features and functions have been updated or replaced. Please view the current version.
Prometheus data source
Grafana ships with built-in support for Prometheus. This topic explains options, variables, querying, and other features specific to the Prometheus data source, which include its feature-rich code editor for queries and visual query builder.
For instructions on how to add a data source to Grafana, refer to the administration documentation. Only users with the organization administrator role can add data sources. Administrators can also configure the data source via YAML with Grafana’s provisioning system.
Once you’ve added the data source, you can configure it so that your Grafana instance’s users can create queries in its query editor when they build dashboards, use Explore, and annotate visualizations.
Prometheus API
The Prometheus data source also works with other projects that implement the Prometheus querying API.
For more information on how to query other Prometheus-compatible projects from Grafana, refer to the specific project’s documentation:
Configure the data source
To access the data source configuration page:
- Hover the cursor over the Configuration (gear) icon.
- Select Data Sources.
- Select the Prometheus data source.
Set the data source’s basic configuration options carefully:
| Name | Description |
|---|---|
Name | The data source name. This is how you refer to the data source in panels and queries. |
Default | Default data source that is pre-selected for new panels. |
URL | The URL of your Prometheus server, for example, http://prometheus.example.org:9090. |
Access | Only Server access mode is functional. If Server mode is already selected this option is hidden. Otherwise change to Server mode to prevent errors. |
Basic Auth | Enable basic authentication to the Prometheus data source. |
User | User name for basic authentication. |
Password | Password for basic authentication. |
Manage alerts via Alerting UI | Toggle whether to enable Alertmanager integration for this data source. |
Scrape interval | Set this to the typical scrape and evaluation interval configured in Prometheus. Defaults to 15s. |
HTTP method | Use either POST or GET HTTP method to query your data source. POST is the recommended and pre-selected method as it allows bigger queries. Change this to GET if you have a Prometheus version older than 2.1 or if POST requests are restricted in your network. |
Type | The type of your Prometheus server; Prometheus, Cortex, Thanos, Mimir. When selected, the Version field attempts to populate automatically using the Prometheus buildinfo API. Some Prometheus types, such as Cortex, don’t support this API and must be manually populated. |
Version | The version of your Prometheus server, note that this field is not visible until the Prometheus type is selected. |
Disable metrics lookup | Checking this option will disable the metrics chooser and metric/label support in the query field’s autocomplete. This helps if you have performance issues with bigger Prometheus instances. |
Custom query parameters | Add custom parameters to the Prometheus query URL. For example timeout, partial_response, dedup, or max_source_resolution. Multiple parameters should be concatenated together with an ‘&’. |
| Exemplars configuration | |
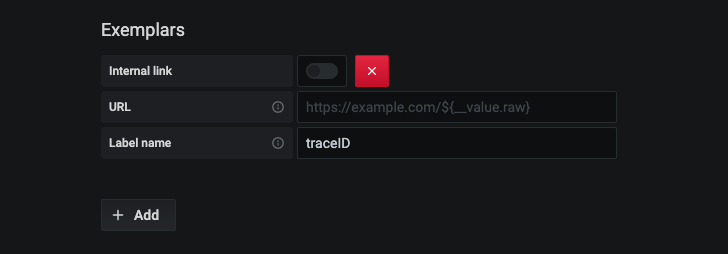
Internal link | Enable this option if you have an internal link. When enabled, this reveals the data source selector. Select the backend tracing data store for your exemplar data. |
Data source | (Visible only if you enable Internal link) Selects the backend tracing data store for your exemplar data. |
URL | (Visible only if you disable Internal link) Defines the external link’s full URL. You can interpolate the value from the field by using the ${__value.raw} macro. |
URL Label | (Optional) Adds a custom display label to override the value of the Label name field. |
Label name | Adds a name for the exemplar traceID property. |
Provision the data source
You can define and configure the data source in YAML files as part of Grafana’s provisioning system. For more information about provisioning, and for available configuration options, refer to Provisioning Grafana.
Provisioning example
apiVersion: 1

datasources:
  - name: Prometheus
    type: prometheus
    # Access mode - proxy (server in the UI) or direct (browser in the UI).
    access: proxy
    url: http://localhost:9090
    jsonData:
      httpMethod: POST
      manageAlerts: true
      prometheusType: Prometheus
      prometheusVersion: 2.37.0
      exemplarTraceIdDestinations:
        # Field with internal link pointing to data source in Grafana.
        # datasourceUid value can be anything, but it should be unique across all defined data source uids.
        - datasourceUid: my_jaeger_uid
          name: traceID

        # Field with external link.
        - name: traceID
          url: 'http://localhost:3000/explore?orgId=1&left=%5B%22now-1h%22,%22now%22,%22Jaeger%22,%7B%22query%22:%22$${__value.raw}%22%7D%5D'
View Grafana metrics with Prometheus
Grafana exposes metrics for Prometheus on the /metrics endpoint.
We also bundle a dashboard within Grafana so you can start viewing your metrics faster.
To import the bundled dashboard:
Navigate to the data source’s configuration page.
Select the Dashboards tab.
This displays dashboards for Grafana and Prometheus.
Select Import for the dashboard to import.
For details about these metrics, refer to Internal Grafana metrics.
Amazon Managed Service for Prometheus
The Prometheus data source works with Amazon Managed Service for Prometheus.
If you use an AWS Identity and Access Management (IAM) policy to control access to your Amazon Elasticsearch Service domain, you must use AWS Signature Version 4 (AWS SigV4) to sign all requests to that domain.
For details on AWS SigV4, refer to the AWS documentation.
AWS Signature Version 4 authentication
Note: Available in Grafana v7.3.5 and higher.
To connect the Prometheus data source to Amazon Managed Service for Prometheus using SigV4 authentication, refer to the AWS guide to Set up Grafana open source or Grafana Enterprise for use with AMP.
If you run Grafana in an Amazon EKS cluster, follow the AWS guide to Query using Grafana running in an Amazon EKS cluster.
Configure exemplars
Note: Available in Prometheus v2.26 and higher with Grafana v7.4 and higher.
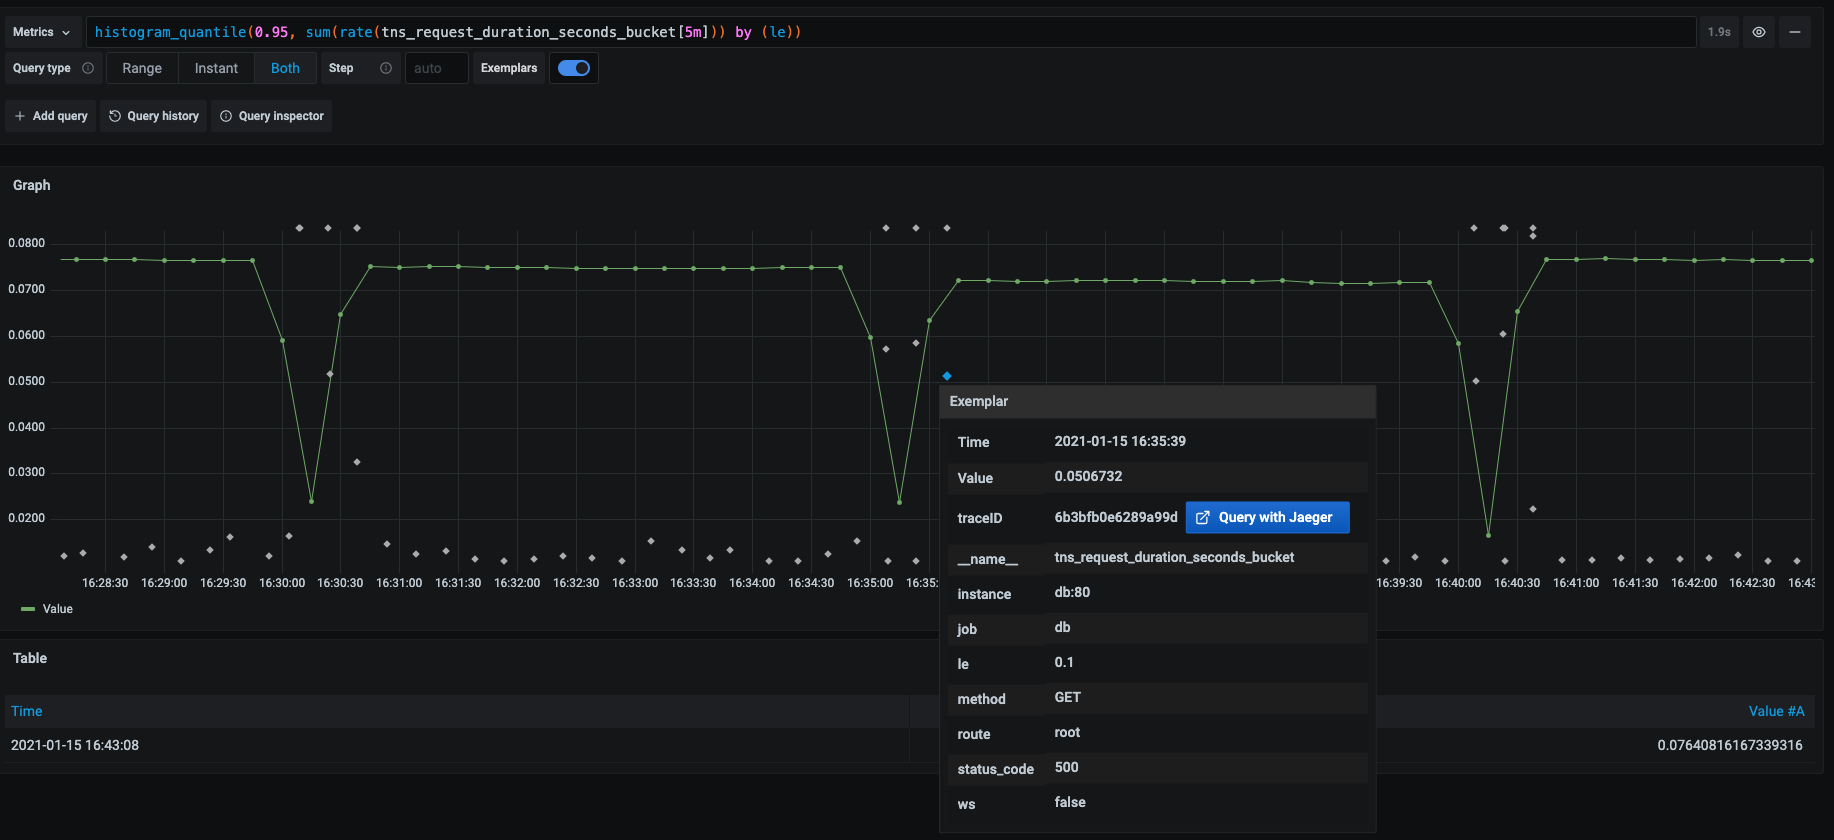
Grafana 7.4 and higher can show exemplars data alongside a metric both in Explore and in Dashboards. Exemplars associate higher-cardinality metadata from a specific event with traditional time series data.

Configure Exemplars in the data source settings by adding external or internal links.

Query the data source
You can create queries with the Prometheus data source’s query editor.
For details, refer to the query editor documentation.
Use template variables
Instead of hard-coding details such as server, application, and sensor names in metric queries, you can use variables. Grafana lists these variables in dropdown select boxes at the top of the dashboard to help you change the data displayed in your dashboard. Grafana refers to such variables as template variables.
For details, see the template variables documentation.


