Important: This documentation is about an older version. It's relevant only to the release noted, many of the features and functions have been updated or replaced. Please view the current version.
What’s new in Grafana v8.1
Note: This topic will be updated frequently between now and the final release.
Grafana 8.1 builds upon our promise of a composable, open observability platform with new panels and extends functionality launched in Grafana 8.0. We’ve got new Geomap and Annotations panels, and some great updates to the Time Series panel. We’ve also got new transformations and updates to data sources. For our enterprise customers, there are additions to fine grained access control, updates to the reporting schedule and query caching, and more. Read on to learn more.
In addition to what is summarized here, you might also be interested in our announcement blog post. For all the technical details, check out the complete CHANGELOG.md.
Grafana OSS features
These features are included in the Grafana open source edition.
Geomap panel
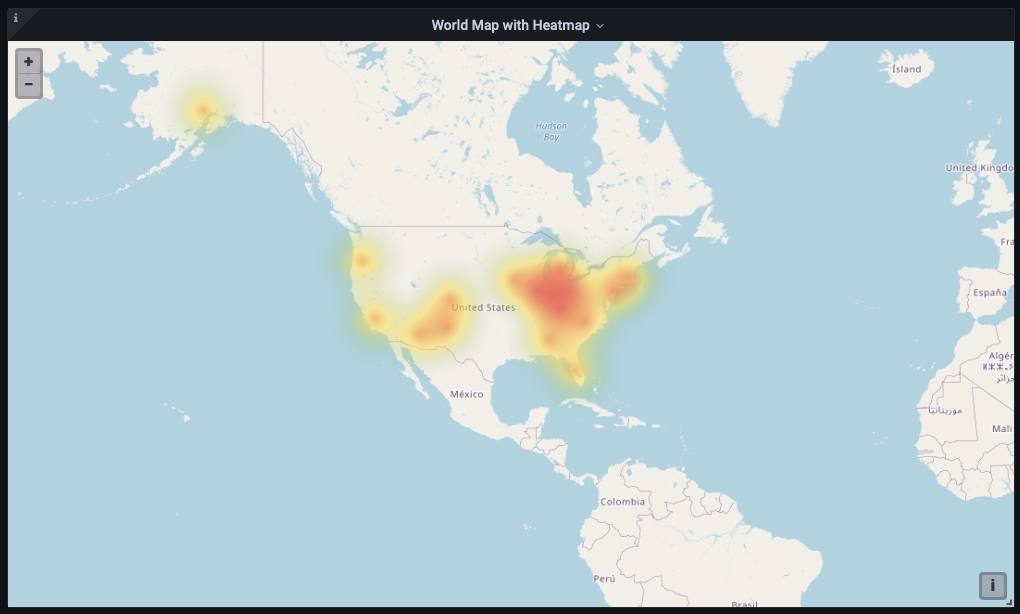
Grafana 8.1 introduces the foundation for our new map panel. This new panel leverages OpenLayers and gives us a flexible solution for extending the way we use the new Geomap panel moving forward. The new Geomap panel includes multiple base layer styles (map layer options), as well as a more open data layer. The data layer can use coordinates and geo-hashed data in addition to a lookup table.
The Geomap panel is also able to share views across multiple Geomap panels on the same dashboard, making it straightforward to visualize and explore multiple types of geospatial data using the same map zoom and focus settings. For more information, refer to Geomap panel.
Annotation panel
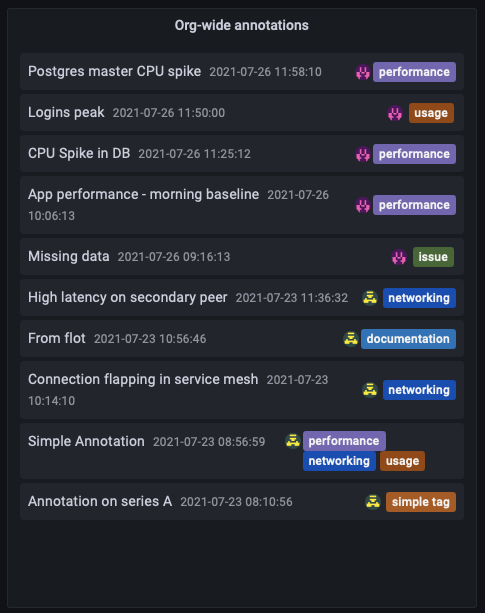
The new Annotations panel shows a list of available annotations you can use to create lists of annotated data available within your organization. Various options are available to filter the list based on the tags and on the current dashboard. This panel makes it easy to find and filter annotated data within and across multiple dashboards.

Time series panel updates
The time series panel has been updated with the ability to color series and line by thresholds or gradient color scales. This allows users to create panels where the line color can change dynamically based on thresholds or using gradient color scales. It adds a layer of visibility to your data, making it easier to view the changes across thresholds at a glance quickly.
Color scheme From thresholds:
Color scheme: Green-Yellow-Red (by value)
For more on how to configure Graphs with by value color schemes read Graph and color schemes.
You can also create annotations in the new Time series panel bringing it closer to parity with the legacy Graph panel. To learn more, refer to the time series panel.
Transformations improvements
Grafana 8.1 includes some significant enhancements to transformations, including two new transformations designed around providing dynamic configuration to your panels and visulizations.
Config from query (Beta)
This transformation enables panel config (Threshold, Min, Max, etc.) to be derived from query results. For more information, refer to Config from query results.
Rows to fields (Beta)
This transformation enables rows in returned data to be converted into separate fields. Prior to this enhancement, you could style and configure fields individually, but not rows. For more information, refer to [Rows to fields transform].
Example, Input:
| Name | Value | Max |
|---|---|---|
| ServerA | 10 | 100 |
| ServerB | 20 | 200 |
| ServerC | 30 | 300 |
Output:
| ServerA (config: max=100) | ServerB (config: max=200) | ServerC (config: max=300) |
|---|---|---|
| 10 | 20 | 30 |
As you can see each row in the source data becomes a separate field. Each field now also has a max config option set. Options like Min, Max, Unit and Thresholds are all part of field configuration and if set like this will be used by the visualization instead of any options manually configured in the panel editor options pane.
For more on how to use this transformation, refer to Rows to fields transform.
Contextual & Inline Help
Additional inline help will be available for Transformations. We can now share examples of how to use specific transformations and point users directly to the appropriate place in the docs for more information.
Data source updates
The following data source updates are included with this Grafana release.
MySQL Data Source
We have added timezone support. As a result, you can now specify the time zone used in the database session, such as Europe/Berlin or +02:00.
Trace to logs improvements
We changed the default behavior from creating a 1-hour span Loki query to the only query at the exact time the trace span started for the duration of it. For more fine grained control over this, you can shift this time in the tracing data source settings. Also, it is now possible to shift the start time and end time of the Loki query by the set amount. For more information, refer to Trace to logs.
Prettify JSON for Logs in Explore
Added the ability to format JSON to make it easier to view, review and find relevant data in JSON format logs. This is a regular JSON log.

And here is the prettified JSON log.

For more on how to prettify JSON logs, refer to Visualization and Display options.
Plugin catalog - Updated UX and extended features
We’ve made some changes to the plugins UI to help make it easier to discover and manage your plugins. Enterprise users can now also manage enterprise plugins from within the catalog.
Documentation updates
New panel summaries and preview on the top level Visualizations page to help users pick or learn about specific visualizations more easily.
Upcoming changes to the Select component
The @grafana/ui exposes a Select component, and its variants MultiSelect, AsyncSelect, and AsyncMultiSelect. We have made some internal changes to these components to make the behavior and positioning more consistent in all scenarios.
To test the changes, you can use the menuShouldPortal property:
<Select menuShouldPortal {...otherProps} />Tests are most likely to be affected. There are some tips for fixing these in the original pull request at https://github.com/grafana/grafana/pull/36398.
We’d love as much feedback as possible about this change, because we are considering making this the default behavior in a future release of Grafana.
High availability setup support for Grafana Live
We have added an experimental HA setup support for Grafana Live with Redis. This resolves the limitation when clients were connected to different Grafana instances and those instances had no shared state. For additional information, refer to Configure Grafana Live HA setup.
Enterprise features
These features are included in the Grafana Enterprise edition.
New permissions for role-based access control
Role-based access control remains in beta. You can now grant or revoke permissions for Viewers, Editors, or Admins to use Explore mode, configure LDAP or SAML settings, or view the admin/stats page. These new permissions enhance the existing permissions that can be customized, namely permissions to access Users, Orgs, LDAP settings, and Reports in Grafana.
Fine grained access control allows you to customize roles and permissions in Grafana beyond the built-in Viewer, Editor, and Admin roles. As of 8.1, you can modify some of the permissions for any of these built-in roles. This is helpful if you’d like users to have more or fewer access permissions than a given role allows for by default. For an overview of role-based access control and a complete list of available permissions, refer to the Fine grained access control documentation.
New and improved reporting scheduler
We’ve enhanced the scheduler for Reports to be more flexible, so you can send reports at just the right time. When scheduling a report, you can now choose to send a report at custom intervals such as every 4 hours or every 2 weeks. You can also send a report for a limited time period by providing a start and end date, or send a report only on weekdays or on the last day of each month. This change accompanies some other recent improvements to Reporting, like the ability to choose template variables for reports and an improved UX for authoring reports. To learn more, refer to the reporting documentation.
Encrypt data in the query cache
Query caching was released in Grafana 8.0 and allows you to temporarily store the results of data source queries in a cache, so that Grafana reads repeated queries from there instead of from the data source itself. This reduces load on data sources, improves dashboard load times, and can save money for data sources that charge per query. To learn more about query caching see its overview page. To find out how to turn on encryption, refer to the caching configuration documentation.
You can now encrypt the query data cached by Grafana. This improves the security of query data, especially when your cache (like Redis) is shared with other services.
White labeling for the Grafana loading logo
You can now customize Grafana’s loading logo, which displays while Grafana is loading in a user’s browser. White labeling in Grafana Enterprise allows you to customize the look and feel of Grafana to match your product’s or company’s brand. This makes Grafana a more integrated part of your observability stack and keep Grafana consistent with other visualizations displayed in public.
To find out how you can configure it along with other Grafana UI elements, like the corner logo and application footer, refer to the White labeling topic of the Grafana Enterprise docs.
Oauth2 - Team Sync to Group Mapping
With Team Sync you can map your Generic OAuth groups to teams in Grafana so that the users are automatically added to the correct teams.


