Important: This documentation is about an older version. It's relevant only to the release noted, many of the features and functions have been updated or replaced. Please view the current version.
Add a Grafana library panel to a dashboard
Add a Grafana library panel to a dashboard when you want to provide visualizations to other dashboard users.
Before you begin
To add a library panel to a dashboard:
Hover over the + option on the left menu, then select Create from the drop-down options.
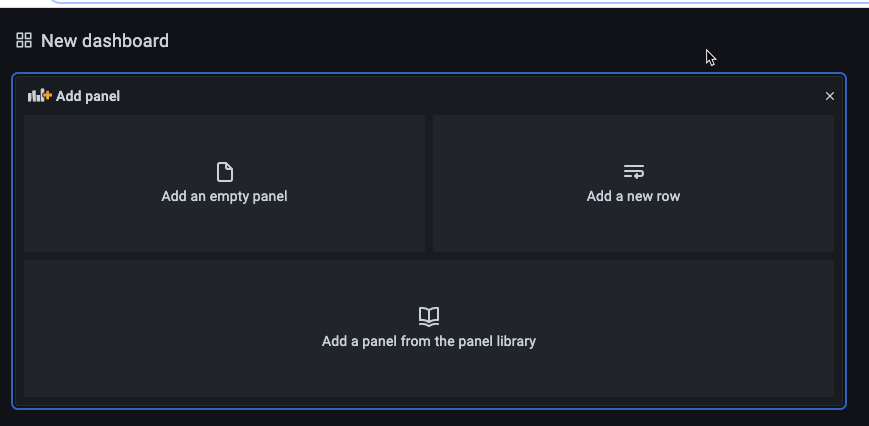
The Add panel dialog opens.
![Screenshot of the edit panel Screenshot of the edit panel]()
Screenshot of the edit panel Click the Add a panel from the panel library option.
You will see a list of your library panels.
Filter the list or search to find the panel you want to add.
Click a panel to add it to the dashboard.


