Important: This documentation is about an older version. It's relevant only to the release noted, many of the features and functions have been updated or replaced. Please view the current version.
Query management in Explore
To help with debugging queries, Explore allows you to investigate query requests and responses, as well as query statistics, via the Query inspector. This functionality is similar to the panel inspector tasks Inspect query performance and Inspect query request and response data.

Query history
Query history is a list of queries that you have used in Explore. The history is local to your browser and is not shared. To open and interact with your history, click the Query history button in Explore.
View query history
Query history lets you view the history of your querying. For each individual query, you can:
- Run a query.
- Create and/or edit a comment.
- Copy a query to the clipboard.
- Copy a shortened link with the query to the clipboard.
- Star a query.
Manage favorite queries
All queries that have been starred in the Query history tab are displayed in the Starred. This allows you to access your favorite queries faster and to reuse these queries without typing them from scratch.
Sort query history
By default, query history shows you the most recent queries. You can sort your history by date or by data source name in ascending or descending order.
- Click the Sort queries by field.
- Select one of the following options:
- Newest first
- Oldest first
- Data source A-Z
- Data source Z-A
Note: If you are in split mode, then the chosen sorting mode applies only to the active panel.
Filter query history
Filter query history in Query history and Starred tab by data source name:
- Click the Filter queries for specific data source(s) field.
- Select the data source for which you would like to filter your history. You can select multiple data sources.
In Query history tab it is also possible to filter queries by date using the slider:
- Use vertical slider to filter queries by date.
- By dragging top handle, adjust start date.
- By dragging top handle, adjust end date.
Note: If you are in split mode, filters are applied only to your currently active panel.
Search in query history
You can search in your history across queries and your comments. Search is possible for queries in the Query history tab and Starred tab.
- Click the Search queries field.
- Type the term you are searching for into search field.
Query history settings
You can customize the query history in the Settings tab. Options are described in the table below.
| Setting | Default value |
|---|---|
| Period of time for which Grafana will save your query history | 1 week |
| Change the default active tab | Query history tab |
| Only show queries for data source currently active in Explore | True |
| Clear query history | Permanently deletes all stored queries. |
Note: Query history settings are global, and applied to both panels in split mode.
Prometheus-specific Features
The first version of Explore features a custom querying experience for Prometheus. When a query is executed, it actually executes two queries, a normal Prometheus query for the graph and an Instant Query for the table. An Instant Query returns the last value for each time series which shows a good summary of the data shown in the graph.
Metrics explorer
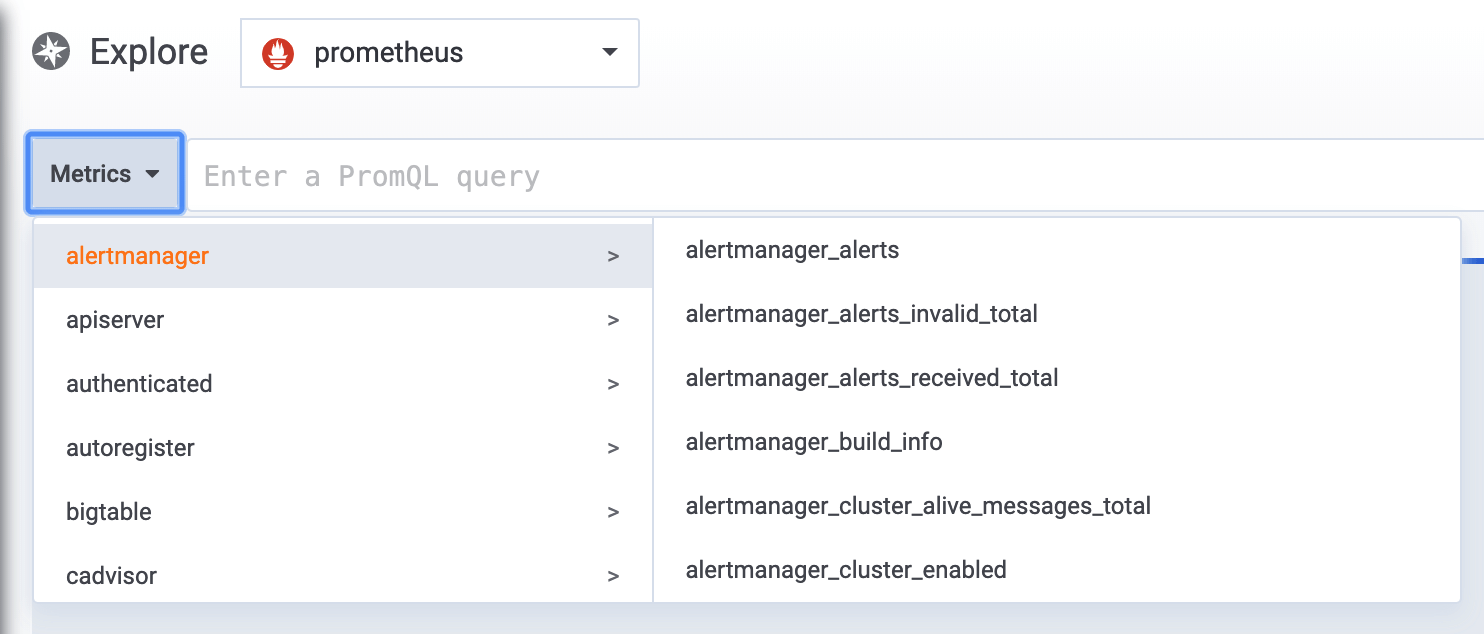
On the left side of the query field, click Metrics to open the Metric Explorer. This shows a hierarchical menu with metrics grouped by their prefix. For example, all Alertmanager metrics are grouped under the alertmanager prefix. This is a good starting point if you just want to explore which metrics are available.

Query field
The Query field supports autocomplete for metric names, function and works mostly the same way as the standard Prometheus query editor. Press the enter key to execute a query.
The autocomplete menu can be triggered by pressing Ctrl+Space. The Autocomplete menu contains a new History section with a list of recently executed queries.
Suggestions can appear under the query field - click on them to update your query with the suggested change.
- For counters (monotonically increasing metrics), a rate function will be suggested.
- For buckets, a histogram function will be suggested.
- For recording rules, possible to expand the rules.
Table filters
Click on the filter button in the “label” column of a Table panel to add filters to the query expression. You can add filters for multiple queries as well - the filter is added for all the queries.


