Important: This documentation is about an older version. It's relevant only to the release noted, many of the features and functions have been updated or replaced. Please view the current version.
AWS CloudWatch data source
Grafana ships with built-in support for CloudWatch. This topic describes queries, templates, variables, and other configuration specific to the CloudWatch data source. For instructions on how to add a data source to Grafana, refer to Add a data source. Only users with the organization admin role can add data sources.
Once you have added the Cloudwatch data source, you can build dashboards or use Explore with CloudWatch metrics and CloudWatch Logs.
Note: For troubleshooting issues when setting up the Cloudwatch data source, check the
/var/log/grafana/grafana.logfile.
Configure the CloudWatch data source
To access data source settings, hover your mouse over the Configuration (gear) icon, then click Data Sources, and then click the AWS Cloudwatch data source.
For authentication options and configuration details, see AWS authentication topic.
CloudWatch specific data source configuration
IAM policies
Grafana needs permissions granted via IAM to be able to read CloudWatch metrics and EC2 tags/instances/regions/alarms. You can attach these permissions to the IAM role or IAM user configured in the previous step.
Metrics only example:
{
  "Version": "2012-10-17",
  "Statement": [
    {
      "Sid": "AllowReadingMetricsFromCloudWatch",
      "Effect": "Allow",
      "Action": [
        "cloudwatch:DescribeAlarmsForMetric",
        "cloudwatch:DescribeAlarmHistory",
        "cloudwatch:DescribeAlarms",
        "cloudwatch:ListMetrics",
        "cloudwatch:GetMetricData",
        "cloudwatch:GetInsightRuleReport"
      ],
      "Resource": "*"
    },
    {
      "Sid": "AllowReadingTagsInstancesRegionsFromEC2",
      "Effect": "Allow",
      "Action": ["ec2:DescribeTags", "ec2:DescribeInstances", "ec2:DescribeRegions"],
      "Resource": "*"
    },
    {
      "Sid": "AllowReadingResourcesForTags",
      "Effect": "Allow",
      "Action": "tag:GetResources",
      "Resource": "*"
    }
  ]
}
Logs only example:
{
  "Version": "2012-10-17",
  "Statement": [
    {
      "Sid": "AllowReadingLogsFromCloudWatch",
      "Effect": "Allow",
      "Action": [
        "logs:DescribeLogGroups",
        "logs:GetLogGroupFields",
        "logs:StartQuery",
        "logs:StopQuery",
        "logs:GetQueryResults",
        "logs:GetLogEvents"
      ],
      "Resource": "*"
    },
    {
      "Sid": "AllowReadingTagsInstancesRegionsFromEC2",
      "Effect": "Allow",
      "Action": ["ec2:DescribeTags", "ec2:DescribeInstances", "ec2:DescribeRegions"],
      "Resource": "*"
    },
    {
      "Sid": "AllowReadingResourcesForTags",
      "Effect": "Allow",
      "Action": "tag:GetResources",
      "Resource": "*"
    }
  ]
}
Metrics and Logs example:
{
  "Version": "2012-10-17",
  "Statement": [
    {
      "Sid": "AllowReadingMetricsFromCloudWatch",
      "Effect": "Allow",
      "Action": [
        "cloudwatch:DescribeAlarmsForMetric",
        "cloudwatch:DescribeAlarmHistory",
        "cloudwatch:DescribeAlarms",
        "cloudwatch:ListMetrics",
        "cloudwatch:GetMetricData",
        "cloudwatch:GetInsightRuleReport"
      ],
      "Resource": "*"
    },
    {
      "Sid": "AllowReadingLogsFromCloudWatch",
      "Effect": "Allow",
      "Action": [
        "logs:DescribeLogGroups",
        "logs:GetLogGroupFields",
        "logs:StartQuery",
        "logs:StopQuery",
        "logs:GetQueryResults",
        "logs:GetLogEvents"
      ],
      "Resource": "*"
    },
    {
      "Sid": "AllowReadingTagsInstancesRegionsFromEC2",
      "Effect": "Allow",
      "Action": ["ec2:DescribeTags", "ec2:DescribeInstances", "ec2:DescribeRegions"],
      "Resource": "*"
    },
    {
      "Sid": "AllowReadingResourcesForTags",
      "Effect": "Allow",
      "Action": "tag:GetResources",
      "Resource": "*"
    }
  ]
}
Namespaces of Custom Metrics
Grafana is not able to load custom namespaces through the GetMetricData API. If you still want your custom metrics to show up in the fields in the query editor, you can specify the names of the namespaces containing the custom metrics in the Namespaces of Custom Metrics field. The field accepts a multiple namespaces, separated by a comma.
Timeout
Timeout specifically, for CloudWatch Logs queries. Log queries don’t recognize standard Grafana query timeout as they don’t keep a single request open and instead periodically poll for results. Because of limits on concurrently running queries in CloudWatch they can also take a longer time to finish.
X-Ray trace links
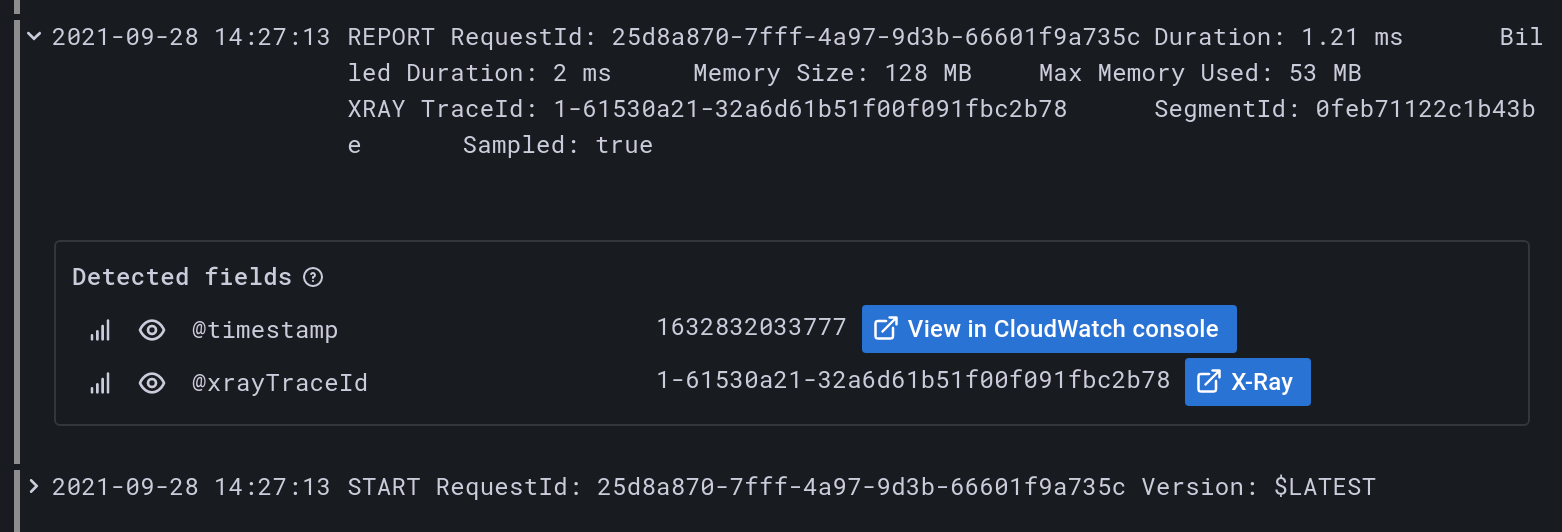
Link an X-Ray data source in the “X-Ray trace link” section of the configuration page to automatically add links in your logs when the log contains @xrayTraceId field.

The data source select will contain only existing data source instances of type X-Ray so in order to use this feature you need to have existing X-Ray data source already configured, see X-Ray docs for details.
The X-Ray link will then appear in the log details section which is accessible by clicking on the log row either in Explore or in dashboard Logs panel. To log the @xrayTraceId in your logs see the AWS X-Ray documentation. To provide the field to Grafana your log queries also have to contain the @xrayTraceId field, for example using query fields @message, @xrayTraceId.

CloudWatch query editor
The CloudWatch data source can query data from both CloudWatch metrics and CloudWatch Logs APIs, each with its own specialized query editor. You select which API you want to query with using the query mode switch on top of the editor.

Metrics query editor
The metrics query editor allows you to build two types of queries - Metric Search and Metric Query.
Using the Metric Search option
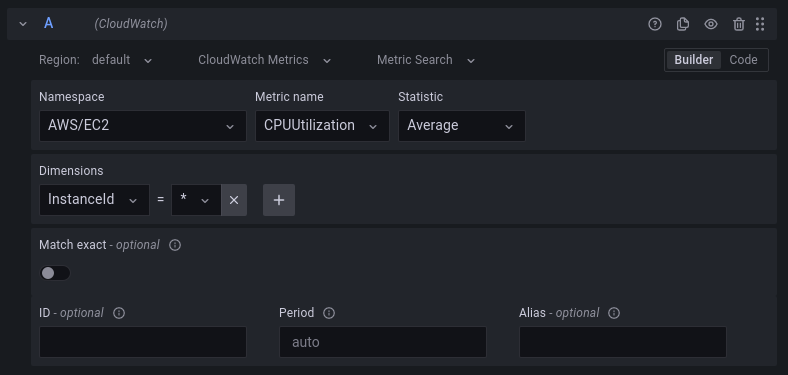
To create a valid Metric Search query specify the namespace, metric name and at least one statistic.
If Match Exact is enabled, you also need to specify all the dimensions of the metric you’re querying, so that the metric schema matches exactly. If Match Exact is disabled, you can specify any number of dimensions by which you’d like to filter. Up to 100 metrics matching your filter criteria will be returned.
Dynamic queries using dimension wildcards
You can monitor a dynamic list of metrics by using the asterisk (*) wildcard for one or more dimension values.

In this example, the query returns all metrics in the namespace AWS/EC2 with a metric name of CPUUtilization and ANY value for the InstanceId dimension are queried. This can help you monitor metrics for AWS resources, like EC2 instances or containers. When new instances are created as part of an auto scaling event, they will automatically appear in the graph without you having to track the new instance IDs. This capability is currently limited to retrieving up to 100 metrics.
You can expand the Query inspector button and click Meta Data to see the search expression that is automatically built to support wildcards. To learn more about search expressions, visit the CloudWatch documentation. By default, the search expression is defined in such a way that the queried metrics must match the defined dimension names exactly. This means that in the example only metrics with exactly one dimension with the name ‘InstanceId’ will be returned.

You can disable Match Exact to include metrics that have other dimensions defined. Disabling Match Exact also creates a search expression even if you don’t use wildcards. We simply search for any metric that matches at least the namespace, metric name, and all defined dimensions.
Multi-value template variables
When defining dimension values based on multi-valued template variables, a search expression is used to query for the matching metrics. This enables the use of multiple template variables in one query and also allows you to use template variables for queries that have the Match Exact option disabled.
Search expressions are currently limited to 1024 characters, so your query may fail if you have a long list of values. We recommend using the asterisk (*) wildcard instead of the All option if you want to query all metrics that have any value for a certain dimension name.
The use of multi-valued template variables is only supported for dimension values. Using multi-valued template variables for Region, Namespace, or Metric Name is not supported.
Metric math expressions
You can create new time series metrics by operating on top of CloudWatch metrics using mathematical functions. Arithmetic operators, unary subtraction and other functions are supported and can be applied to CloudWatch metrics. More details on the available functions can be found on AWS Metric Math
As an example, if you want to apply arithmetic operations on a metric, you can do it by giving an id (a unique string) to the raw metric as shown below. You can then use this id and apply arithmetic operations to it in the Expression field of the new metric.
Please note that in the case you use the expression field to reference another query, like queryA * 2, it will not be possible to create an alert rule based on that query.
Deep linking from Grafana panels to the CloudWatch console

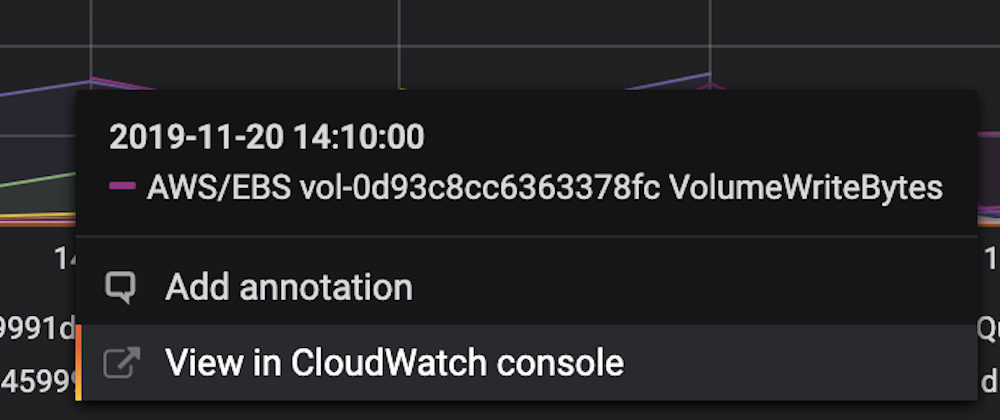
Left clicking a time series in the panel shows a context menu with a link to View in CloudWatch console. Clicking that link will open a new tab that will take you to the CloudWatch console and display all the metrics for that query. If you’re not currently logged in to the CloudWatch console, the link will forward you to the login page. The provided link is valid for any account but will only display the right metrics if you’re logged in to the account that corresponds to the selected data source in Grafana.
This feature is not available for metrics that are based on metric math expressions.
Using the Metric Query option
Note: This query option is available in Grafana 8.3 and higher versions only.
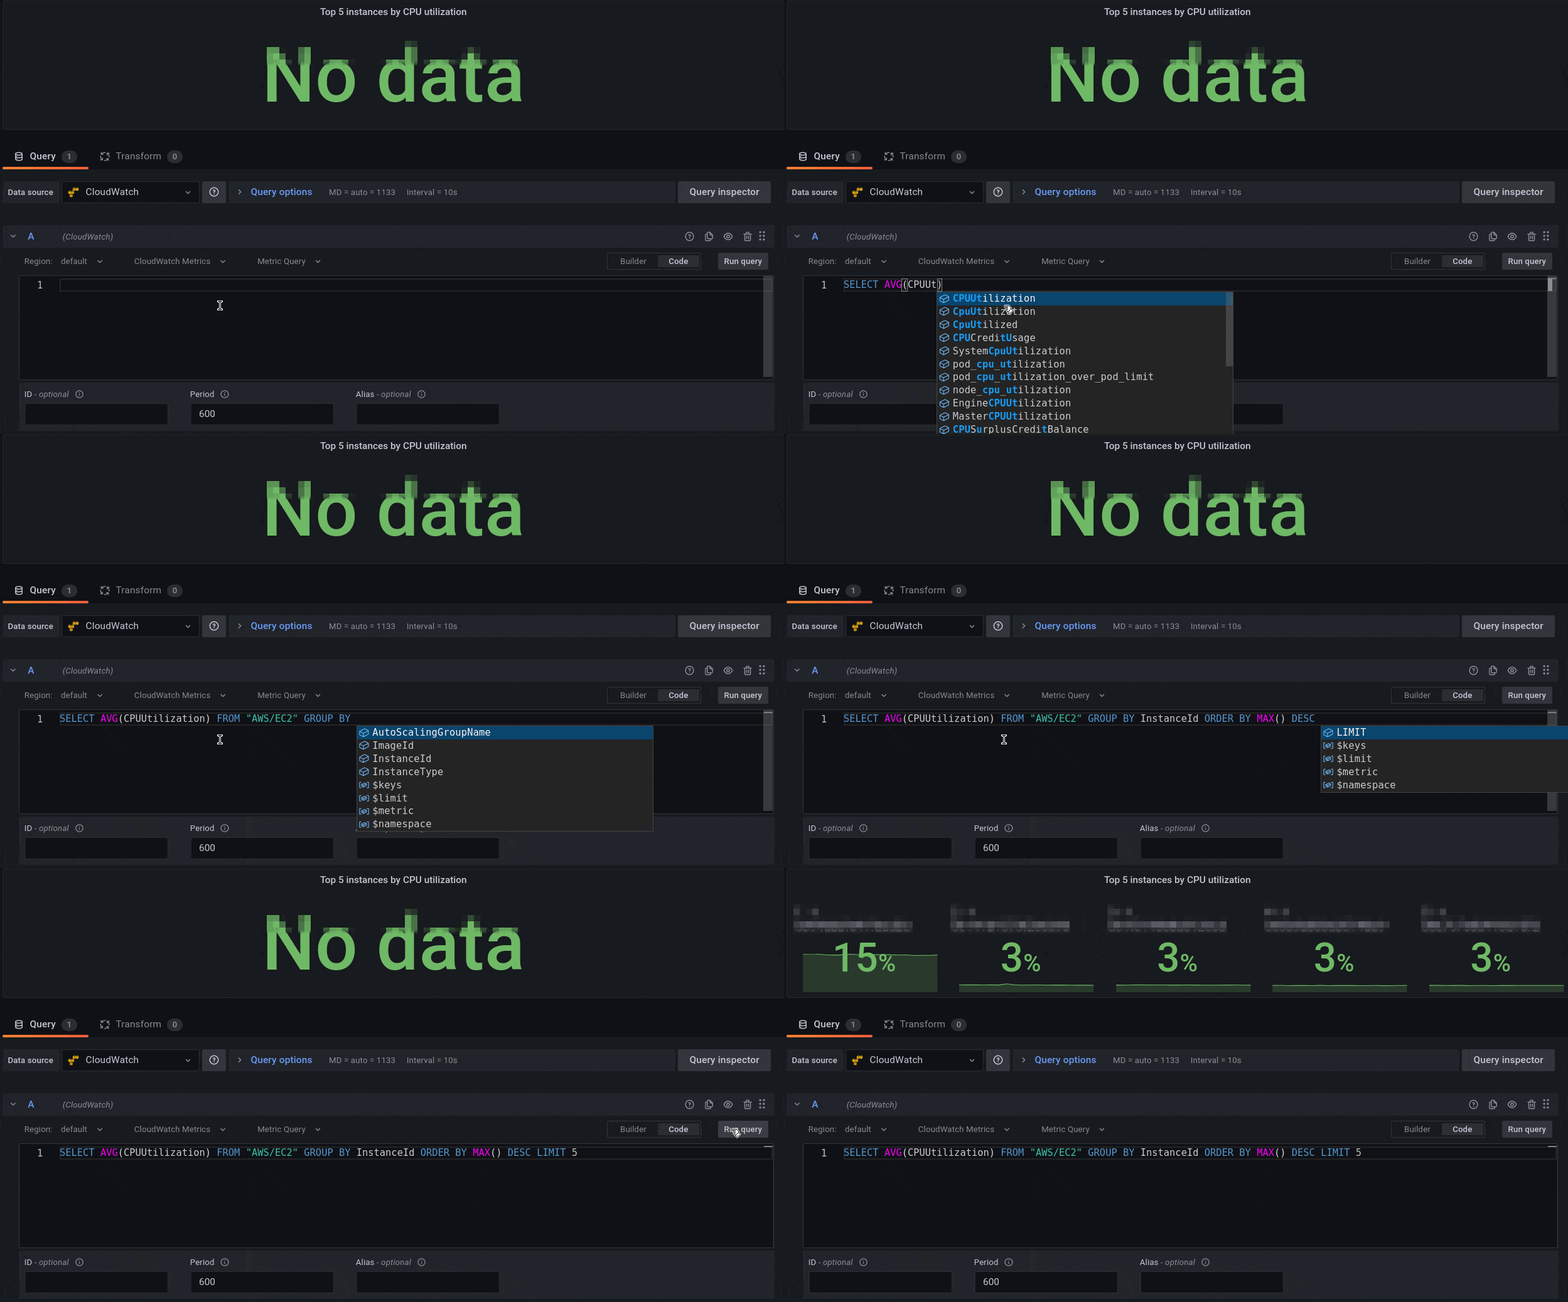
Metrics Query in the CloudWatch plugin is what is referred to as Metric Insights in the AWS console. It’s a fast, flexible, SQL-based query engine that enables you to identify trends and patterns across millions of operational metrics in real time. It uses a dialect of SQL. The query syntax is as follows.
SELECT FUNCTION(MetricName)
FROM Namespace | SCHEMA(...)
[ WHERE labelKey OPERATOR labelValue [AND|...]]
[ GROUP BY labelKey [, ...]]
[ ORDER BY FUNCTION() [DESC | ASC] ]
[ LIMIT number]
The following table provides basic explanation of the query keywords. For details about the Metrics Insights syntax, refer to the AWS documentation.
| Keyword | Description |
|---|---|
FUNCTION | Required. Specifies the aggregate function to use, and also specifies the name of the metric that is to be queried. Valid values are AVG, COUNT, MAX, MIN, and SUM |
MetricName | Required. For example, CPUUtilization. |
FROM | Required. Specifies the source of the metric. You can specify either the metric namespace that contains the metric that is to be queried, or a SCHEMA table function. Some namespace examples are 1AWS/EC2, AWS/Lambda. |
SCHEMA | Optional. Allows you to narrow down the query results to only the metrics that is an exact match or to metrics that do noy match. |
WHERE | Optional. Filters the results to only those metrics that match your specified expression. For example, WHERE InstanceType != 'c3.4xlarge'. |
GROUP BY | Optional. Groups the query results into multiple time series. For example, GROUP BY ServiceName. |
ORDER BY | Optional. Specifies the order of time series that are returned. Options are ASC, DESC. |
LIMIT | Optional. Limits the number of time series returned. |
For information about limits for the Metrics Insights, please refer to the AWS documentation.
Builder mode
To create a query in Builder mode:
- Browse and select a metric namespace, metric name, filter, group, and order options using information from the table above.
- For each of these options, choose from the list of possible options.
Grafana automatically constructs a SQL query based on your selections.
Code mode
To create a query in the Code mode:
- Write your SQL query.
- To run the query, click the Run query above the code editor.
The code editor has a built in autocomplete feature that gives suggestions for keywords, aggregations, namespaces, metrics, labels and label values. The suggestions are shown when hitting space, comma or dollar character. You can also use the keyboard combination CTRL+Space.

Note: Usage of template variables in the code editor might interfere the autocompletion.
Common metric query editor fields
At the bottom of the metric query editor, you’ll find three fields that are common to both Metric Search and Metric Query.
Id
The GetMetricData API requires that all queries have a unique ID. Use this field to specify an ID of choice. The ID can include numbers, letters, and underscore, and must start with a lowercase letter. If no ID is specified, grafana will generate an ID using the following pattern query[refId of the current query row], e.g queryA for the first query row in the panel editor.
The ID can be used to reference queries in Metric Math expressions.
Period
A period is the length of time associated with a specific Amazon CloudWatch statistic. Periods are defined in numbers of seconds, and valid values for period are 1, 5, 10, 30, or any multiple of 60.
If the period field is left blank or set to auto, then it calculates automatically based on the time range and cloudwatch’s retention policy. The formula used is time range in seconds / 2000, and then it snaps to the next higher value in an array of predefined periods [60, 300, 900, 3600, 21600, 86400] after removing periods based on retention. By clicking Show Query Preview in the query editor, you can see what period Grafana used.
Alias
The alias field allows you to override the default name of the metric legend.
Alias patterns
| Alias Pattern | Description | Example Result |
|---|---|---|
{{region}} | returns the region | us-east-1 |
{{period}} | returns the period | 3000 |
{{metric}} | returns the metric | CPUUtilization |
{{label}} | returns the label returned by the API (only in Metric Search) | i-01343 |
{{namespace}} | returns the namespace (only in Metric Search) | AWS/EC2 |
{{stat}} | returns the statistic (only in Metric Search) | Average |
{{[dimension name]}} | returns the dimension name (only in Metric Search) | i-01343 |
Using the Logs query editor
To query CloudWatch Logs:
- Select the region and up to 20 log groups which you want to query.
- Use the main input area to write your query in CloudWatch Logs Query Language.
You can also write queries returning time series data by using the stats command. When making stats queries in Explore, you have to make sure you are in Metrics Explore mode.

Deep linking from Grafana panels to the CloudWatch console

CloudWatch Logs Insights button next to the query editor.
If you’re not currently logged in to the CloudWatch console, the link will forward you to the login page. The provided link is valid for any account but will only display the right metrics if you’re logged in to the account that corresponds to the selected data source in Grafana.
Alerting
Alerting require queries that return numeric data, which CloudWatch Logs support. For example through the use of the stats command, alerts are supported. For example, this is a valid query for alerting on messages that include the text “Exception”:
filter @message like /Exception/
    | stats count(*) as exceptionCount by bin(1h)
| sort exceptionCount descNOTE: When trying to alert on a query, if an error like input data must be a wide series but got ... is received, make sure that your query returns valid numeric data that can be printed in a Time series panel.
For more information on Grafana alerts, refer to Alerting documentation.
Configure CloudWatch with grafana.ini
The Grafana configuration file includes an AWS section where you can customize the data source.
| Configuration option | Description |
|---|---|
allowed_auth_providers | Specifies which authentication providers are allowed for the CloudWatch data source. The following providers are enabled by default in OSS Grafana: default (AWS SDK default), keys (Access and secret key), credentials (Credentials file), ec2_IAM_role (EC2 IAM role). |
assume_role_enabled | Allows you to disable assume role (ARN) in the CloudWatch data source. By default, assume role (ARN) is enabled for OSS Grafana. |
list_metrics_page_limit | When a custom namespace is specified in the query editor, the List Metrics API is used to populate the Metrics field and the Dimension fields. The API is paginated and returns up to 500 results per page. The CloudWatch data source also limits the number of pages to 500. However, you can change this limit using the list_metrics_page_limit variable in the grafana configuration file. |
Pricing
The Amazon CloudWatch data source for Grafana uses the ListMetrics and GetMetricData CloudWatch API calls to list and retrieve metrics.
Pricing for CloudWatch Logs is based on the amount of data ingested, archived, and analyzed via CloudWatch Logs Insights queries.
Every time you pick a dimension in the query editor Grafana will issue a ListMetrics request. Whenever you make a change to the queries in the query editor, one new request to GetMetricData will be issued.
In Grafana version 6.5 or higher, all API requests to GetMetricStatistics have been replaced with calls to GetMetricData to provide better support for CloudWatch metric math and enables the automatic generation of search expressions when using wildcards or disabling the Match Exact option. While GetMetricStatistics qualified for the CloudWatch API free tier, this is not the case for GetMetricData calls.
For more information, please refer to the CloudWatch pricing page.
Service quotas
AWS defines quotas, or limits, for resources, actions, and items in your AWS account. Depending on the number of queries in your dashboard and the number of users accessing the dashboard, you may reach the usage limits for various CloudWatch and CloudWatch Logs resources. Note that quotas are defined per account and per region. If you’re using multiple regions or have set up more than one CloudWatch data source to query against multiple accounts, you need to request a quota increase for each account and each region in which you hit the limit.
To request a quota increase, visit the AWS Service Quotas console. For more information, refer to the AWS documentation for Service Quotas and CloudWatch limits.


