Important: This documentation is about an older version. It's relevant only to the release noted, many of the features and functions have been updated or replaced. Please view the current version.
Alertmanager
The Alertmanager helps both group and manage alert rules, adding a layer of orchestration on top of the alerting engines. To learn more, see Prometheus Alertmanager documentation.
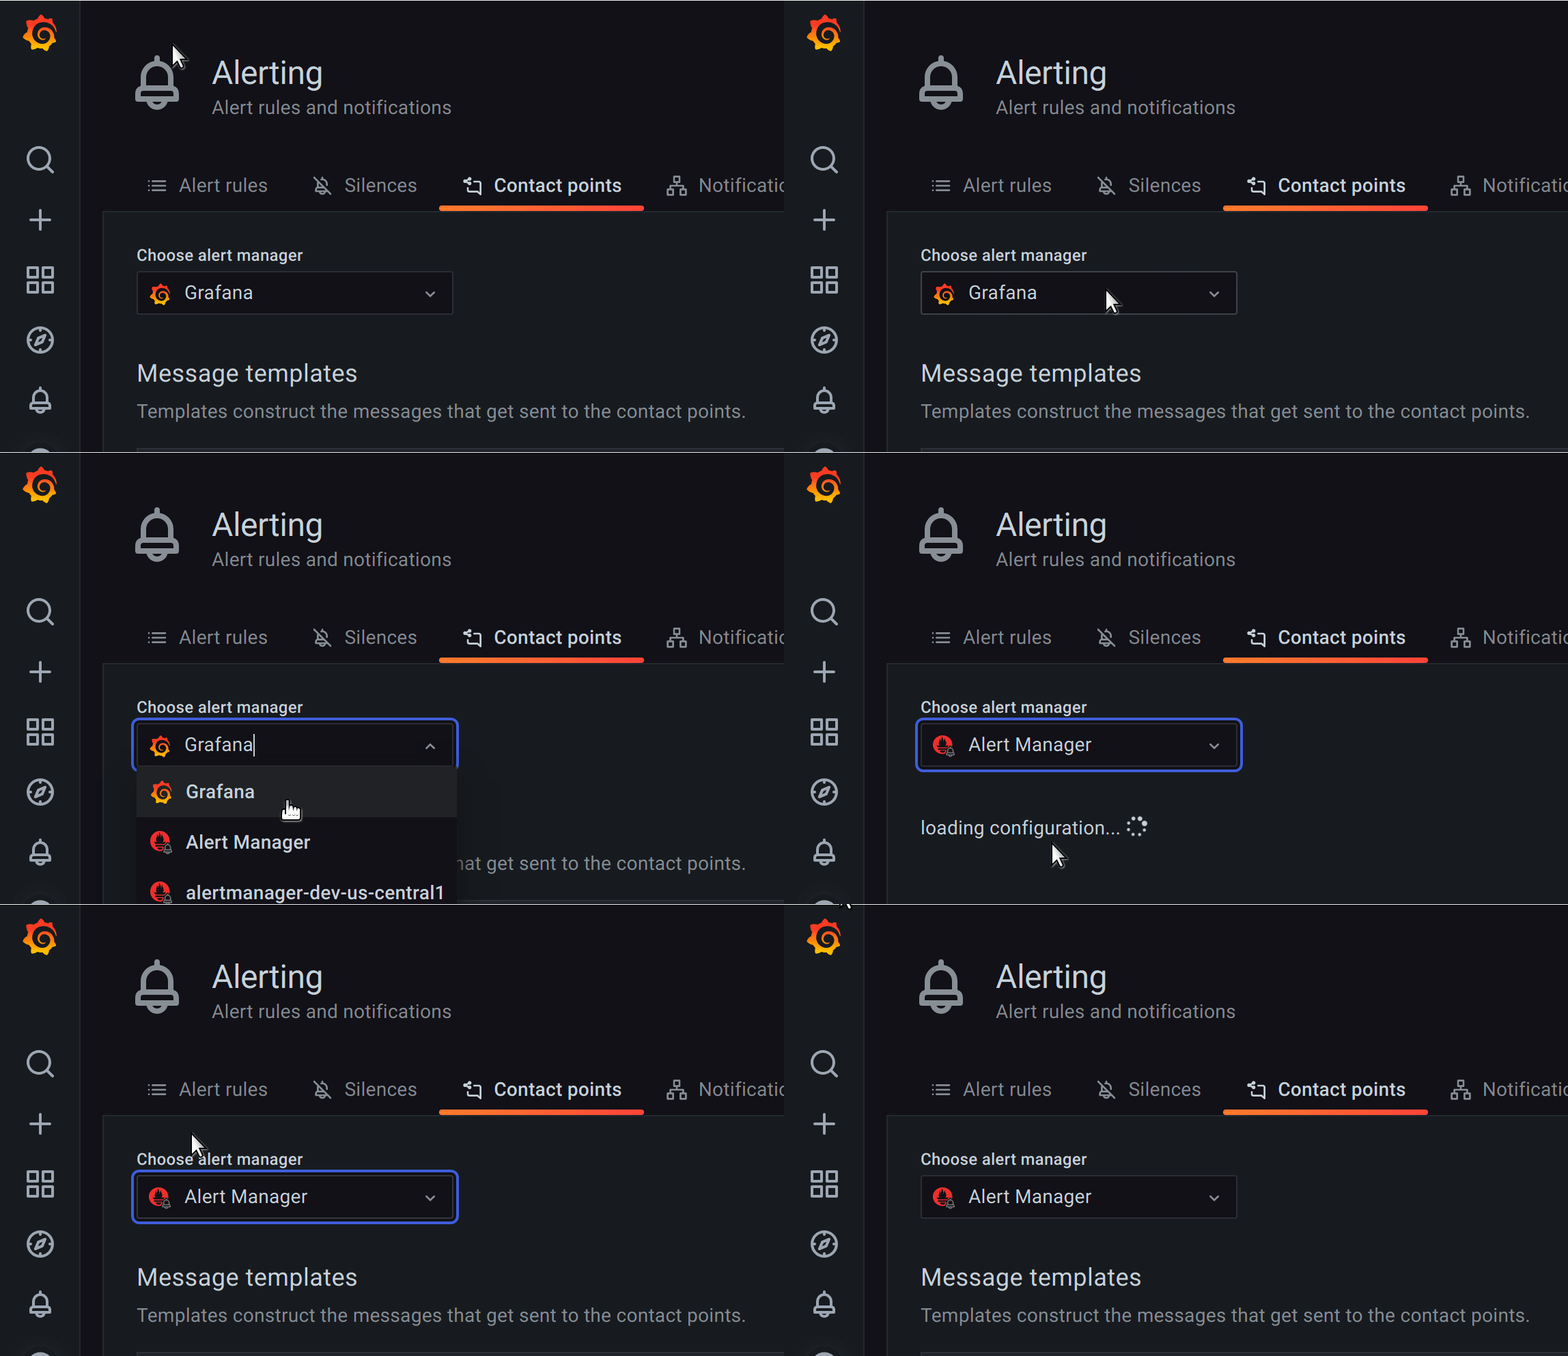
Grafana includes built-in support for Prometheus Alertmanager. By default, notifications for Grafana managed alerts are handled by the embedded Alertmanager that is part of core Grafana. You can configure the Alertmanager’s contact points, notification policies, silences, and templates from the alerting UI by selecting the Grafana option from the Alertmanager drop-down.
Note: Before v8.2, the configuration of the embedded Alertmanager was shared across organizations. If you are on an older Grafana version, we recommend that you use Grafana alerts only if you have one organization. Otherwise, your contact points are visible to all organizations.
Grafana alerting added support for external Alertmanager configuration. When you add an Alertmanager data source, the Alertmanager drop-down shows a list of available external Alertmanager data sources. Select a data source to create and manage alerting for standalone Grafana Mimir or Loki data sources.

You can configure one or several external Alertmanagers to receive alerts from Grafana. Once configured, both the embedded Alertmanager and any configured external Alertmanagers will receive all alerts.
You can do the setup in the “Admin” tab within the Grafana v8 Alerts UI.
Add a new external Alertmanager
- In the Grafana menu, click the Alerting (bell) icon to open the Alerting page listing existing alerts.
- Click Admin and then scroll down to the External Alertmanager section.
- Click Add Alertmanager and a modal opens.
- Add the URL and the port for the external Alertmanager. You do not need to specify the path suffix, for example,
/api/v(1|2)/alerts. Grafana automatically adds this.
The external URL is listed in the table with a pending status. Once Grafana verifies that the Alertmanager is discovered, the status changes to active. No requests are made to the external Alertmanager at this point; the verification signals that alerts are ready to be sent.
Edit an external Alertmanager
- Click the pen symbol to the right of the Alertmanager row in the table.
- When the edit modal opens, you can view all the URLs that were added.
The edited URL will be pending until Grafana verifies it again.


