Important: This documentation is about an older version. It's relevant only to the release noted, many of the features and functions have been updated or replaced. Please view the current version.
Table
The table panel visualization is very flexible, supporting multiple modes for time series and for tables, annotation, and raw JSON data. This panel also provides date formatting, value formatting, and coloring options.

Annotation support
Annotations are not currently supported in the new table panel. This might be added back in a future release.
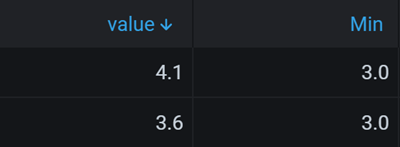
Sort column
Click a column title to change the sort order from default to descending to ascending. Each time you click, the sort order changes to the next option in the cycle. You can only sort by one column at a time.

Table options
Note: If you are using a table visualization created before Grafana 7.0, then you need to migrate to the new table version in order to see these options. To migrate, on the Panel tab, click Table visualization. Grafana updates the table version and you can then access all table options.
Show header
Show or hide column names imported from your data source.
Column width
By default, Grafana automatically calculates the column width based on the table size and the minimum column width. This field option can override the setting and define the width for all columns in pixels.
For example, if you enter 100 in the field, then when you click outside the field, all the columns will be set to 100 pixels wide.
Minimum column width
By default, the minimum width of the table column is 150 pixels. This field option can override that default and will define the new minimum column width for the table panel in pixels.
For example, if you enter 75 in the field, then when you click outside the field, all the columns will scale to no smaller than 75 pixels wide.
For small-screen devices, such as smartphones or tablets, reduce the default 150 pixel value to50 to allow table based panels to render correctly in dashboards.
Column alignment
Choose how Grafana should align cell contents:
- Auto (default)
- Left
- Center
- Right
Cell display mode
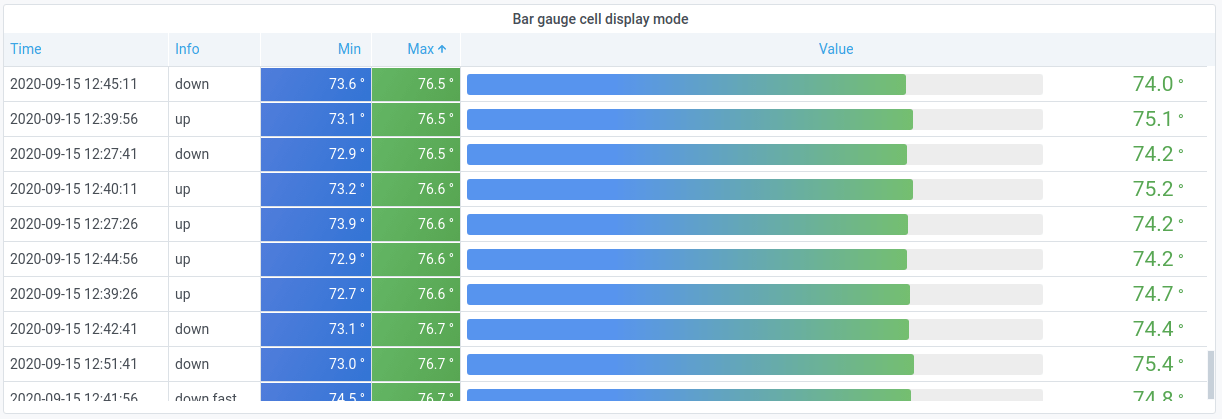
By default, Grafana automatically chooses display settings. You can override the settings by choosing one of the following options to change all fields.
Note: If you set these in the Field tab, then the display modes will apply to all fields, including the time field. Many options will work best if you set them in the Override tab.
Color text
If thresholds are set, then the field text is displayed in the appropriate threshold color.

Color background (gradient or solid)
If thresholds are set, then the field background is displayed in the appropriate threshold color.

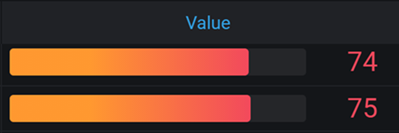
Gradient gauge
The threshold levels define a gradient.

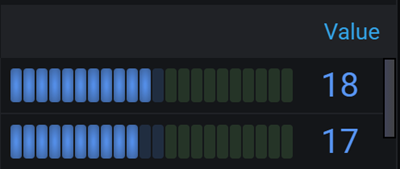
LCD gauge
The gauge is split up in small cells that are lit or unlit.

JSON view
Shows value formatted as code. If a value is an object the JSON view allowing browsing the JSON object will appear on hover.

Image
Only available in Grafana 7.3+
If you have a field value that is an image URL or a base64 encoded image you can configure the table to display it as an image.

Column filter
You can temporarily change how column data is displayed. For example, you can order values from highest to lowest or hide specific values. For more information, refer to Filter table columns.


