Important: This documentation is about an older version. It's relevant only to the release noted, many of the features and functions have been updated or replaced. Please view the current version.
Tempo data source
Grafana ships with built-in support for Tempo a high volume, minimal dependency trace storage, OSS tracing solution from Grafana Labs. Add it as a data source, and you are ready to query your traces in Explore.
Add data source
To access Tempo settings, click the Configuration (gear) icon, then click Data Sources > Tempo.
| Name | Description |
|---|---|
Name | The name using which you will refer to the data source in panels, queries, and Explore. |
Default | The default data source will be pre-selected for new panels. |
URL | The URL of the Tempo instance, e.g., http://tempo |
Basic Auth | Enable basic authentication to the Tempo data source. |
User | User name for basic authentication. |
Password | Password for basic authentication. |
Trace to logs
Note: This feature is available in Grafana 7.4+.
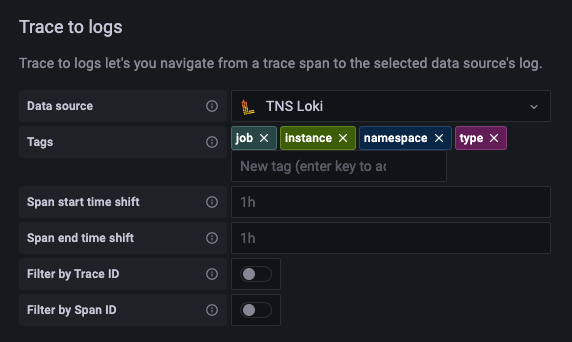
This is a configuration for the trace to logs feature. Select target data source (at this moment limited to Loki data sources) and select which tags will be used in the logs query.
- Data source - Target data source.
- Tags - The tags that will be used in the Loki query. Default is
'cluster', 'hostname', 'namespace', 'pod'. - Span start time shift - A shift in the start time for the Loki query based on the start time for the span. To extend the time to the past, use a negative value. You can use time units, for example, 5s, 1m, 3h. The default is 0.
- Span end time shift - Shift in the end time for the Loki query based on the span end time. Time units can be used here, for example, 5s, 1m, 3h. The default is 0.
- Filter by Trace ID - Toggle to append the trace ID to the Loki query.
- Filter by Span ID - Toggle to append the span ID to the Loki query.

Node Graph
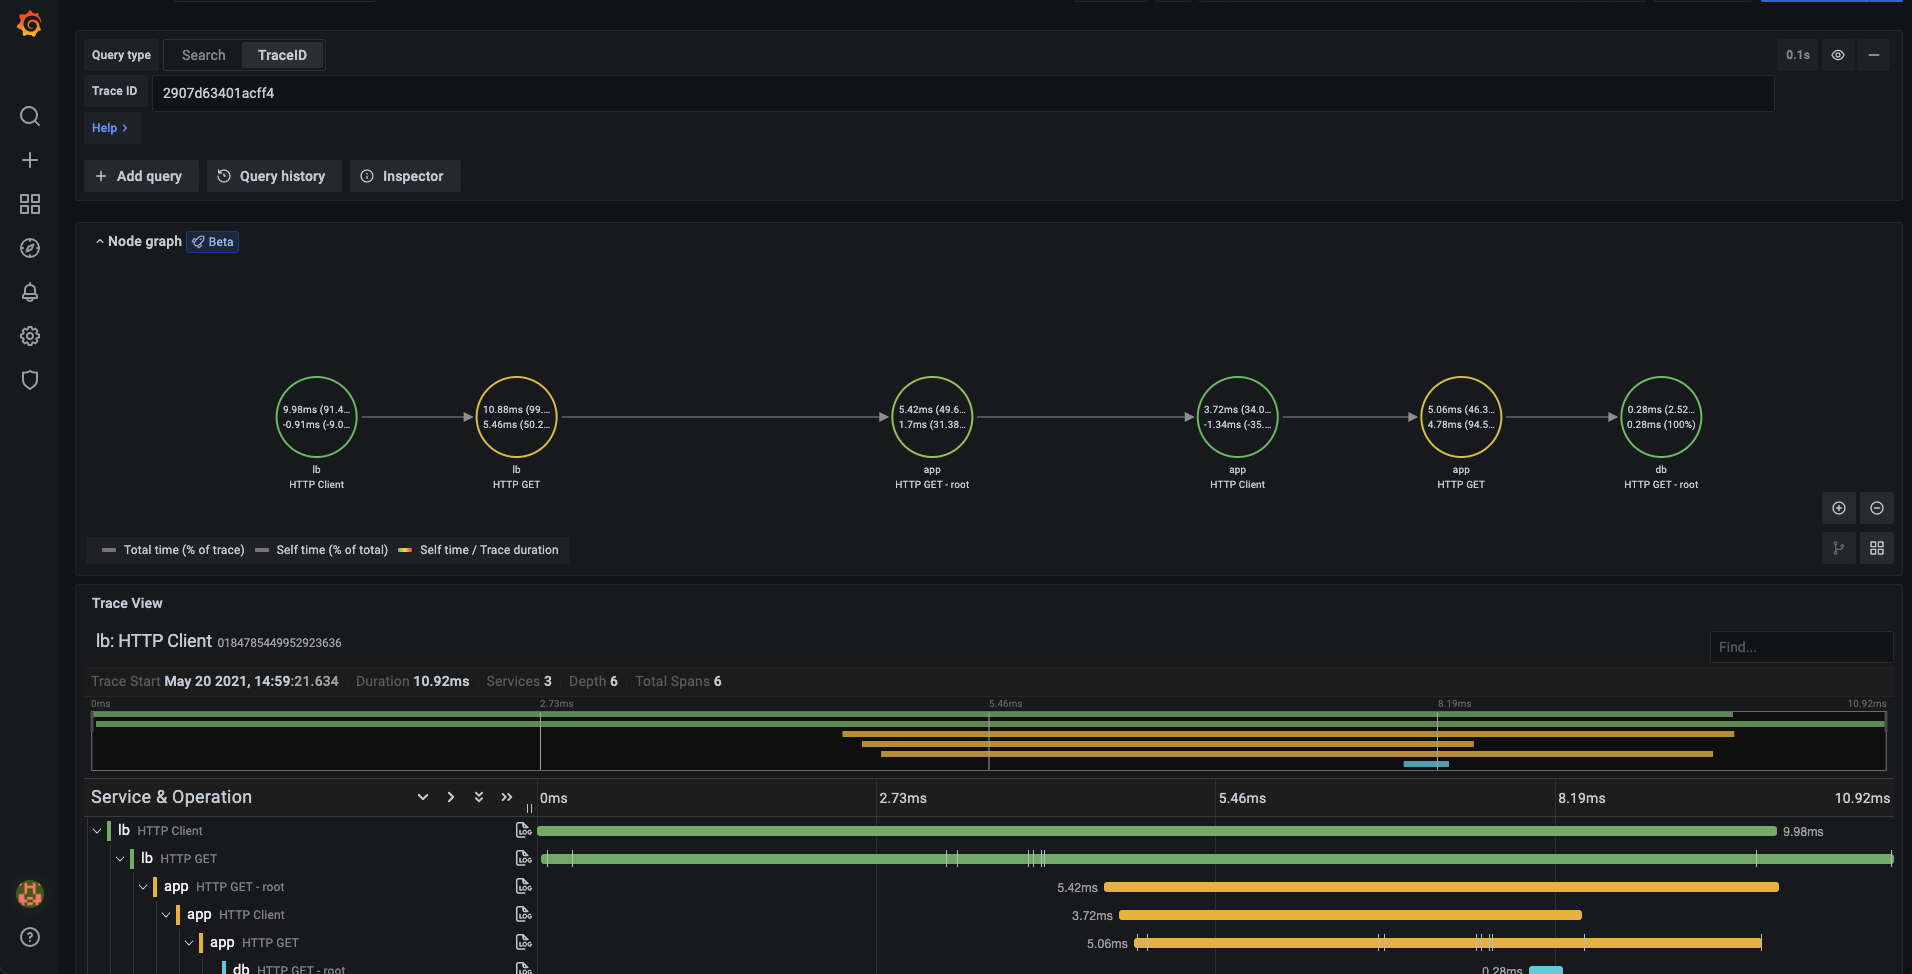
This is a configuration for the beta Node Graph visualization. The Node Graph is shown after the trace view is loaded and is disabled by default.
– Enable Node Graph - Enables the Node Graph visualization.
Query traces
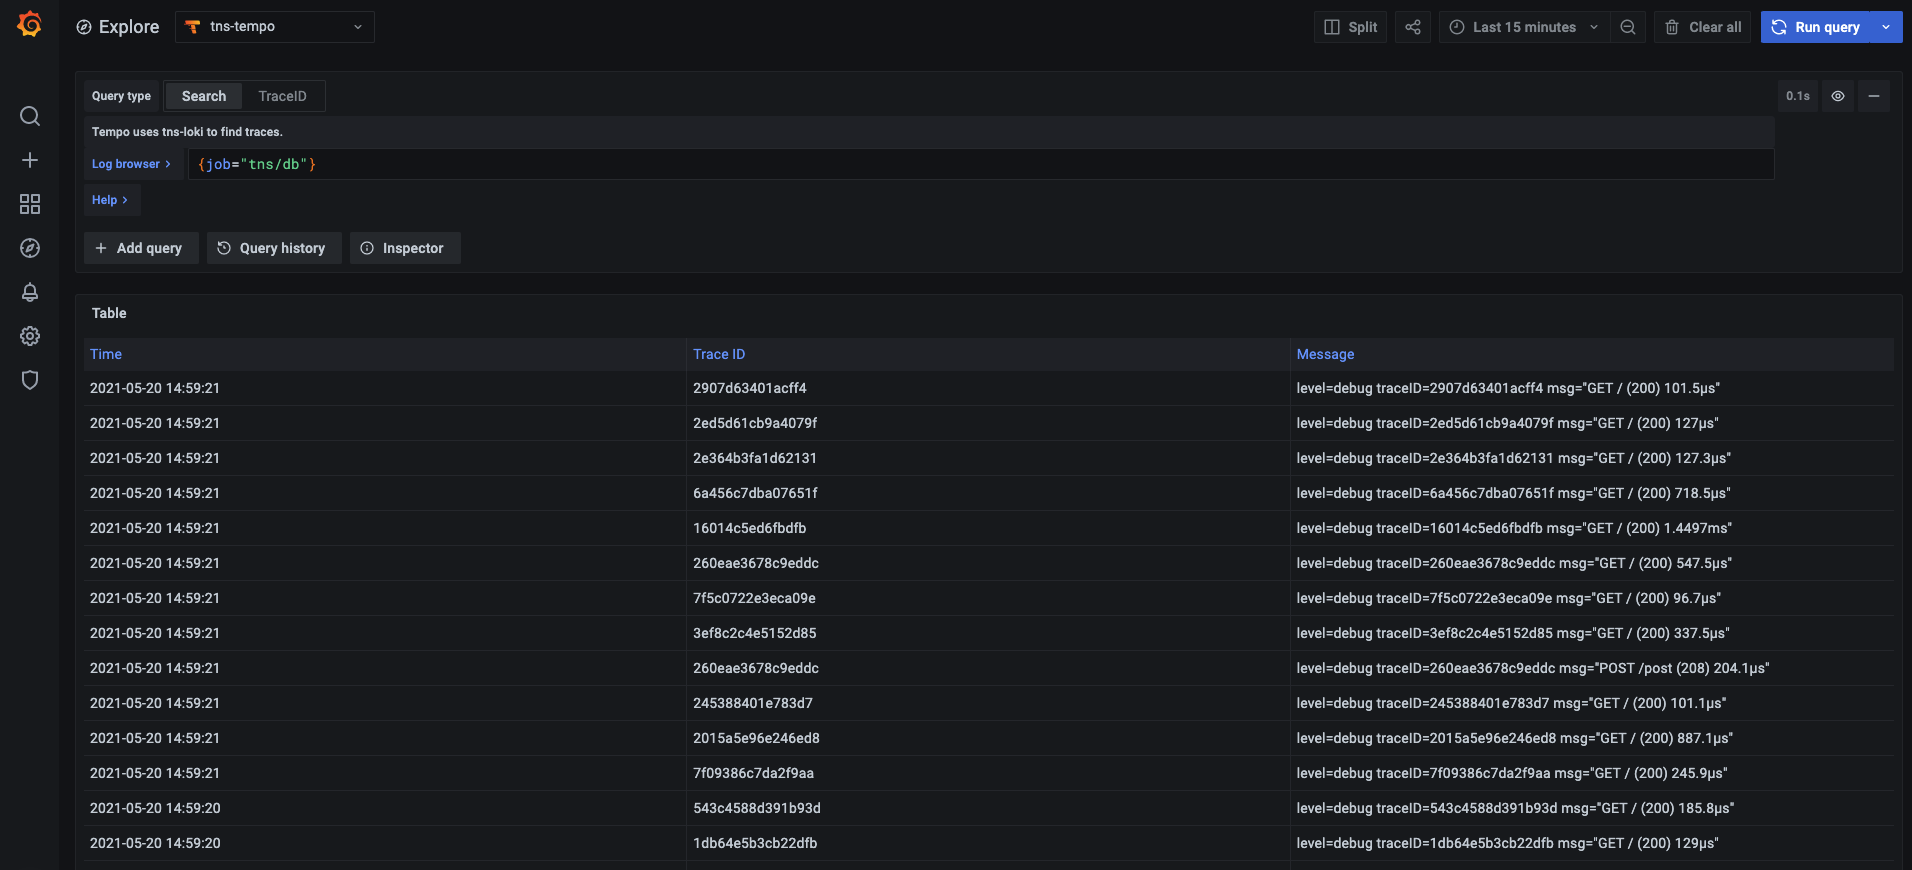
You can query and display traces from Tempo via Explore. You can search for traces if you set up the trace to logs setting in the data source configuration page. To find traces to visualize, use the Loki query editor. To get search results, you must have derived fields configured, which point to this data source.

To query a particular trace, select the TraceID query type, and then put the ID into the Trace ID field.

Upload JSON trace file
You can upload a JSON file that contains a single trace to visualize it. If the file has multiple traces then the first trace is used for visualization.
Here is an example JSON:
{
  "batches": [
    {
      "resource": {
        "attributes": [
          { "key": "service.name", "value": { "stringValue": "db" } },
          { "key": "job", "value": { "stringValue": "tns/db" } },
          { "key": "opencensus.exporterversion", "value": { "stringValue": "Jaeger-Go-2.22.1" } },
          { "key": "host.name", "value": { "stringValue": "63d16772b4a2" } },
          { "key": "ip", "value": { "stringValue": "0.0.0.0" } },
          { "key": "client-uuid", "value": { "stringValue": "39fb01637a579639" } }
        ]
      },
      "instrumentationLibrarySpans": [
        {
          "instrumentationLibrary": {},
          "spans": [
            {
              "traceId": "AAAAAAAAAABguiq7RPE+rg==",
              "spanId": "cmteMBAvwNA=",
              "parentSpanId": "OY8PIaPbma4=",
              "name": "HTTP GET - root",
              "kind": "SPAN_KIND_SERVER",
              "startTimeUnixNano": "1627471657255809000",
              "endTimeUnixNano": "1627471657256268000",
              "attributes": [
                { "key": "http.status_code", "value": { "intValue": "200" } },
                { "key": "http.method", "value": { "stringValue": "GET" } },
                { "key": "http.url", "value": { "stringValue": "/" } },
                { "key": "component", "value": { "stringValue": "net/http" } }
              ],
              "status": {}
            }
          ]
        }
      ]
    }
  ]
}
Linking Trace ID from logs
You can link to Tempo trace from logs in Loki or Elastic by configuring an internal link. See the Derived fields section in the Loki data source or Data links section in the Elastic data source for configuration instructions.


