Important: This documentation is about an older version. It's relevant only to the release noted, many of the features and functions have been updated or replaced. Please view the current version.
What’s new in Grafana v7.0
This topic includes the release notes for Grafana v7.0. For all details, read the full CHANGELOG.md.
This major release of Grafana is the next step in our Observability story. It includes powerful new features for manipulating, transforming, and doing math on data. Grafana Enterprise has the first version of Usage analytics, which will help Grafana Admins better manage large, corporate Grafana ecosystems.
The Grafana 7.0 stable release is scheduled for the 18th of May. In the meantime, if you want to know more about what we’ve been up to and what is coming, sign up for our online GrafanaCon conference.
The main highlights are:
- New Panel Editor Redesign based on community feedback.
- Explore New tracing UI and support for visualizing Jaeger and Zipkin traces.
- Enterprise Usage insights, Presence indicator, and Auth improvements.
- Transformations Transformations and simple Math operations for all data sources.
- Field overrides Automatically configure panels with data from queries.
- Table New Table panel.
- Plugins New plugins platform.
- Tutorials New tutorials section.
- Cloudwatch Support for Cloudwatch Logs in Explore and the Logs panel.
- Breaking change PhantomJS removed.
- Time zones Time zone support
New panel editor and unified data model
We have redesigned the UI for editing panels. The first visible change is that we have separated panel display settings to a right-hand side pane that you can collapse or expand depending on what your focus is on. With this change we are also introducing our new unified option model and UI for defining data configuration and display options. This unified data configuration system powers a consistent UI for setting data options across visualizations, as well as making all data display settings data driven and overridable.
This new option architecture and UI will make all panels have a consistent set of options and behaviors for attributes like unit, min, max, thresholds, links, decimals. Not only that but all these options will share a consistent UI for specifying override rules and is extensible for custom panel specific options.
In previous versions of Grafana, each visualization had slightly different ways to define their options. One immediate benefit is after setting options like units or thresholds in a panel, you can seamlessly switch between visualization types and keep those options. This will bring increased ease of use and more consistency for users and plugin developers.
We have yet to migrate all core panels to this new architecture so in 7.0 there will be some inconsistencies in the UI between panels. This will be fixed soon in future releases as we update all the core panels and help the community update the community panel plugins.
Learn more about this feature in Panel editor.
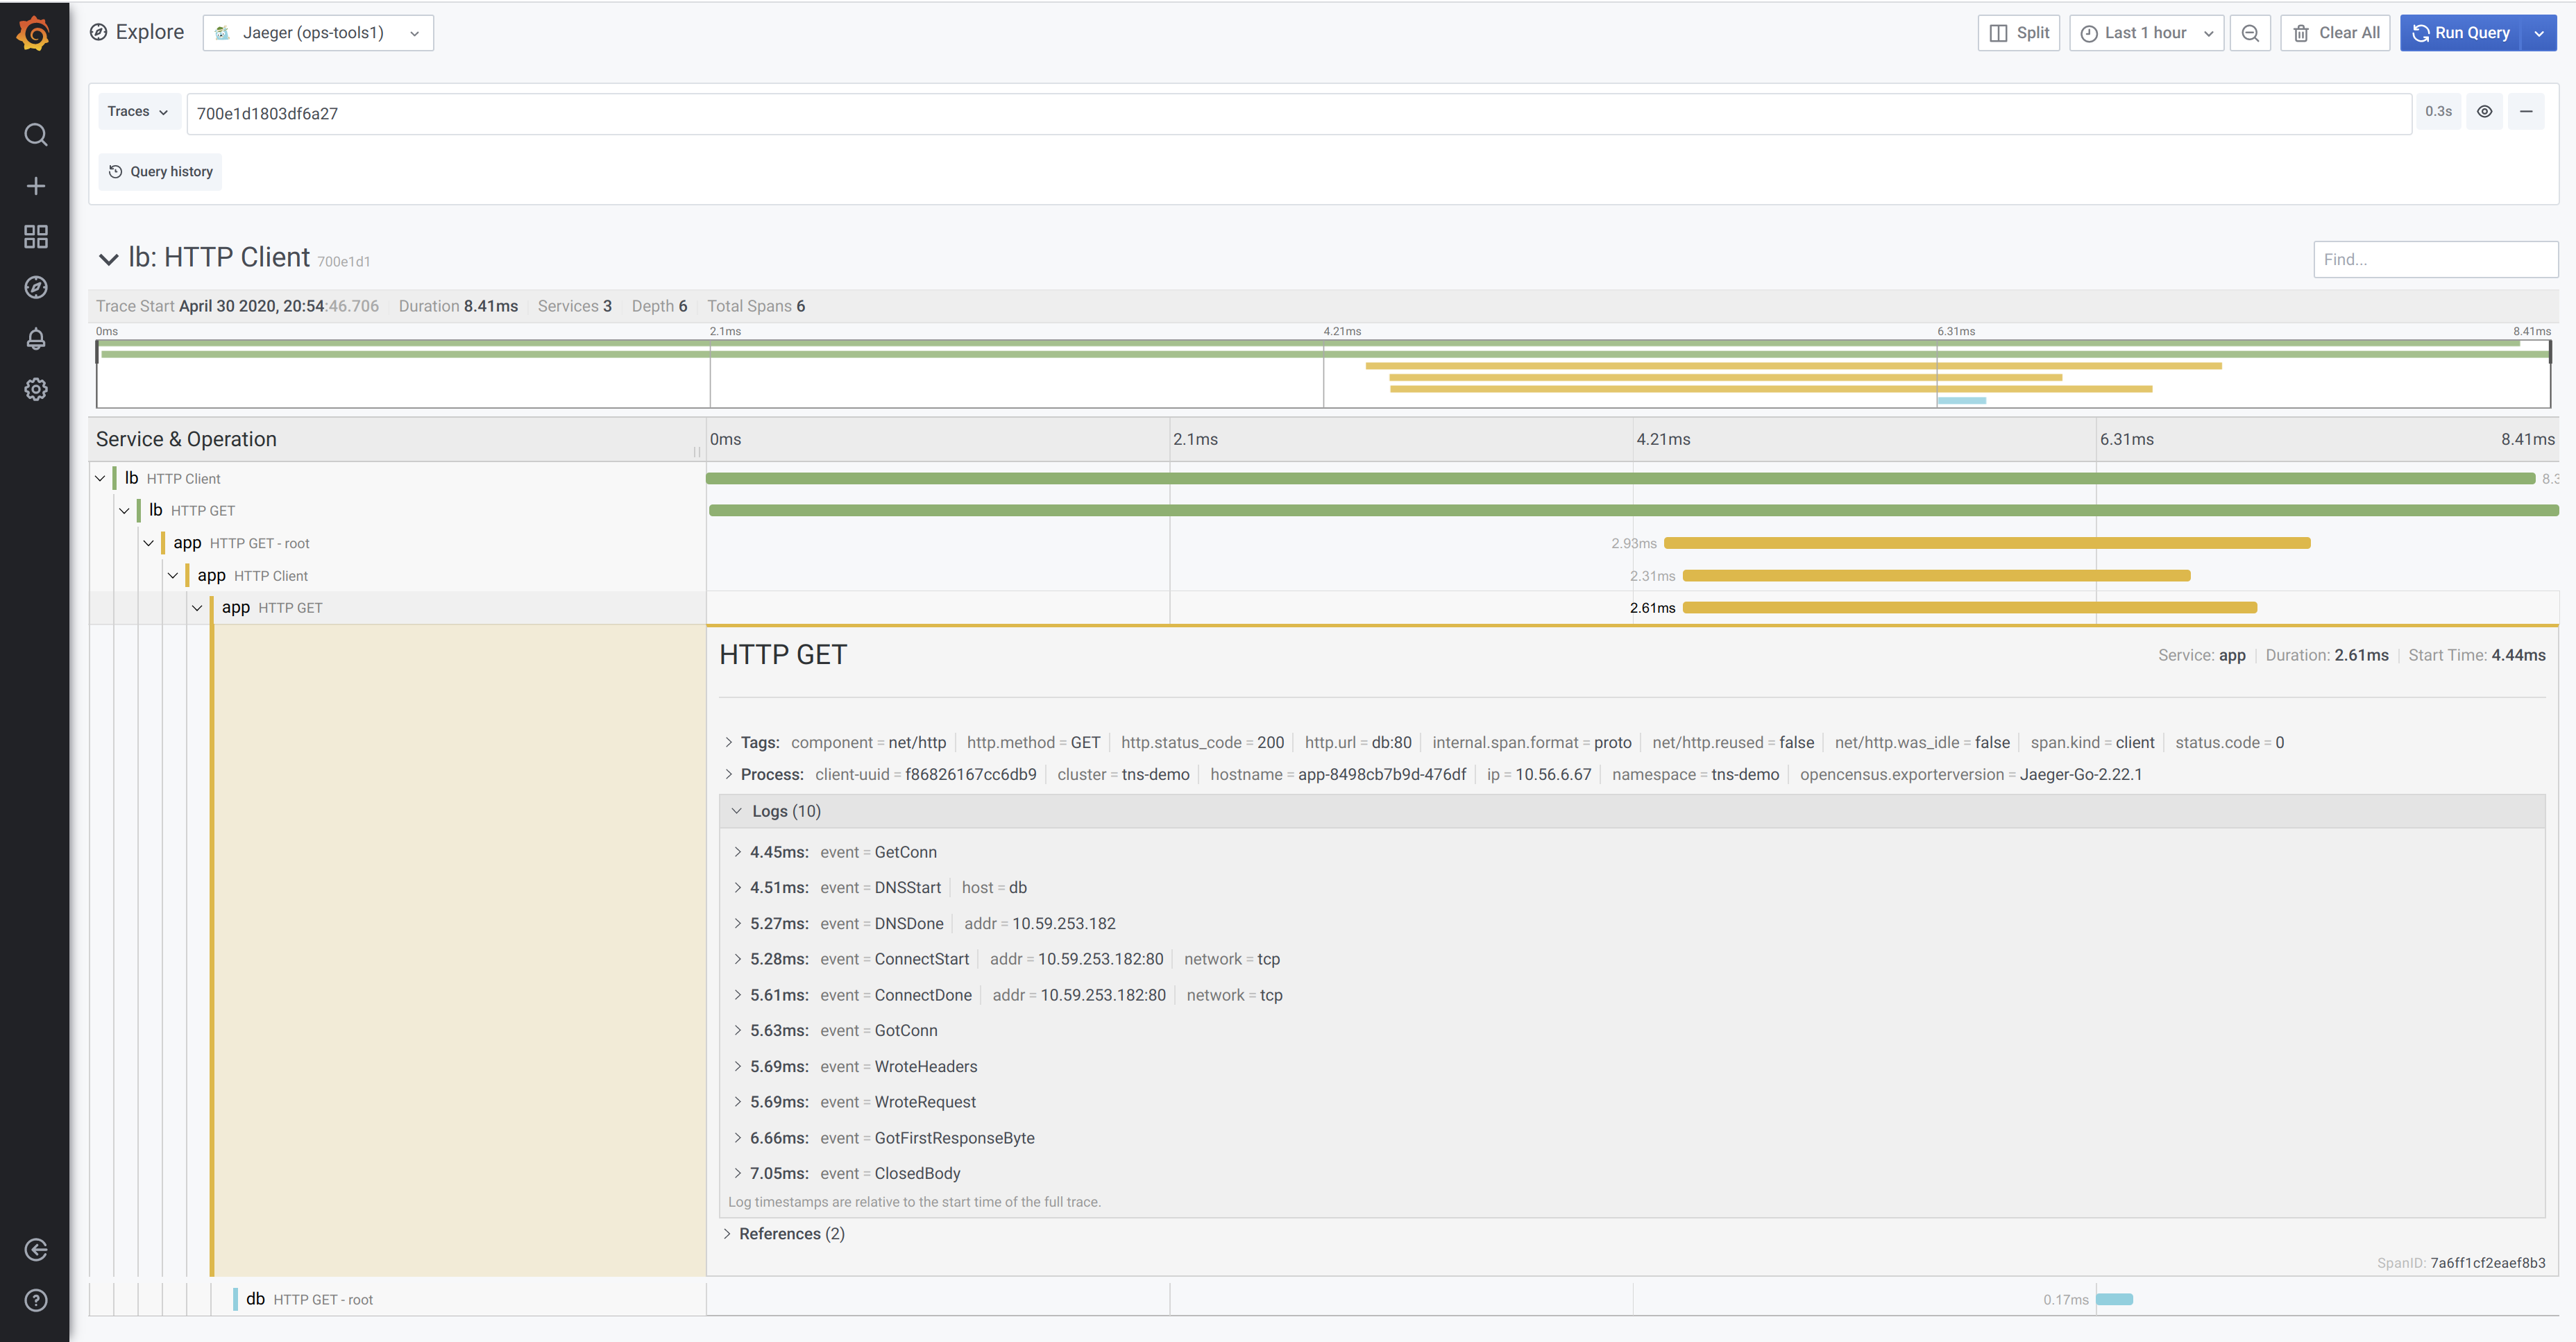
New tracing UI
This release adds major support for distributed tracing, including a telemetry mode to complement the existing support for metrics and logs. Traces allow you to follow how single requests travel through a distributed system. We are starting with an integrated trace viewer and two new built-in data sources: Jaeger and Zipkin.
You can use the new trace view in Explore either directly to search for a particular trace or you can configure Loki to detect trace IDs in the log lines and link directly to a trace timeline pulled from Jaeger or Zipkin data source.
In the future we will add more workflows and integrations so that correlating between metrics, logs and traces is even easier.
Transformations
The data you want to visualize can come from many different places and it is usually not in exactly the right form. Users can now transform non-time series data into tables (e.g., JSON files or even simple lookup tables) in seconds without any customization or additional overhead. They can then combine non-time series data with any other data in Grafana; data from an external database or a panel that already exists in one of their current dashboards.
By chaining a simple set of point and click transformations, users will be able join, pivot, filter, re-name and do calculations to get the results they need. Perfect for operations across queries or data sources missing essential data transformations.
Transformations also adds the ability to do maths across queries. Lots of data sources do not support this natively, so being able to do it in Grafana is a powerful feature.
For users with large dashboards or with heavy queries, being able to reuse the query result from one panel in another panel can be a huge performance gain for slow queries (e.g log or sql queries). From the data source menu in the query editor, you can choose the --dashboard-- option and then choose the query result from another panel on the same dashboard.
The Google Sheets data source that was published a few weeks ago works really well together with the transformations feature.
We are also introducing a new shared data model for both time series and table data that we call DataFrame. A DataFrame is like a table with columns but we refer to columns as fields. A time series is a DataFrame with two fields (time & value).
Transformations shipping in 7.0
- Reduce: Reduce all rows or data points to a single value using a function like max, min, mean or last.
- Filter by name: Removes part of the query results using a regex pattern. The pattern can be inclusive or exclusive.
- Filter data by query Filter data by query. This is useful if you are sharing the results from a different panel that has many queries and you want to only visualize a subset of that in this panel.
- Organize fields: Allows the user to re-order, hide, or rename fields / columns. Useful when data source doesn’t allow overrides for visualizing data.
- Labels to fields: Groups series by time and returns labels or tags as fields. Useful for showing time series with labels in a table where each label key becomes a separate column.
- Outer join: Joins many time series/tables by a field. This can be used to outer join multiple time series on the time field to show many time series in one table.
- Add field from calculation: This is a powerful transformation that allows you perform many different types of math operations and add the result as a new field. Can be used to calculate the difference between two series or fields and add the result to a new field. Or multiply one field with another and add the result to a new field.
Learn more about this feature in Transformations.
Field options and overrides
With Grafana 7.0 we are introducing a new, unified data configuration system that powers a consistent UI for setting data options across visualizations as well as making all data display settings data driven and overridable. This new option architecture and UI will make all panels have a consistent set of options and behaviors for attributes like unit, min, max, thresholds, links, decimals or value mappings. Not only that but all these options will share a consistent UI for specifying override rules and is extensible for custom panel specific options.
Up until now the overrides were available only for Graph and Table panel(via Column Styles), but with 7.0 they work consistently across all visualization types and plugins.
This feature enables even more powerful visualizations and fine grained control over how the data is displayed.
Learn more about this feature in Field options.
Inspect panels and export data to CSV
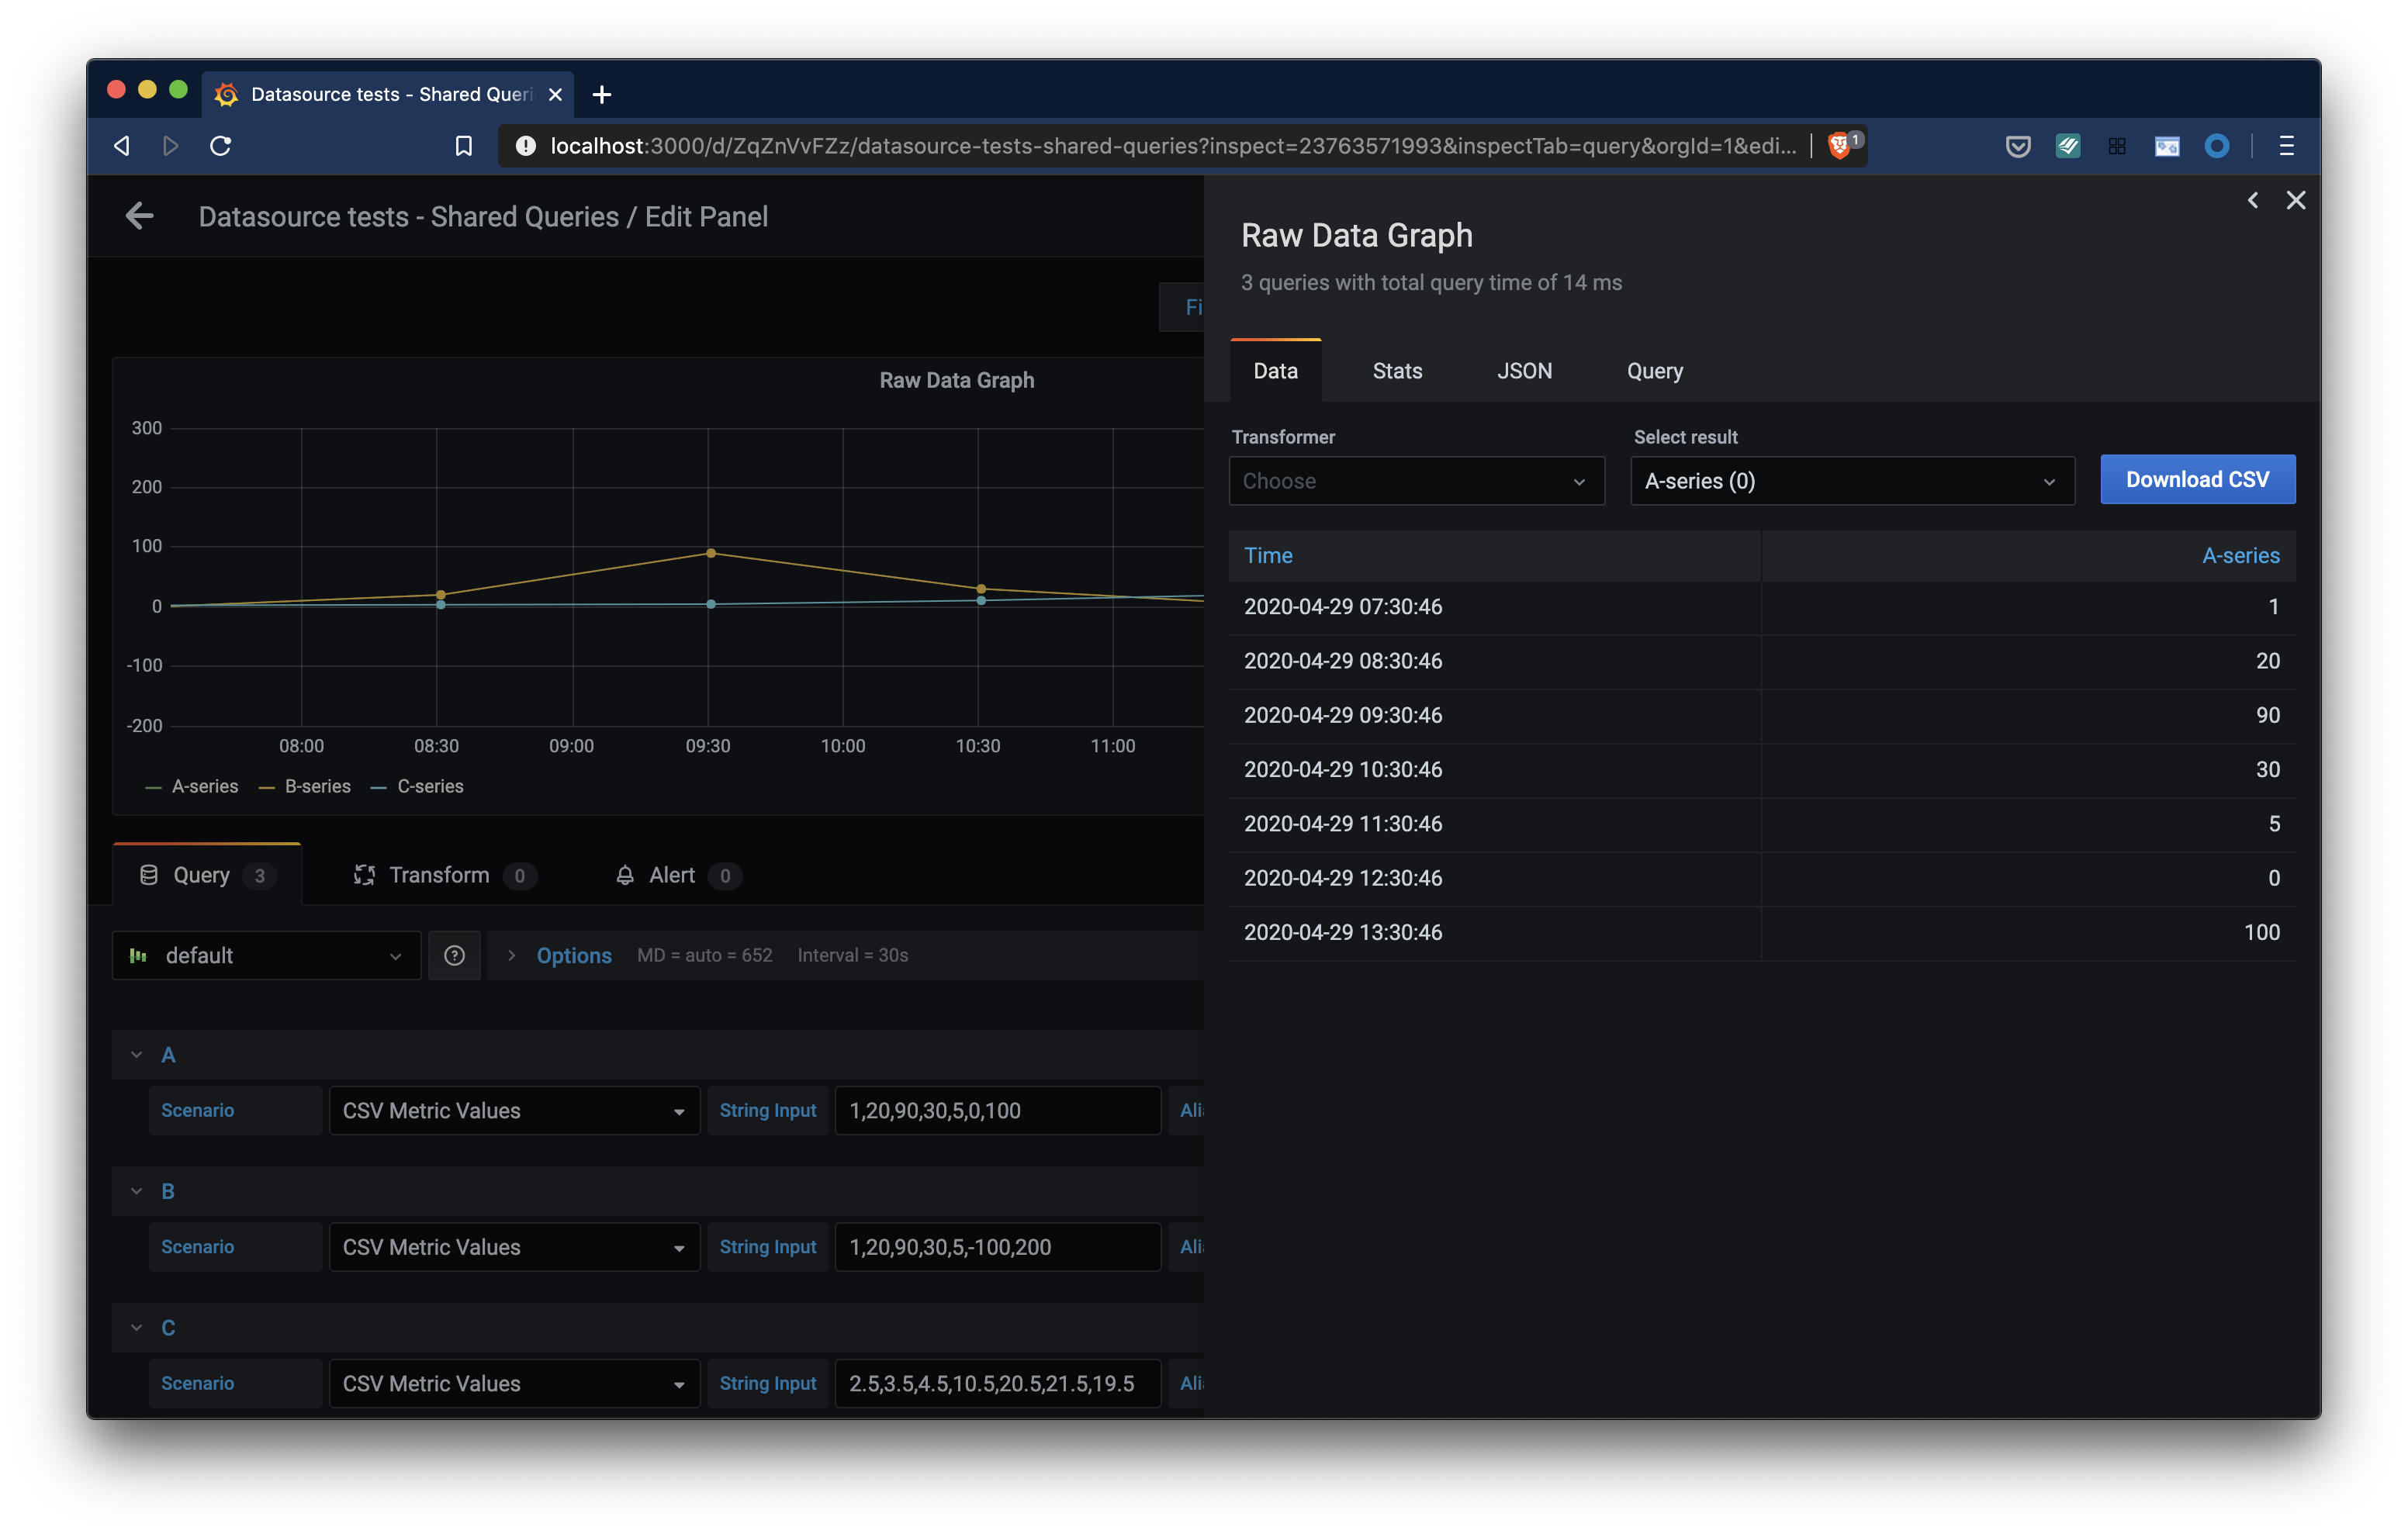
Another new feature of Grafana 7.0 is the panel inspector. Inspect allows you to view the raw data for any Grafana panel as well as export that data to a CSV file. With Panel inspect you will also be able to perform simple raw data transformations like join, view query stats or detailed execution data.
Learn more about this feature in Inspect a panel.
Table panel
Grafana 7.0 comes with a new table panel (and deprecates the old one). This new table panel supports horizontal scrolling and column resize. Paired with the new Organize fields transformation detailed above you can reorder, hide & rename columns. This new panel also supports new cell display modes, like showing a bar gauge inside a cell.
Auto grid mode for Stat panel and Gauge
This new 7.0 feature is for the gauge and stat panels. Before, stat and gauge only supported horizontal or vertical stacking: The auto layout mode just selected vertical or horizontal stacking based on the panel dimensions (whatever was highest). But in 7.0 the auto layout for these two panels will allow dynamic grid layouts where Grafana will try to optimize the usage of space and lay out each sub-visualization in a grid.
Cloudwatch Logs
Grafana 7.0 adds logging support to one of our most popular cloud provider data sources. Autocomplete support for Cloudwatch Logs queries is included for improved productivity. There is support for deep linking to the CloudWatch Logs Insights console for log queries, similar to the deep linking feature for Cloudwatch metrics. Since CloudWatch Logs queries can return time series data, for example through the use of the stats command, alerting is supported too.
Plugins platform
The platform for plugins has been completely re-imagined and provides ready-made components and tooling to help both inexperienced and experienced developers get up and running more quickly. The tooling, documentation, and new components will improve plugin quality and reduce long-term maintenance. We are already seeing that a high quality plugin with the Grafana look and feel can be written in much fewer lines of code than previously.
Learn more about developing plugins in the new framework in Build a plugin.
Front end plugins platform
In Grafana 7.0 we are maturing our panel and front-end datasource plugins platform.
Plugins can use the same React components that the Grafana team uses to build Grafana. Using these components means the Grafana team will support and improve them continually and make your plugin as polished as the rest of Grafana’s UI. The new @grafana/ui components library is documented with Storybook (visual documentation) and is available on NPM.
The @grafana/data, @grafana/runtime, @grafana/e2e packages (also available via NPM) aim to simplify the way plugins are developed. We want to deliver a set of reliable APIs for plugin developers.
With @grafana/toolkit we are delivering a simple CLI that helps plugin authors quickly scaffold, develop and test their plugins without worrying about configuration details. A plugin author no longer needs to be a grunt or webpack expert to build their plugin.
Support for backend plugins
Grafana now officially supports backend plugins and the first type of plugin to be introduced is a backend component for data source plugins. You can optionally add a backend component to your data source plugin and implement the query logic there to automatically enable alerting in Grafana for your plugin. In the 7.0 release, we introduce the Grafana Plugin SDK for Go that enables and simplifies building a backend plugin in Go.
Plugins can be monitored with the new metrics and health check capabilities. The new Resources capability means backend components can return non-time series data like JSON or static resources like images and opens up Grafana for new use cases.
With this release, we are deprecating the unofficial first version of backend plugins which will be removed in a future release.
To learn more, start with the overview. Next, in this tutorial you’ll learn how to build a backend for a data source plugin and enable it for use with Grafana Alerting. Make sure to keep an eye out for additional documentation and tutorials that will be published after the Grafana v7.0 release.
New tutorials
To help you get started with Grafana, we’ve launched a brand new tutorials platform. We’ll continue to expand the platform with more tutorials, but here are some of the ones you can try out now:
Rollup indicator for Metrictank queries
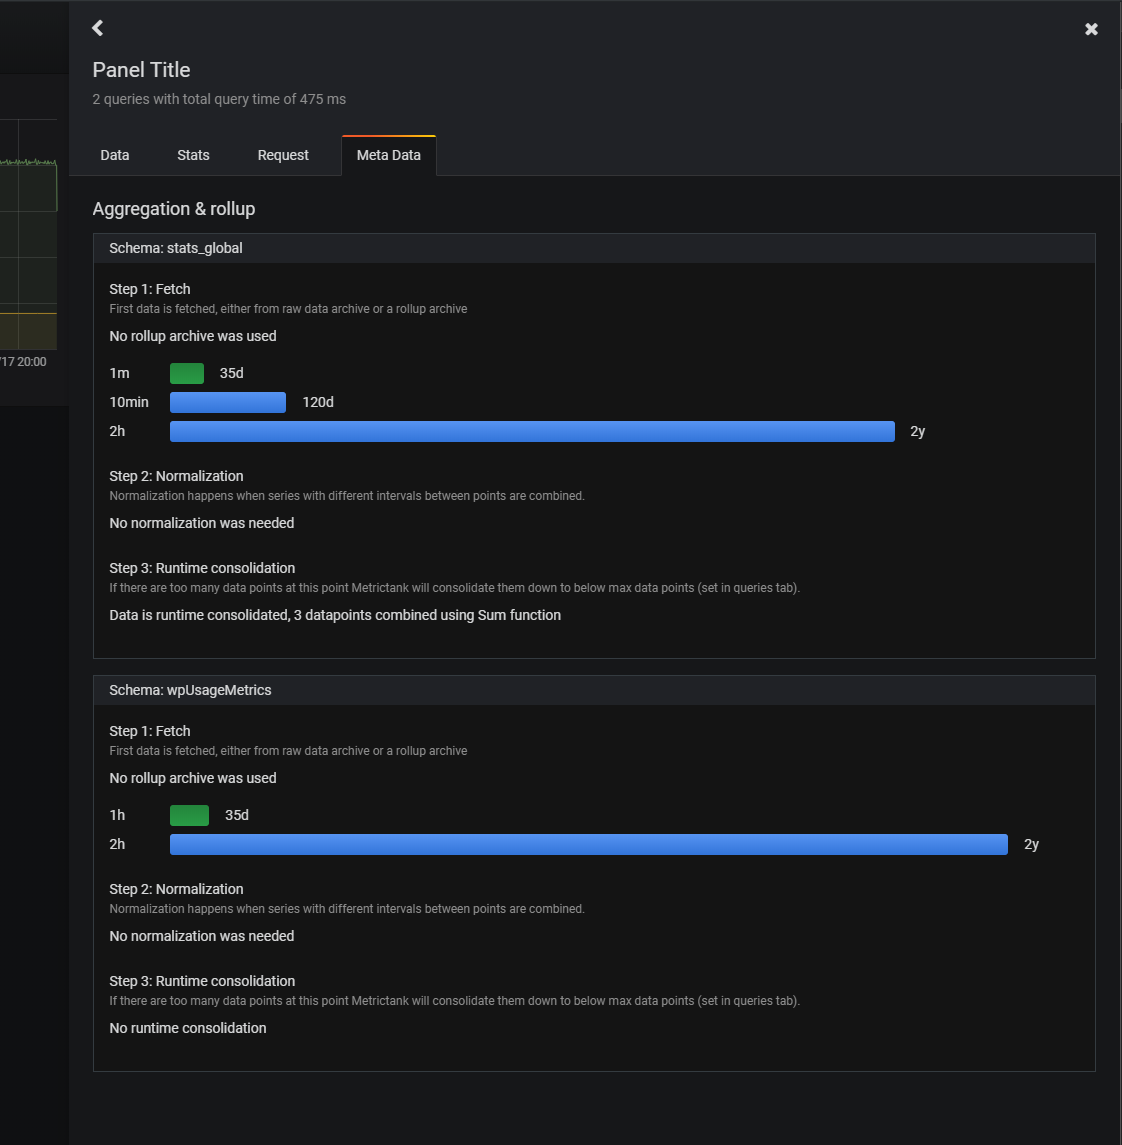
Depending on the cardinality of the data and the time range MetricTank may return rolled up (aggregated) data. This can be as subtle as potentially only 1 or 2 graphs out of nine being rolled up. The new rollup indicator is visible in the panel title and you can also inspect extensive metadata and stats about the Metrictank query result and its rollups.
Breaking change - PhantomJS removed
PhantomJS, have been used for rendering images of dashboards and panels and have been included with Grafana since Grafana v2.0. Since then we’ve had a lot of related bugs and security related issues, mainly due to the fact that PhantomJS have struggled with supporting modern web technologies. Throughout the years, maintaining PhantomJS support in Grafana has been a nightmare. Removing support for PhantomJS has been a high priority for the Grafana project and got stressed even more when the PhantomJS maintainer in March 2018 announced the end of the project.
Since then we have been working towards removing PhantomJS. In October 2019, when Grafana v6.4 was released, we announced the deprecation of PhantomJS. Grafana v7.0 removes all PhantomJS support which means that Grafana distribution no longer will include a built-in image renderer.
As a replacement for PhantomJS we’ve developed the Grafana Image Renderer plugin which is a plugin that runs on the backend and handles rendering panels and dashboards as PNG images using headless Chromium/Chrome. The Grafana Image Renderer plugin can either be installed as a Grafana plugin running in its own process side-by-side with Grafana. or runs as an external HTTP service, hosted using Docker or as a standalone application.
Read more about Image Rendering in the documentation for further instructions.
Query history in Explore out of beta
The Query history feature lets you view and interact with the queries that you have previously run in Explore. You can add queries to the Explore query editor, write comments, create and share URL links, star your favorite queries, and much more. Starred queries are displayed in the Starred tab, so it is easier to reuse queries that you run often without typing them from scratch.
It was released as a beta feature in Grafana 6.7. The feedback has been really positive and it is now out of beta for the 7.0 release. Learn more about query history in Explore.
Stackdriver data source supports Service Monitoring
Service monitoring in Google Cloud Platform (GCP) enables you to monitor based on Service Level Objectives (SLOs) for your GCP services. The new SLO query builder in the Stackdriver data source allows you to display SLO data in Grafana. Read more about it in the Stackdriver data source documentation.
Time zone support
You can now override the time zone used to display date and time values in a dashboard. One benefit of this is that you can specify the local time zone of the service or system that you are monitoring which can be helpful when monitoring a system or service that operates across several time zones.
Alerting and deep linking for Azure Log Analytics
The Azure Monitor data source supports multiple Azure services. Log Analytics queries in the data source now have alerting support too (Azure Monitor and Application Insights already had alerting support).
A new feature is deep linking from the graph panel to the Log Analytics query editor in the Azure Portal. Click on a time series in the panel to see a context menu with a link to View in Azure Portal. Clicking that link opens the Azure Log Analytics query editor in the Azure Portal and runs the query from the Grafana panel.
Grafana Enterprise
Grafana Enterprise focuses on solving problems for large companies and Grafana installations. And in Grafana 7.0 we are finally solving one of the most common problems of using Grafana at scale.
This includes problems like:
- There are too many dashboards, how do I find the right one?
- How to find popular dashboards
- How to find dashboards with errors
- How to identify dashboards that are not being used
- Who created or last viewed this dashboard?
Usage insights and Presence indicator
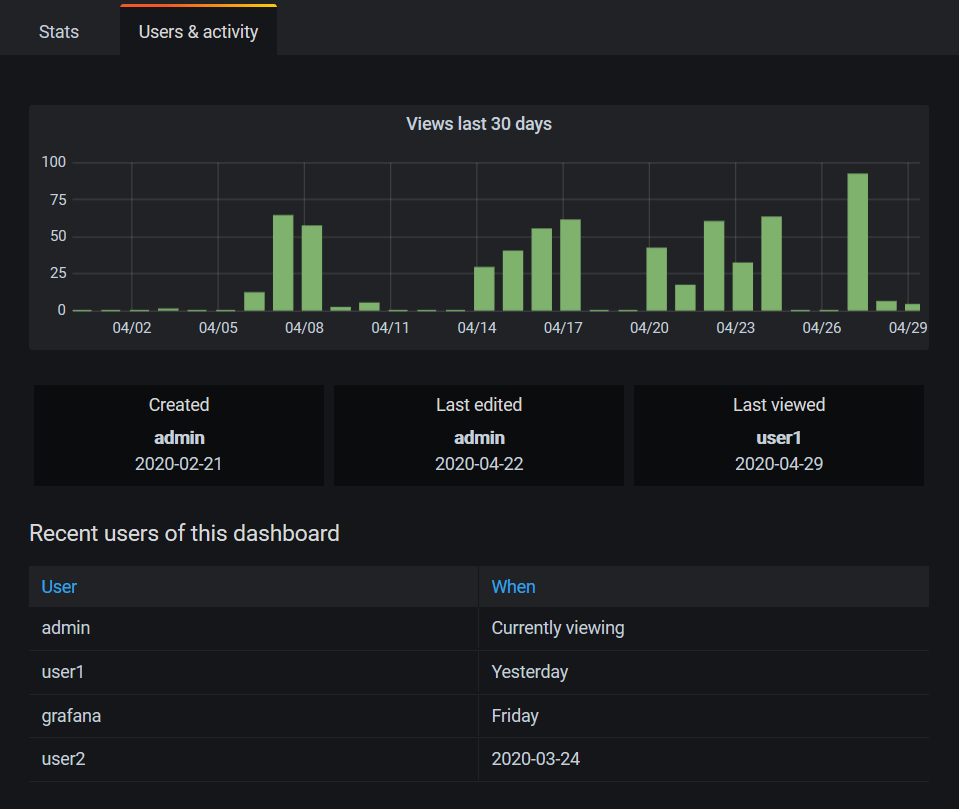
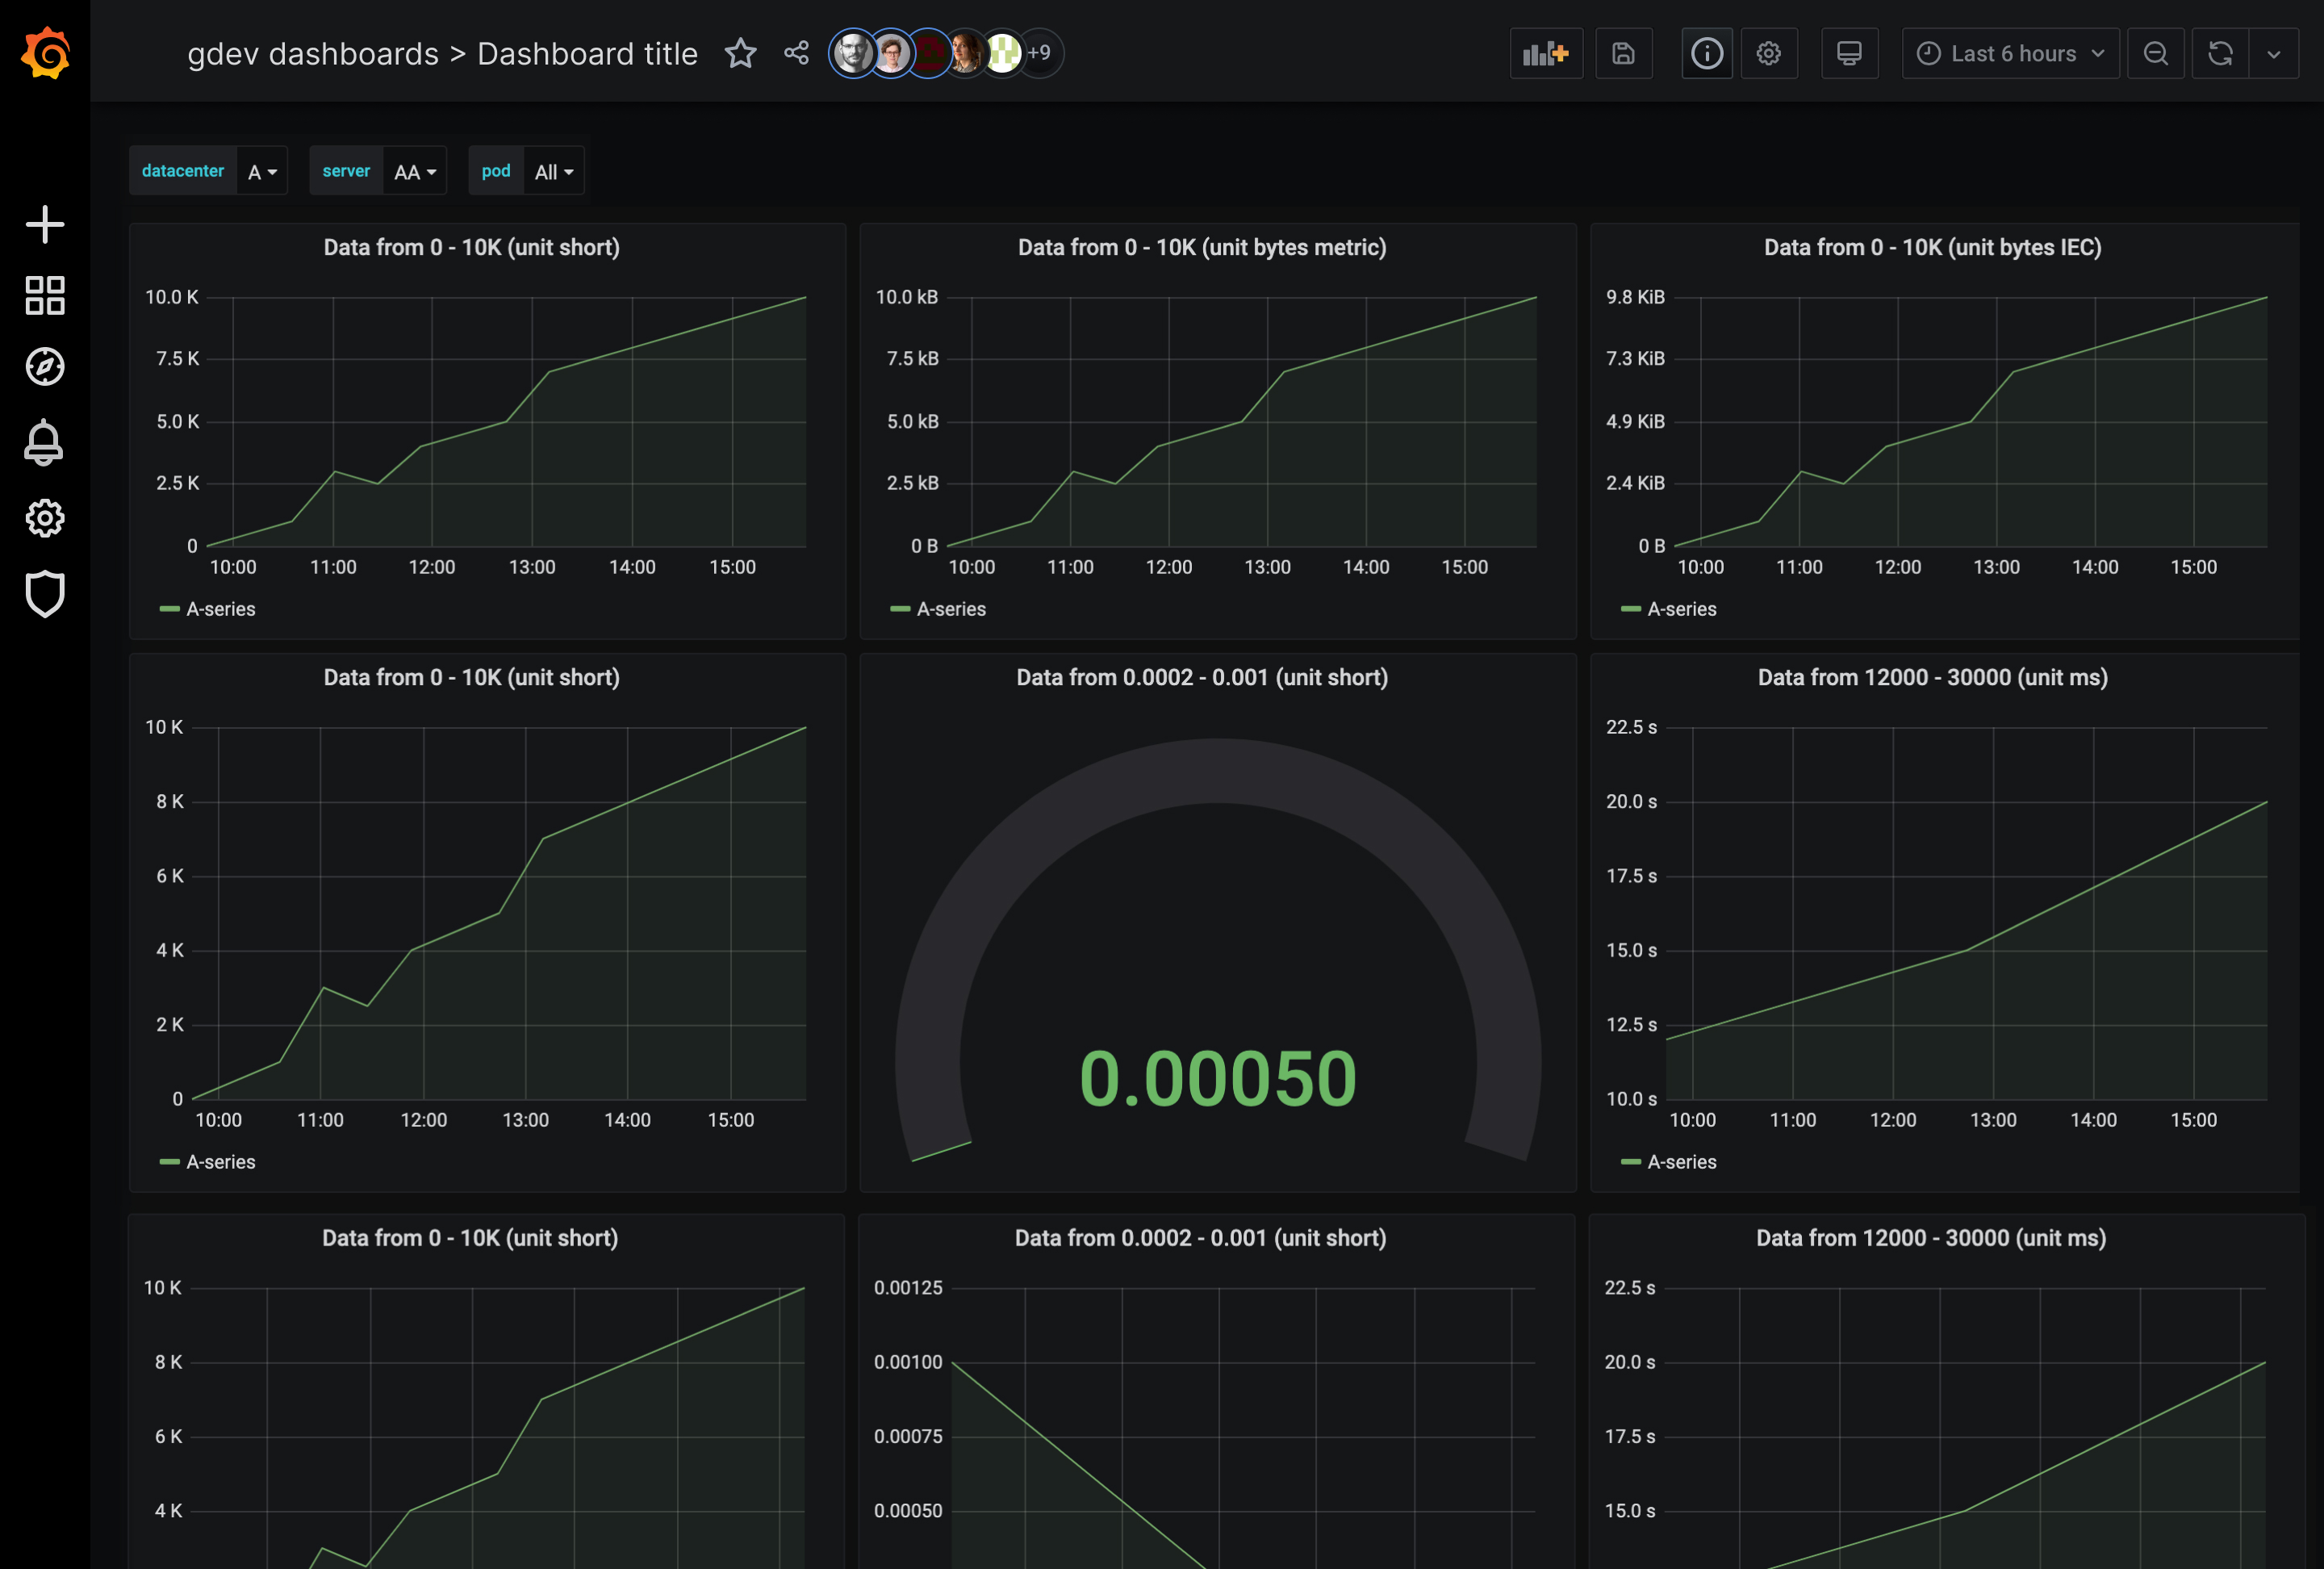
This release includes a series of features that build on our new usage analytics engine. This “Grafana about Grafana” feature will help our large customers get better insight into the behavior and utilization of their users, dashboards, and data sources. The improved dashboard search allows you to sort dashboards by usage and errors. When a user opens a dashboard, they will see a presence indicator of who else is viewing the same dashboard. And finally Dashboard insights allows you to view recent dashboard usage.
SAML Role and Team Sync
SAML support in Grafana Enterprise is improved by adding Role and Team Sync. Read more about how to use these features in the SAML team sync documentation.
Okta OAuth Team Sync
Okta gets its own provider which adds support for Team Sync. Read more about it in the Okta documentation.
Upgrading
See upgrade notes.
Changelog
Check out CHANGELOG.md for a complete list of new features, changes, and bug fixes.


