Important: This documentation is about an older version. It's relevant only to the release noted, many of the features and functions have been updated or replaced. Please view the current version.
What’s new in Grafana v4.1
- Graph: Support for shared tooltip on all graphs as you hover over one graph. #1578, #6274
- Victorops: Add VictorOps notification integration #6411, thx @ichekrygin
- Opsgenie: Add OpsGenie notification integratiion #6687, thx @kylemcc
- Cloudwatch: Make it possible to specify access and secret key on the data source config page #6697
- Elasticsearch: Added support for Elasticsearch 5.x #5740, thx @lpic10
- Panel: Added help text for panels. #4079, thx @utkarshcmu
- Full changelog
Shared tooltip

Showing the tooltip on all panels at the same time has been a long standing request in Grafana and we are really happy to finally be able to release it. You can enable/disable the shared tooltip from the dashboard settings menu or cycle between default, shared tooltip and shared crosshair by pressing Ctrl/Cmd+O.
Help text for panel

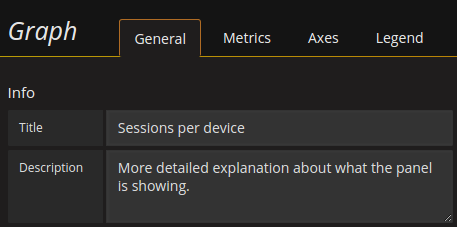
You can set a help text in the general tab on any panel. The help text is using Markdown to enable better formatting and linking to other sites that can provide more information.

Panels with a help text available have a little indicator in the top left corner. You can show the help text by hovering the icon.
Easier Cloudwatch configuration

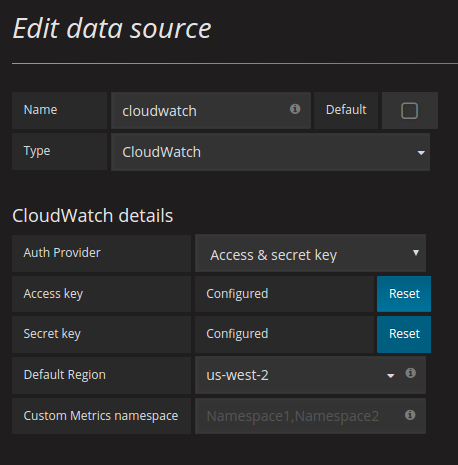
In Grafana 4.1.0 you can configure your Cloudwatch data source with access key and secret key directly in the data source configuration page.
This enables people to use the Cloudwatch data source without having access to the filesystem where Grafana is running.
Once the access key and secret key have been saved the user will no longer be able to view them.
Upgrade and Breaking changes
Elasticsearch 1.x is no longer supported. Please upgrade to Elasticsearch 2.x or 5.x. Otherwise Grafana 4.1.0 contains no breaking changes.
Changelog
Check out the CHANGELOG.md file for a complete list of new features, changes, and bug fixes.
Download
Head to v4.1 download page for download links and instructions.
Thanks
A big thanks to all the Grafana users who contribute by submitting PRs, bug reports and feedback!


