Important: This documentation is about an older version. It's relevant only to the release noted, many of the features and functions have been updated or replaced. Please view the current version.
What’s new in Grafana v3.0
Commercial Support
Commercial Support subscriptions for Grafana are now generally available.
Raintank is committed to a 100% open-source strategy for Grafana. We do not want to go down the “open core” route. If your organization finds Grafana valuable, please consider purchasing a subscription. Get direct support, bug fixes, and training from the core Grafana team.
Plugins
With the popularity of Grafana continuing to accelerate, it has been challenging to keep up with all the requests for new features, new panels, new data sources, and new functionality. Saying “no” so often has been frustrating, especially for an open source project with such a vibrant community.
The team felt that it was time to dramatically improve extensibility through plugin support. Grafana 3.0 comes with a completely revamped plugin SDK / API.
We’ve refactored our Data Source plugin architecture and added two new plugin types:
- Panel plugins let you add new panel types for your Dashboards.
- App plugins bundle Panels plugins, Data Sources plugins, Dashboards, and Grafana Pages. Apps are a great way to provide an entire experience right within Grafana.
Grafana.com
Grafana.com offers a central repository where the community can come together to discover, create and share plugins (data sources, panels, apps) and dashboards.
We are also working on a hosted Graphite-compatible data source that will be optimized for use with Grafana. It’ll be easy to combine your existing data source(s) with this OpenSaaS option. Finally, Grafana.com can also be a hub to manage all your Grafana instances. You’ll be able to monitor their health and availability, perform dashboard backups, and more.
We are also working on a hosted Graphite-compatible Data Source that will be optimized for use with Grafana. It’ll be easy to combine your existing Data Source(s) with this OpenSaaS option.
Finally, Grafana.com will also be a hub to manage all your Grafana instances. You’ll be able to monitor their health and availability, perform Dashboard backups, and more.
Grafana.net will officially launch along with the stable version of Grafana 3.0, but go to and check out the preview and sign up for an account in the meantime.
grafana-cli
Grafana 3.0 comes with a new command line tool called grafana-cli. You can easily install plugins from Grafana.net with it. For example:
grafana-cli install grafana-pie-chart-panelPersonalization and Preferences
The home dashboard, timezone and theme can now be customized on Organization and user Profile level. Grafana can also track recently viewed dashboards, which can then be displayed in the dashboard list panel.
Improved Playlists
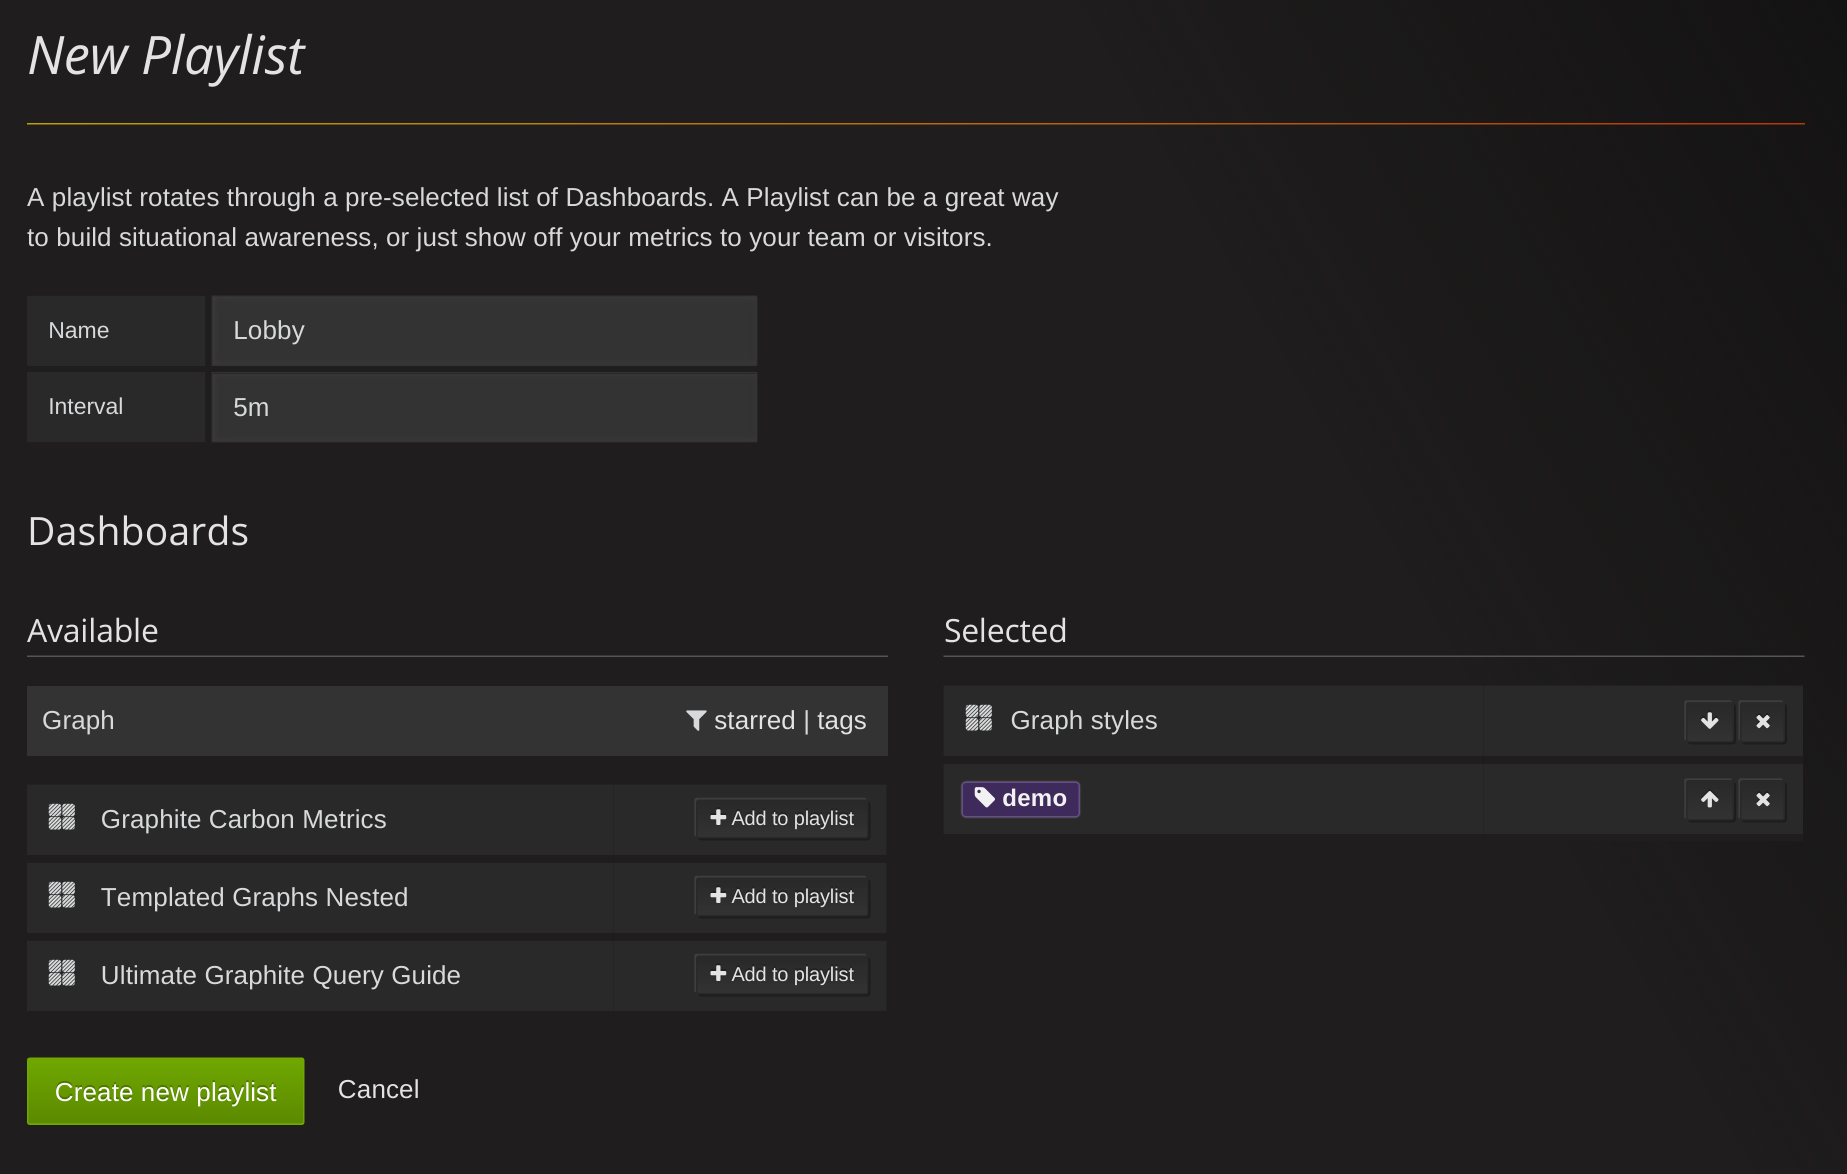
You can now save Playlists, and start them by using a Playlist URL. If you update a running Playlist, it will update after its next cycle.
This is powerful as it allows you to remote control Grafana. If you have a big TV display showing Grafana in your company lobby, create a playlist named Lobby, and start it on the computer connected to the Lobby TV.
You can now change the Lobby playlist and have the dashboards shown in the Lobby update accordingly, automatically.
The playlist does not even have to contain multiple Dashboards; you can use this feature to reload the whole Dashboard (and Grafana) periodically and remotely.
You can also make Playlists dynamic by using Dashboard tags to define the Playlist.
Improved UI
We’ve always tried to focus on a good looking, usable, and responsive UI. We’ve continued to pay a lot of attention to these areas in this release.
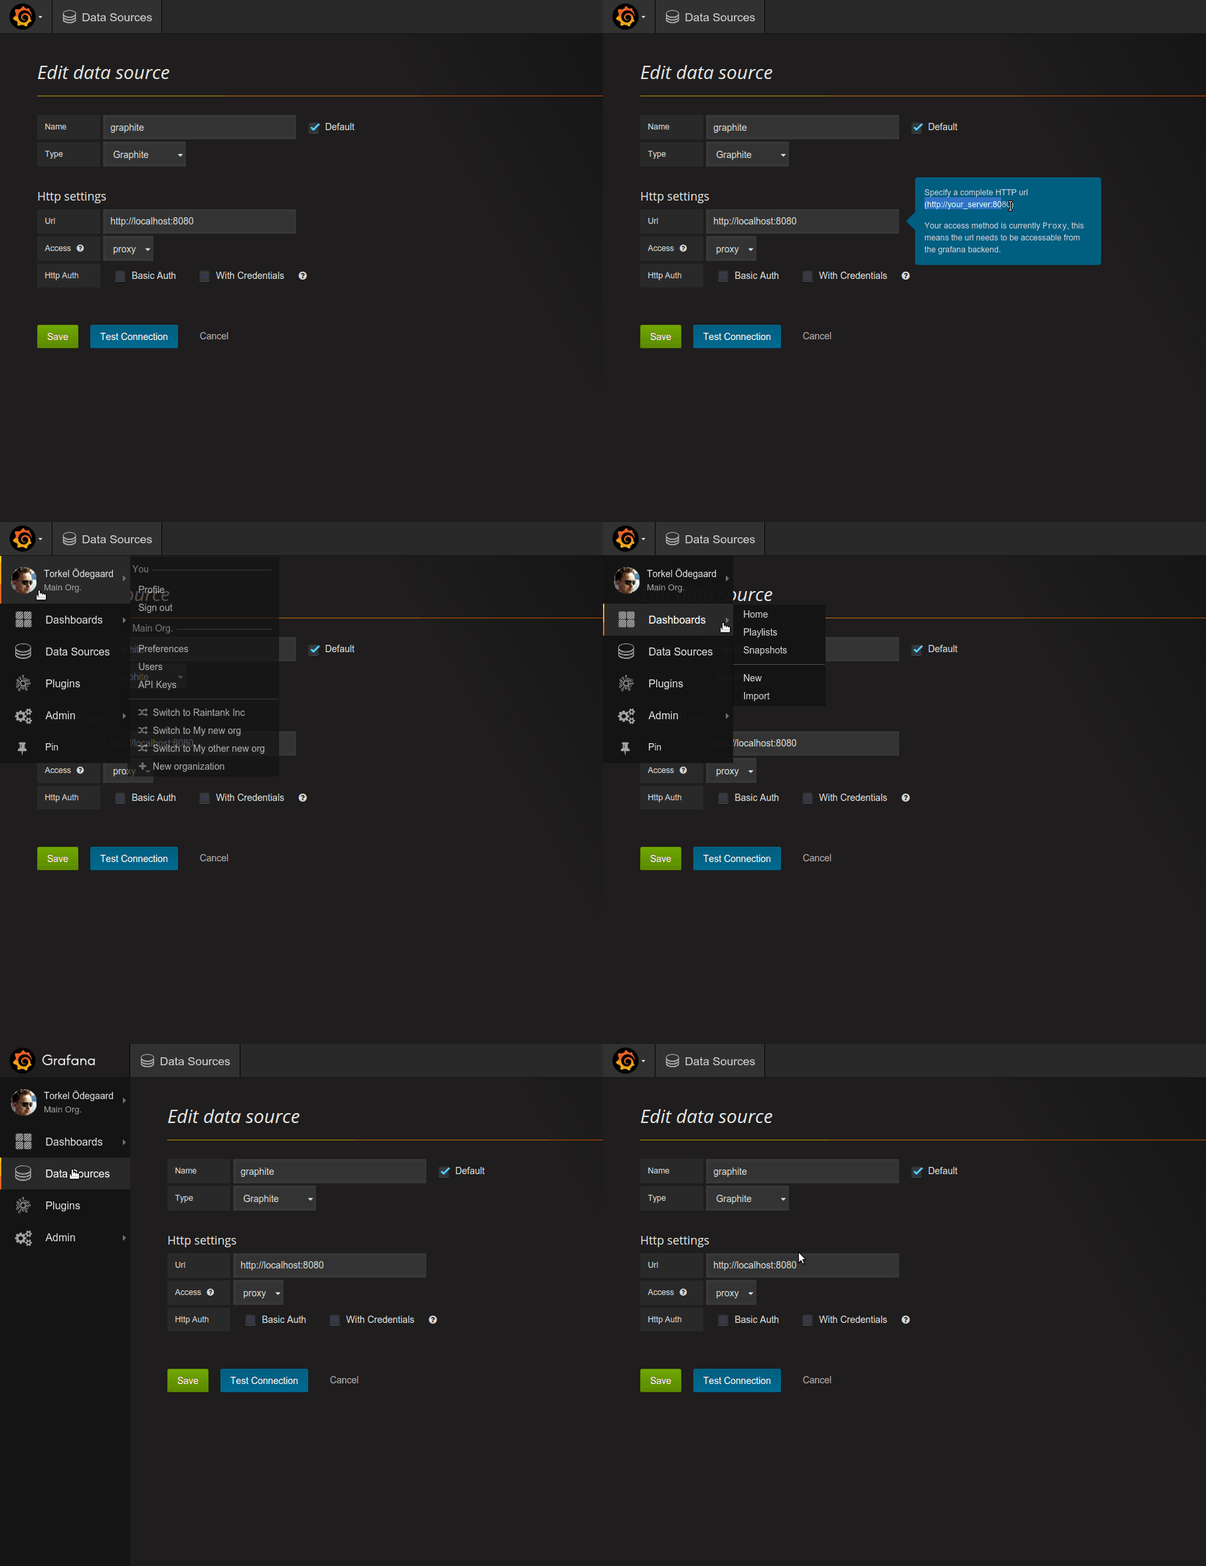
Grafana 3.0 has a dramatically updated UI that not only looks better but also has a number of usability improvements. The side menu now works as a dropdown that you can pin to the side. The Organization / Profile / Sign out side menu links have been combined into an on hover slide out menu.
In addition, all the forms and the layouts of all pages have been updated to look and flow better, and be much more consistent. There are literally hundreds of UI improvements and refinements.
Here’s the new side menu in action:
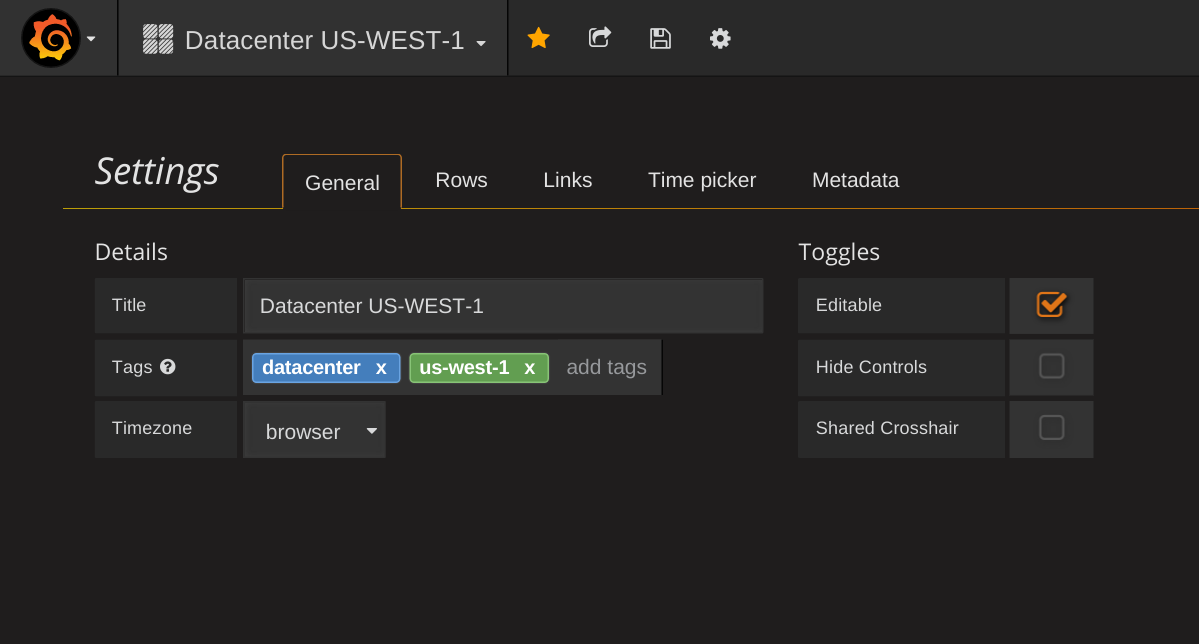
And here’s the new look for Dashboard settings:
Check out the Play Site to get a feel for some of the UI changes.
Improved Annotations
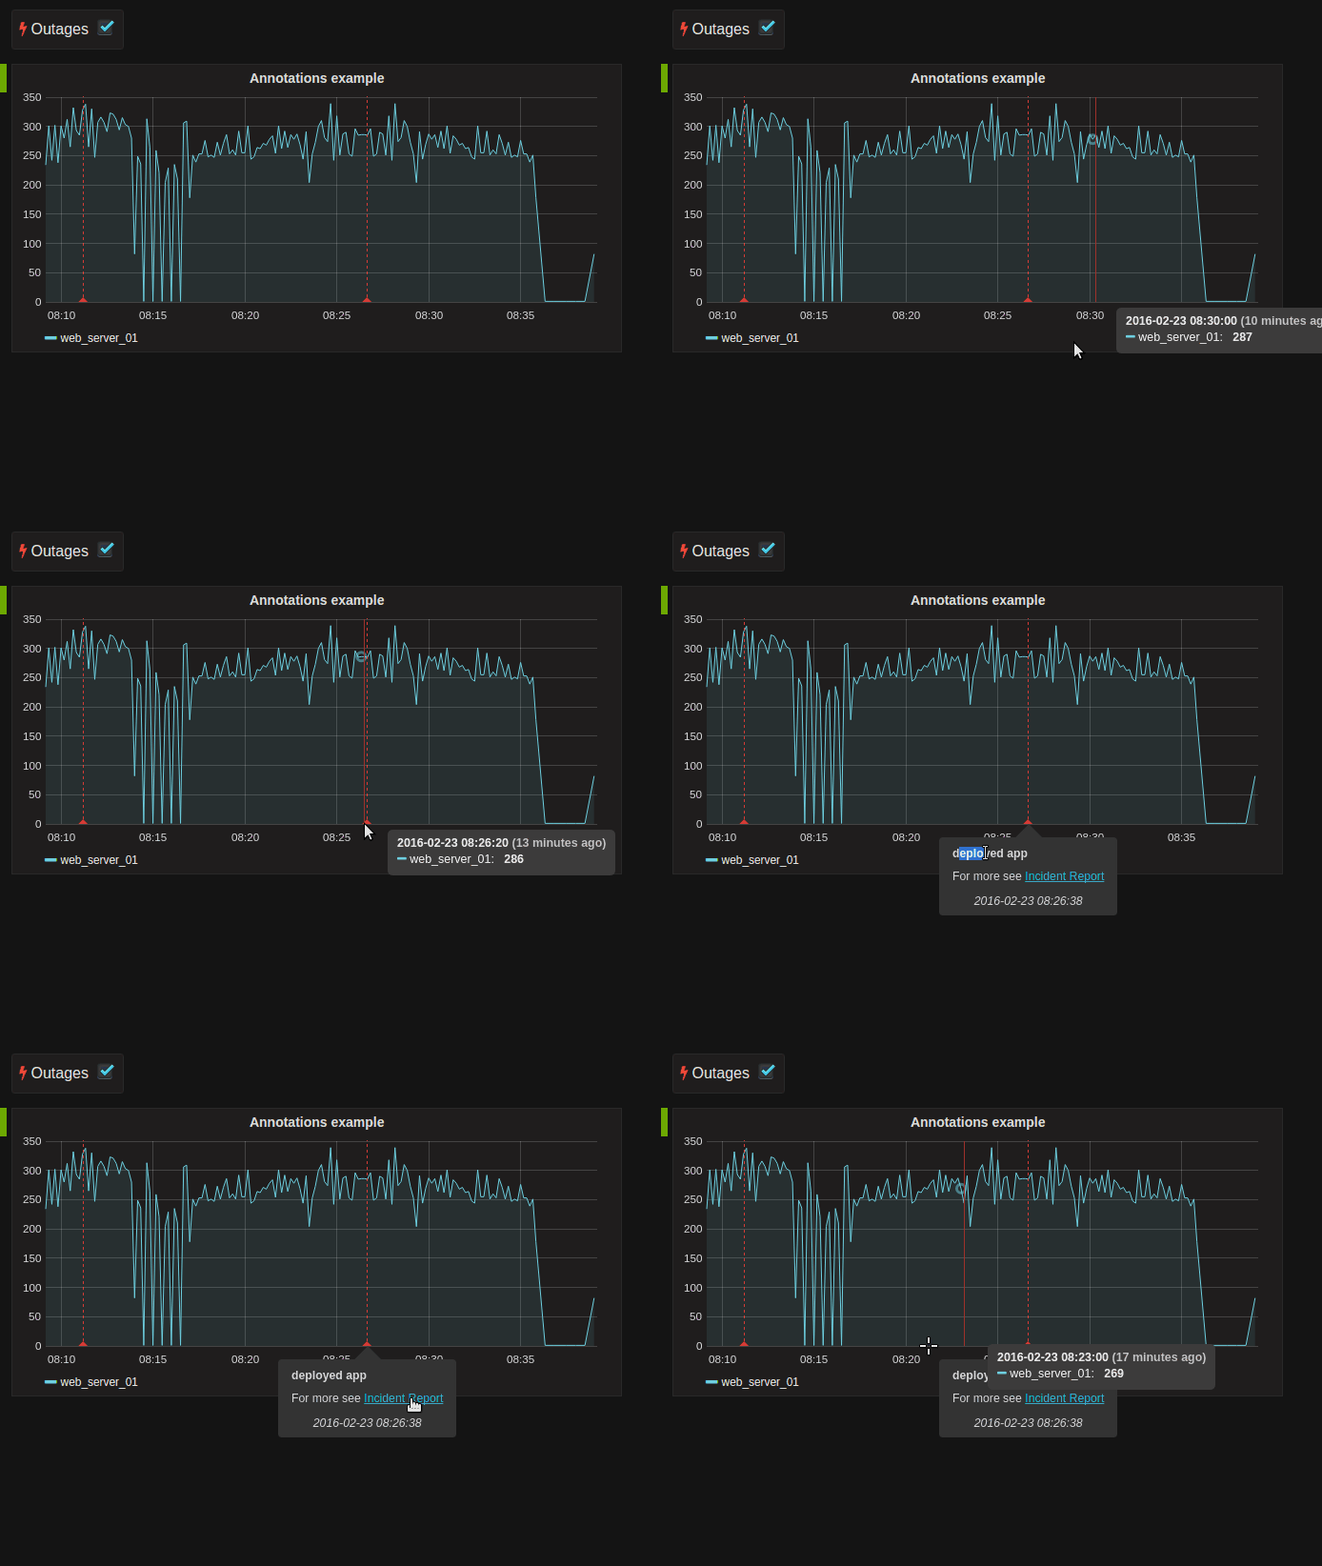
It is now possible to define a link in each annotation. You can hover over the link and click the annotation text. This feature is very useful for linking to particular commits or tickets where more detailed information can be presented to the user.
Data source variables
This has been a top requested feature for very long we are excited to finally provide
this feature. You can now add a new Data source type variable. That will
automatically be filled with instance names of your data sources.
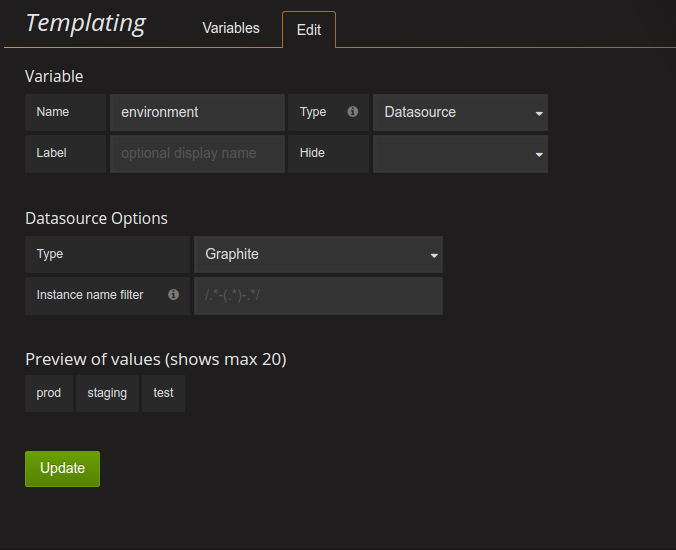
You can then use this variable as the panel data source:
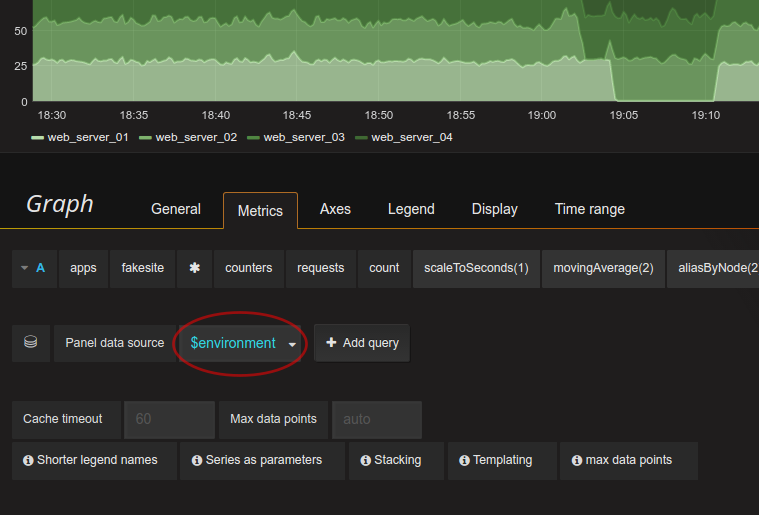
This will allow you to quickly change data source server and reuse the same dashboard for different instances of your metrics backend. For example you might have Graphite running in multiple data centers or environments.
Prometheus, InfluxDB, and OpenTSDB improvements
All three of these popular included Data Sources have seen a variety of improvements in this release. Here are some highlights:
Prometheus
The Prometheus Data Source now supports annotations.
InfluxDB
You can now select the InfluxDB policy from the query editor.

Grafana 3.0 also comes with support for InfluxDB 0.11 and InfluxDB 0.12.
OpenTSDB
OpenTSDB 2.2 is better supported and now supports millisecond precision.
Breaking changes
Dashboards from v2.6 are compatible; no manual updates should be necessary. There could be some edge case scenarios where dashboards using templating could stop working. If that is the case just enter the edit view for the template variable and hit Update button. This is due to a simplification of the variable format system where template variables are now stored without any formatting (glob/regex/etc), this is done on the fly when the variable is interpolated.
Plugin API: The plugin API has changed so if you are using a custom data source (or panel) they need to be updated as well.
InfluxDB 0.8: This data source is no longer included in releases, you can still install manually from Grafana.com
KairosDB: This data source has also no longer shipped with Grafana, you can install it manually from Grafana.com
Plugin showcase
Discovering and installing plugins is very quick and easy with Grafana 3.0 and Grafana.com. Here are a couple that I encourage you try!
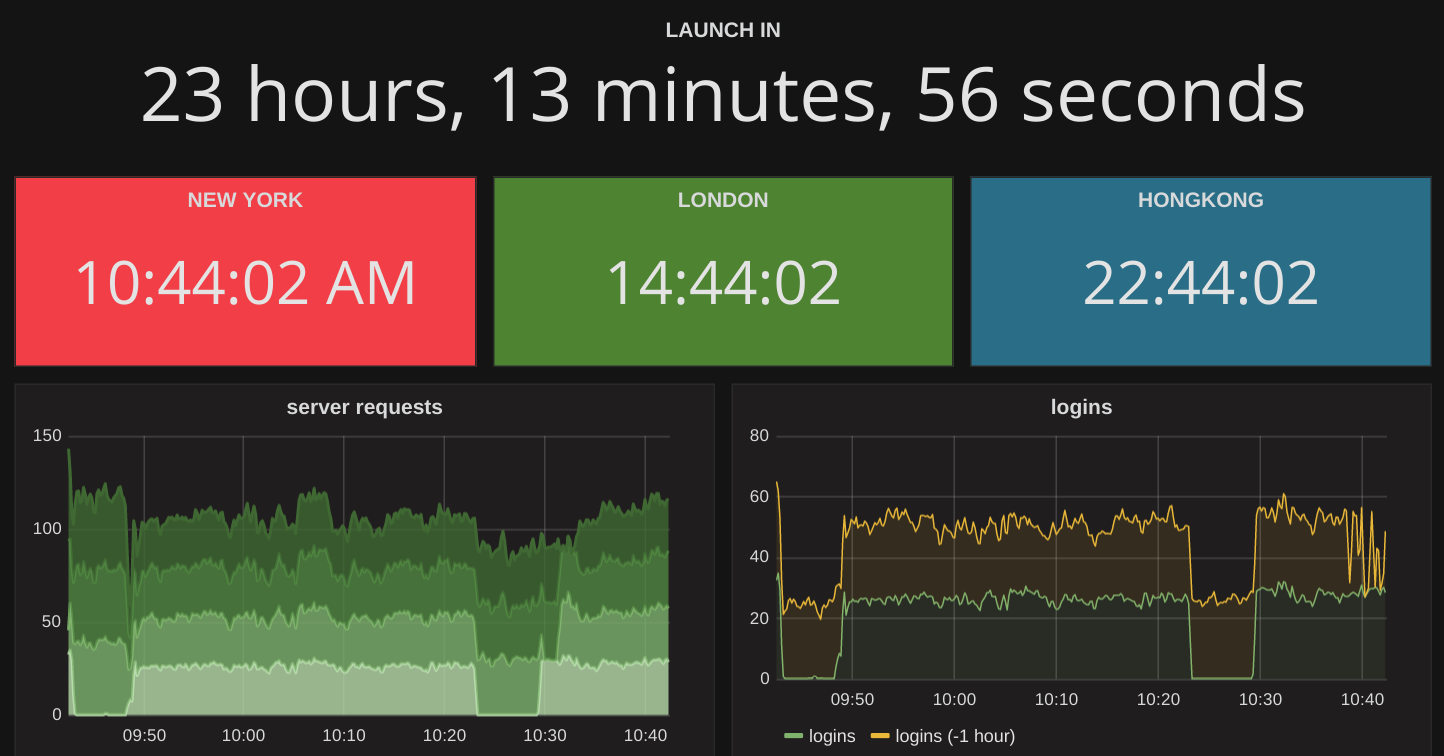
Clock Panel
Support’s both current time and count down mode.
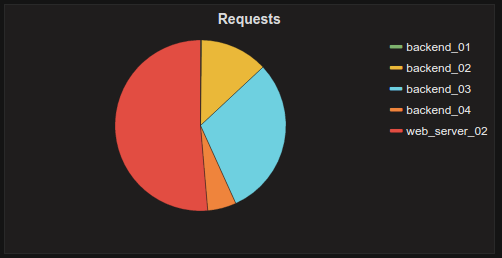
Pie Chart Panel
A simple pie chart panel is now available as an external plugin.
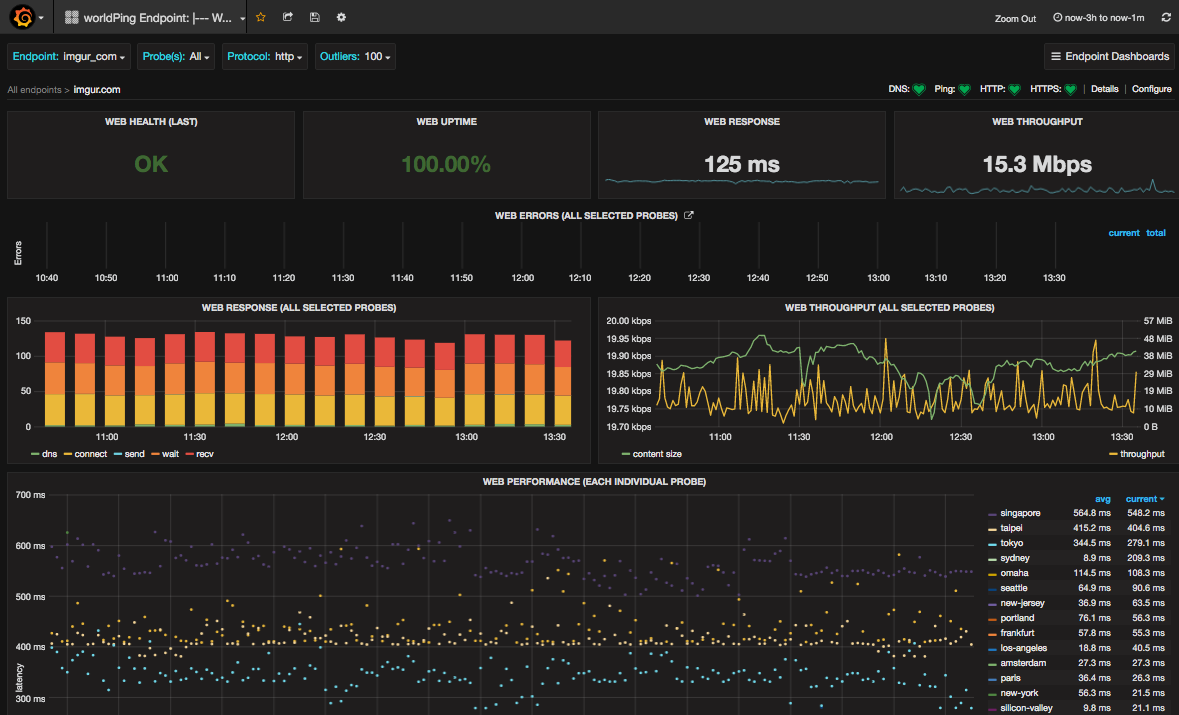
WorldPing App
This is full blown Grafana App that adds new panels, data sources and pages to give feature rich global performance monitoring directly from your on-prem Grafana.
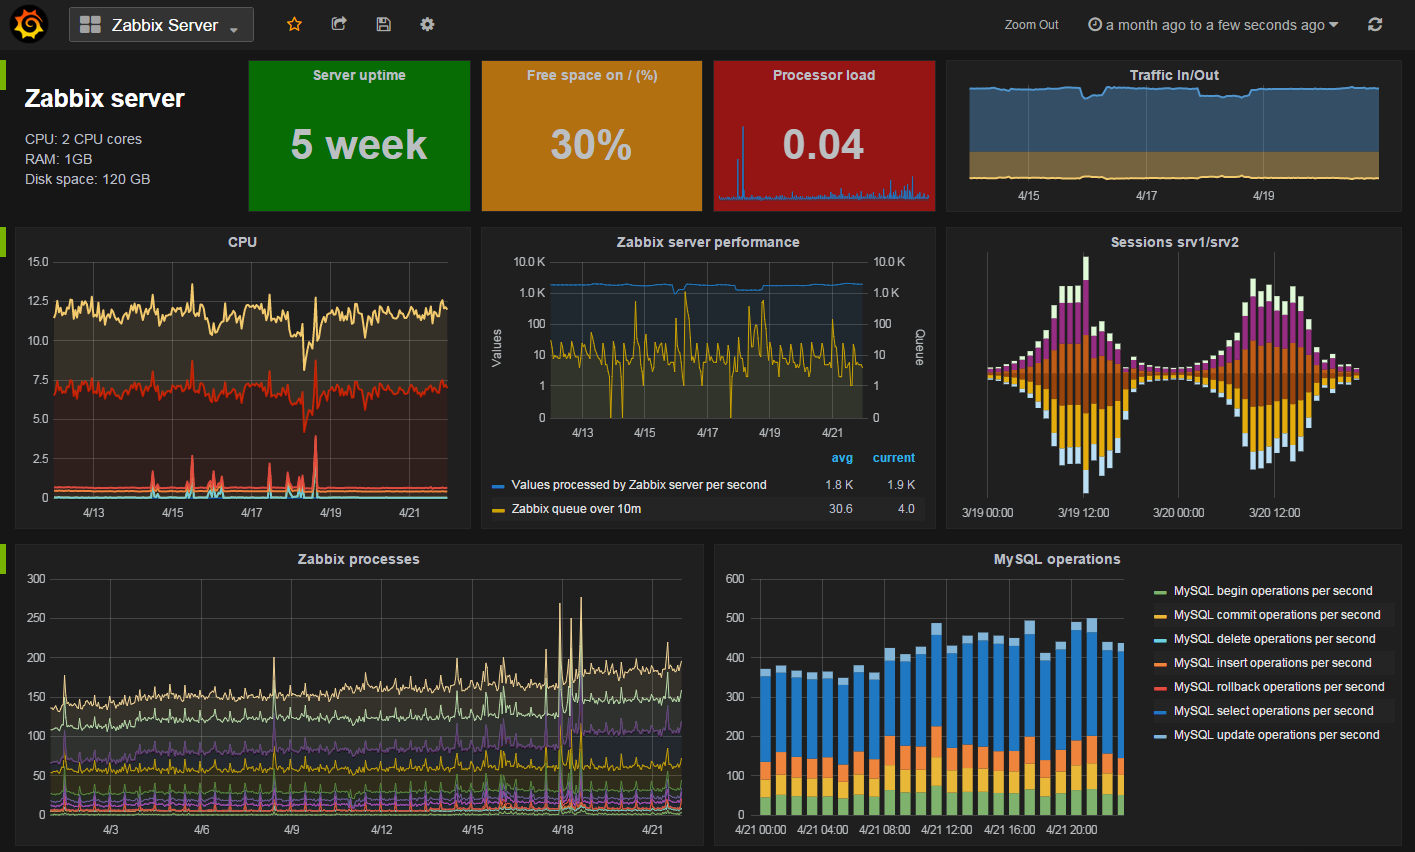
Zabbix App
This app contains the already very pouplar Zabbix data source plugin, 2 dashboards and a triggers panel. It is created and maintained by Alexander Zobnin.
Check out the full list of plugins on Grafana.com
CHANGELOG
For a detailed list and link to github issues for everything included in the 3.0 release please view the CHANGELOG.md file.


