Important: This documentation is about an older version. It's relevant only to the release noted, many of the features and functions have been updated or replaced. Please view the current version.
Reporting
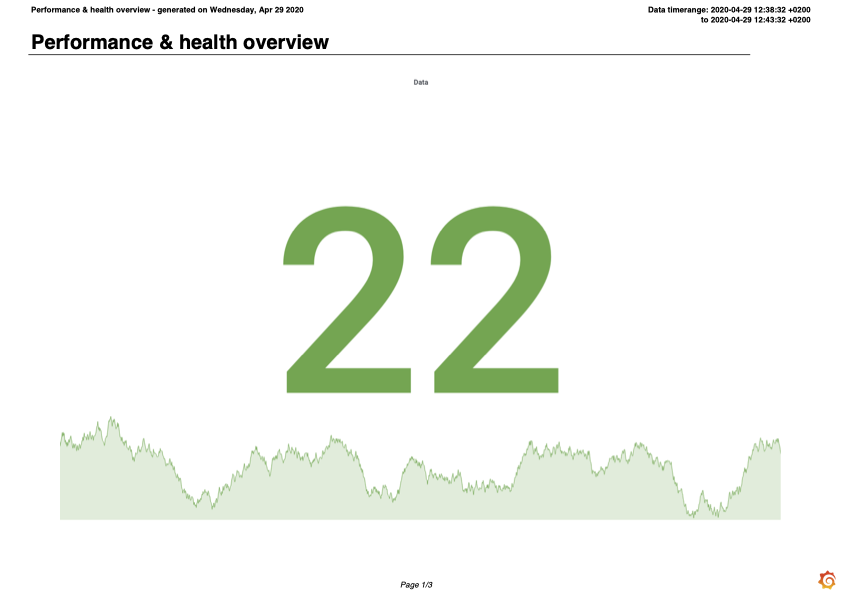
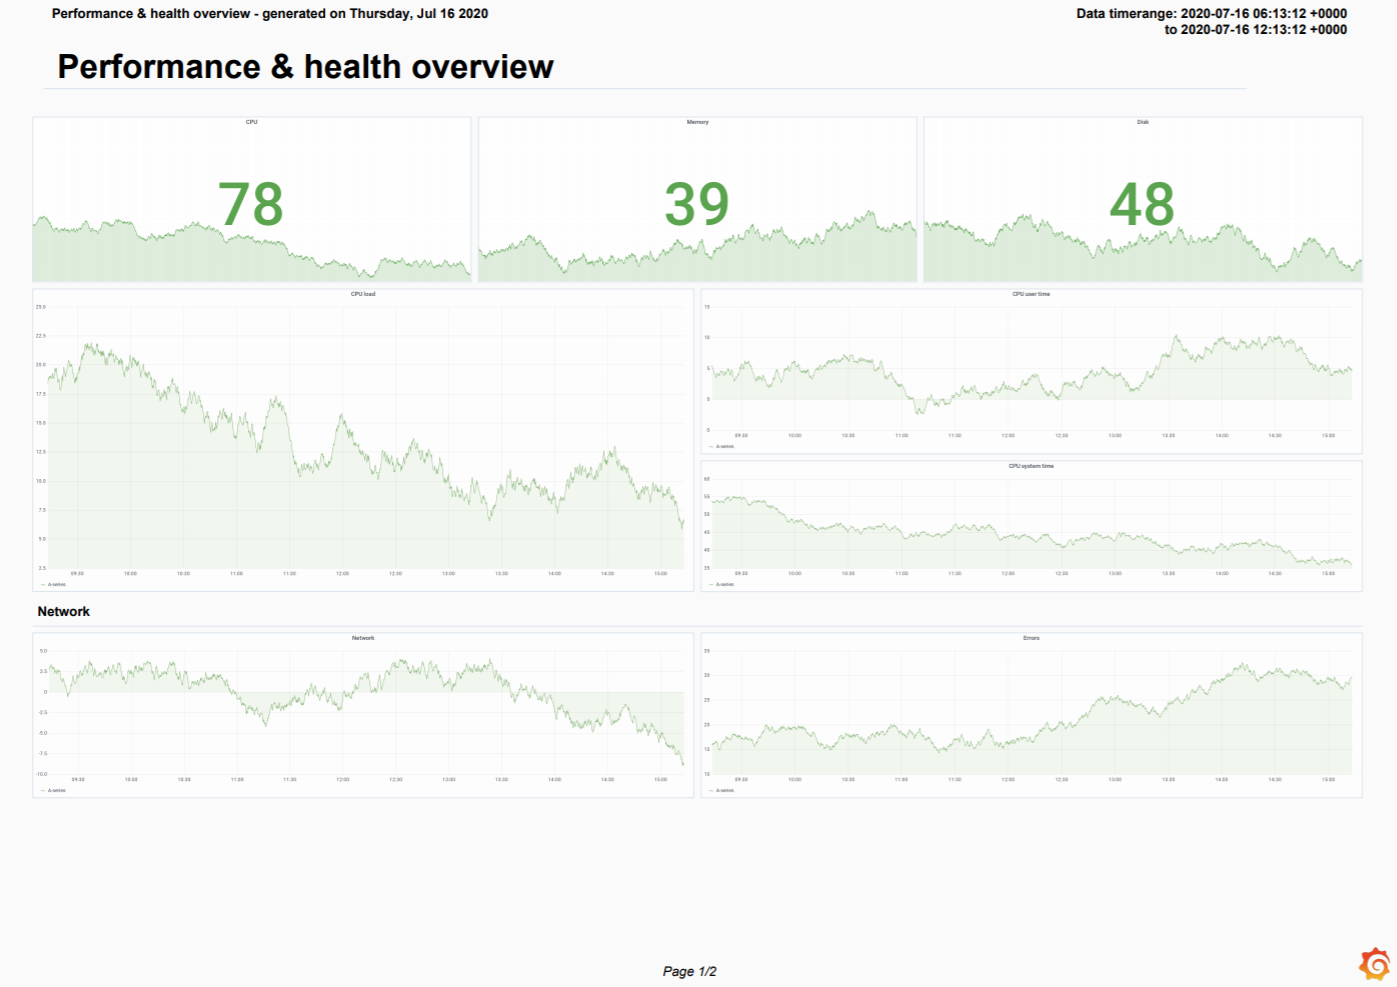
Reporting allows you to automatically generate PDFs from any of your dashboards and have Grafana email them to interested parties on a schedule.
Only available in Grafana Enterprise v6.4+.
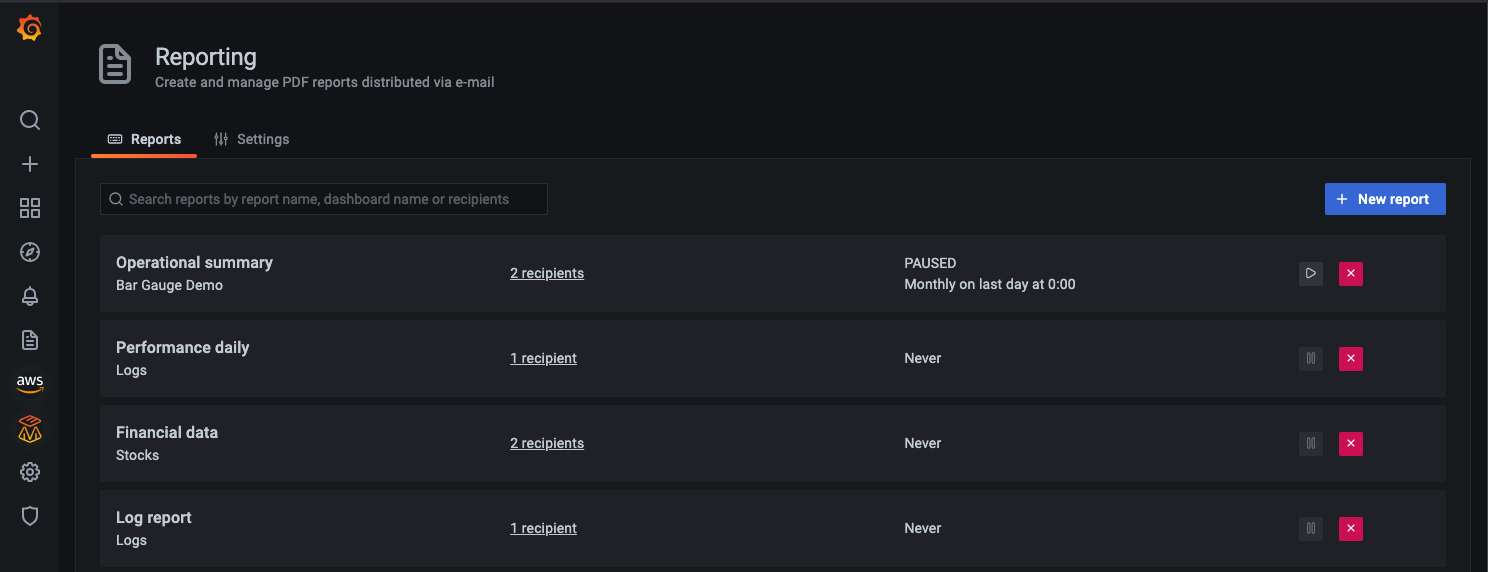
Any changes you make to a dashboard used in a report are reflected the next time the report is sent. For example, if you change the time range in the dashboard, then the time range in the report changes as well.
Requirements
- SMTP must be configured for reports to be sent. Refer to SMTP in Configuration for more information.
- The Image Renderer plugin must be installed or the remote rendering service must be set up. Refer to Image rendering for more information.
Create or update a report
Currently only Organization Admins can create reports.
- Click on the reports icon in the side menu. The Reports tab allows you to view, create, and update your reports.
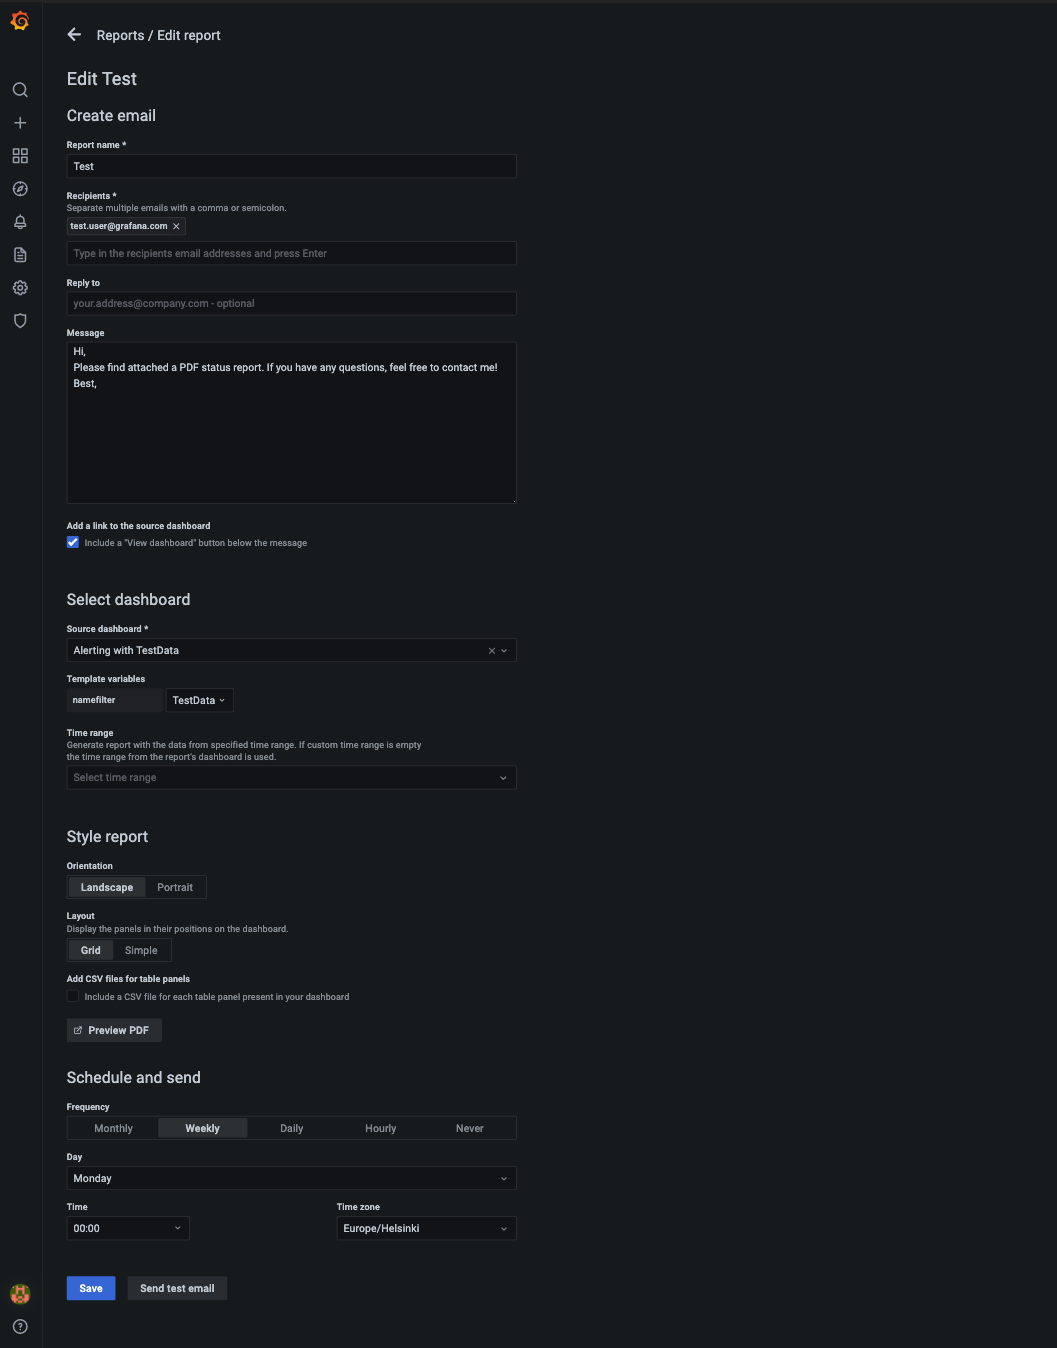
- Enter report information. All fields are required unless otherwise indicated.
- Name - Name of the report as you want it to appear in the Reports list.
- Source dashboard - Select the dashboard to generate the report from.
- Recipients - Enter the emails of the people or teams that you want to receive the report.
- Reply to - (optional) The address that will appear in the Reply to field of the email.
- Message - (optional) Message body in the email with the report.
- Time range - (optional) Use custom time range for the report. For more information check Report time range.
- Preview PDF to make sure the report appears as you expect. Update if necessary.
- Enter scheduling information. Options vary depending on the frequency you select.
- Select the orientation option for generated report: Portrait or Landscape.
- Select the layout option for generated report: Simple or Grid.
- Save the report.
- Send test email to verify that the whole configuration is working as expected.
Layout and orientation
We’re actively working on developing new report layout options. Contact us if you would like to get involved in the design process.
Scheduling
Scheduled reports can be sent on a weekly, daily, or hourly basis. You may also disable scheduling for when you either want to pause a report or send it via the API.
All scheduling indicates when the reporting service will start rendering the dashboard. It can take a few minutes to render a dashboard with a lot of panels.
Hourly
Hourly reports are generated once per hour. All fields are required.
- At minute - The number of minutes after full hour when the report should be generated.
- Time zone - Time zone to determine the offset of the full hour. Does not currently change the time in the rendered report.
Daily
Daily reports are generated once per day. All fields are required.
- Time - Time the report is sent, in 24-hour format.
- Time zone - Time zone for the Time field.
Weekly
Weekly reports are generated once per week. All fields are required.
- Day - Weekday which the report should be sent on.
- Time - Time the report is sent, in 24-hour format.
- Time zone - Time zone for the Time field.
Monthly
Only available in Grafana Enterprise v7.1+.
Monthly reports are generated once per month. All fields are required.
- Day in month - Day of the month when the report should be sent. You can select
lastfor reports that should go out on the last day of the month. - Time - Time the report is sent, in 24-hour format.
- Time zone - Time zone for the Time field.
Never
Only available in Grafana Enterprise v7.0+.
Reports which are scheduled to never be sent have no parameter and will not be sent to the scheduler. They may be manually generated from the Send test email prompt or via the Reporting API.
Send test email
Only available in Grafana Enterprise v7.0+.
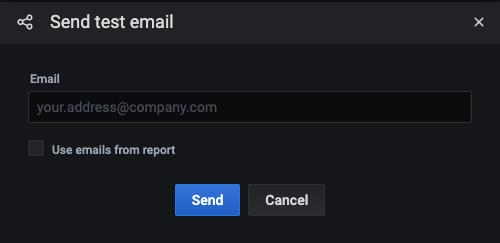
- In the report, click Send test email.
- In the Email field, enter the email address or addresses that you want to test, separated by semicolon. If you want to use email addresses from the report, then select the Use emails from report check box.
- Click Send.
The last saved version of the report will be sent to selected emails. You can use this to verify emails are working and to make sure the report is generated and displayed as you expect.
Send report via the API
You can send reports programmatically with the send report endpoint in the HTTP APIs.
Rendering configuration
When generating reports, each panel renders separately before being collected in a PDF. The per panel rendering timeout and number of concurrently rendered panels can be configured.
To modify the panels’ clarity you can set a scale factor for the rendered images. A higher scale factor is more legible but will increase the file size of the generated PDF.
These options are available in the configuration file.
[reporting]
# Set timeout for each panel rendering request
rendering_timeout = 10s
# Set maximum number of concurrent calls to the rendering service
concurrent_render_limit = 4
# Set the scale factor for rendering images. 2 is enough for monitor resolutions
# 4 would be better for printed material. Setting a higher value affects performance and memory
image_scale_factor = 2
Report time range
Setting custom report time range is available in Grafana Enterprise v7.2+.
By default, reports use the saved time range of the dashboard. Changing the time range of the report can be done by:
- Saving a modified time range to the dashboard.
- Setting a time range via Time range field in the report form. If specified, then this custom time range overrides the one from the report’s dashboard.
The page header of the report displays the time range for the dashboard’s data queries. Dashboards set to use the browser’s time zone will use the time zone on the Grafana server.
If the time zone is set differently between your Grafana server and its remote image renderer, then the time ranges in the report might be different between the page header and the time axes in the panels. We advise always setting the time zone to UTC for dashboards when using a remote renderer to avoid this.
Reports settings
Only available in Grafana Enterprise v7.2+.
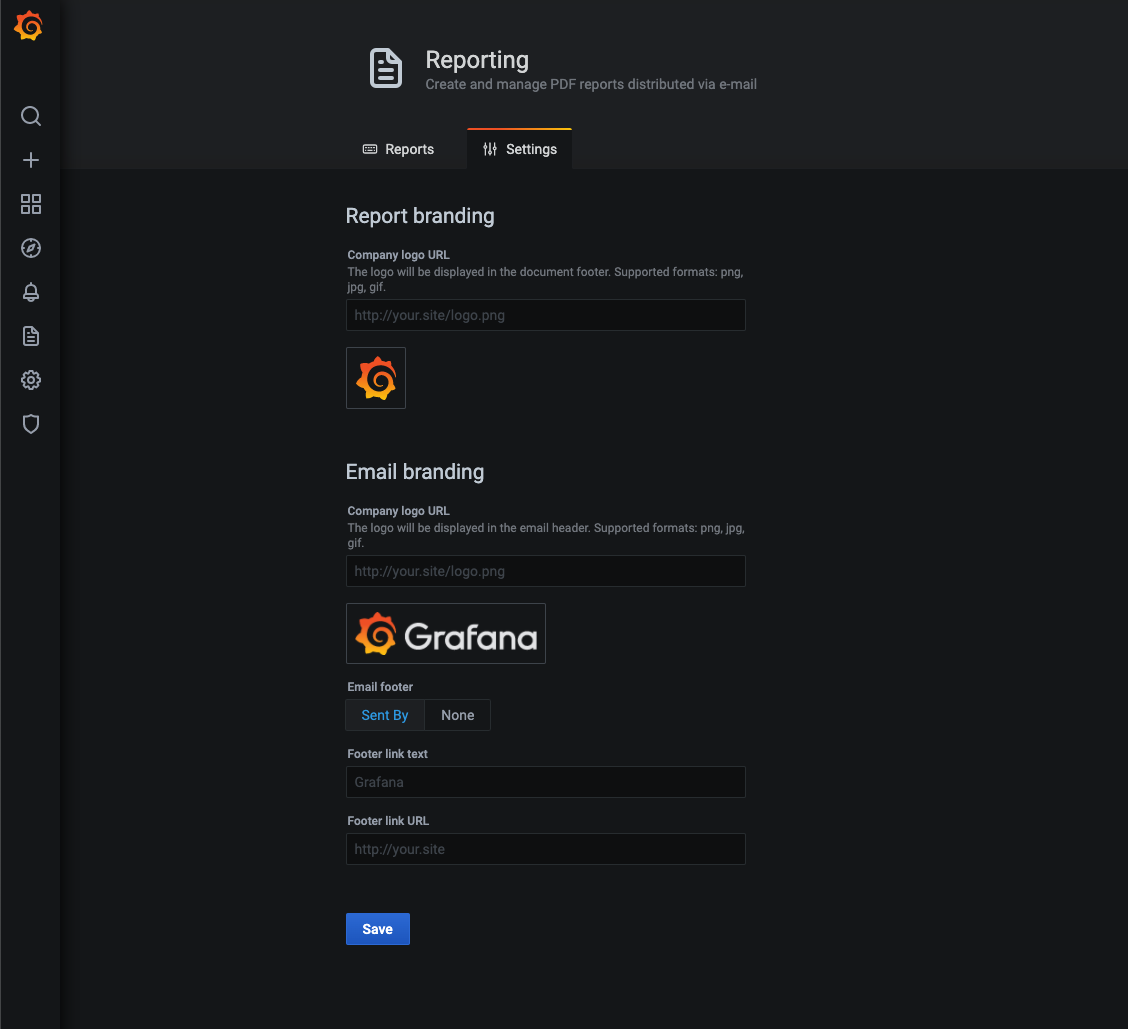
You can configure organization-wide report settings in the Settings tab on the Reporting page. Settings are applied to all the reports for current organization.
You can customize the branding options.
Report branding: Company logo URL - Company logo displayed in the report PDF. Defaults to the Grafana logo.
Email branding:
- Company logo URL - Company logo displayed in the report PDF. Defaults to the Grafana logo.
- Email footer - Toggle to enable report email footer. Select Sent by or None.
- Footer link text - Text for the link in the report email footer. Defaults to “Grafana”.
- Footer link URL - Link for the report email footer.
Troubleshoot reporting
To troubleshoot and get more log information, enable debug logging in the configuration file. Refer to Configuration for more information.
[log]
filters = report:debug

