Important: This documentation is about an older version. It's relevant only to the release noted, many of the features and functions have been updated or replaced. Please view the current version.
Using Azure Monitor in Grafana
Officially released in Grafana v6.0.0
As of Grafana 6.0, the Azure Monitor plugin has been moved into Grafana so it now ships with built-in support for Azure Monitor.
The Azure Monitor data source supports multiple services in the Azure cloud:
- Azure Monitor is the platform service that provides a single source for monitoring Azure resources.
- Application Insights is an extensible Application Performance Management (APM) service for web developers on multiple platforms and can be used to monitor your live web application - it will automatically detect performance anomalies.
- Azure Log Analytics (or Azure Logs) gives you access to log data collected by Azure Monitor.
- Application Insights Analytics allows you to query Application Insights data using the same query language used for Azure Log Analytics.
Add the data source
The data source can access metrics from four different services. You can configure access to the services that you use. It is also possible to use the same credentials for multiple services if that is how you have set it up in Azure AD.
- Guide to setting up an Azure Active Directory Application for Azure Monitor.
- Guide to setting up an Azure Active Directory Application for Azure Log Analytics.
- Quickstart Guide for Application Insights.
Accessed from the Grafana main menu, newly installed data sources can be added immediately within the Data Sources section. Next, click the “Add data source” button in the upper right. The Azure Monitor data source will be available for selection in the Cloud section in the list of data sources.
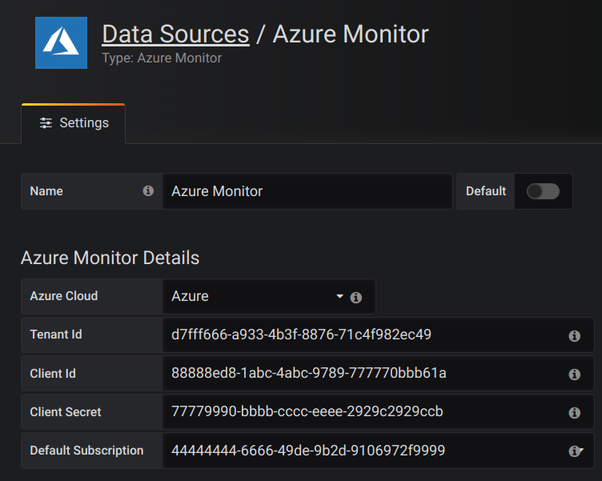
In the name field, Grafana will automatically fill in a name for the data source -
Azure Monitoror something likeAzure Monitor - 3. If you are going to configure multiple data sources, then change the name to something more informative.If you are using Azure Monitor, you need 4 pieces of information from the Azure portal (see link above for detailed instructions):
- Tenant Id (Azure Active Directory -> Properties -> Directory ID)
- Client Id (Azure Active Directory -> App Registrations -> Choose your app -> Application ID)
- Client Secret (Azure Active Directory -> App Registrations -> Choose your app -> Keys)
- Default Subscription Id (Subscriptions -> Choose subscription -> Overview -> Subscription ID)
Paste these four items into the fields in the Azure Monitor API Details section:
![Azure Monitor Configuration Details Azure Monitor Configuration Details]()
Azure Monitor Configuration Details - The Subscription Id can be changed per query. Save the data source and refresh the page to see the list of subscriptions available for the specified Client Id.
If you are also using the Azure Log Analytics service, then you need to specify these two config values (or you can reuse the Client Id and Secret from the previous step).
- Client Id (Azure Active Directory -> App Registrations -> Choose your app -> Application ID)
- Client Secret (Azure Active Directory -> App Registrations -> Choose your app -> Keys -> Create a key -> Use client secret)
If you are using Application Insights, then you need two pieces of information from the Azure Portal (see link above for detailed instructions):
- Application ID
- API Key
Paste these two items into the appropriate fields in the Application Insights API Details section:
![Application Insights Configuration Details Application Insights Configuration Details]()
Application Insights Configuration Details Test that the configuration details are correct by clicking on the “Save & Test” button:
![Save and Test Save and Test]()
Save and Test
Alternatively on step 4 if creating a new Azure Active Directory App, use the Azure CLI:
az ad sp create-for-rbac -n "http://localhost:3000"Choose a Service
In the query editor for a panel, after choosing your Azure Monitor data source, the first option is to choose a service. There are three options here:
Azure MonitorApplication InsightsAzure Log AnalyticsInsights Analytics
The query editor changes depending on which one you pick. Azure Monitor is the default.
Starting in Grafana 7.1, Insights Analytics replaced the former edit mode from within Application Insights.
Query the Azure Monitor service
The Azure Monitor service provides metrics for all the Azure services that you have running. It helps you understand how your applications on Azure are performing and to proactively find issues affecting your applications.
If your Azure Monitor credentials give you access to multiple subscriptions, then choose the appropriate subscription first.
Examples of metrics that you can get from the service are:
Microsoft.Compute/virtualMachines - Percentage CPUMicrosoft.Network/networkInterfaces - Bytes sentMicrosoft.Storage/storageAccounts - Used Capacity

As of Grafana 7.1, the query editor allows you to query multiple dimensions for metrics that support them. Metrics that support multiple dimensions are those listed in the Azure Monitor supported Metrics List that have one or more values listed in the “Dimension” column for the metric.
Format legend keys with aliases for Azure Monitor
The default legend formatting for the Azure Monitor API is:
metricName{dimensionName=dimensionValue,dimensionTwoName=DimensionTwoValue}
Note: Before Grafana 7.1, the formatting included the resource name in the default:
resourceName{dimensionName=dimensionValue}.metricName. As of Grafana 7.1, the resource name has been removed from the default legend.
These can be quite long, but this formatting can be changed by using aliases. In the Legend Format field, you can combine the aliases defined below any way you want.
Azure Monitor examples:
Blob Type: {{ blobtype }}{{ resourcegroup }} - {{ resourcename }}
Alias patterns for Azure Monitor
{{ resourcegroup }}= replaced with the value of the Resource Group{{ namespace }}= replaced with the value of the Namespace (e.g. Microsoft.Compute/virtualMachines){{ resourcename }}= replaced with the value of the Resource Name{{ metric }}= replaced with metric name (e.g. Percentage CPU){{ dimensionname }}= Legacy as of 7.1+ (for backwards compatibility) replaced with the first dimension’s key/label (as sorted by the key/label) (e.g. blobtype){{ dimensionvalue }}= Legacy as of 7.1+ (for backwards compatibility) replaced with first dimension’s value (as sorted by the key/label) (e.g. BlockBlob){{ arbitraryDim }}= Available in 7.1+ replaced with the value of the corresponding dimension. (e.g.{{ blobtype }}becomes BlockBlob)
Create template variables for Azure Monitor
Instead of hard-coding things like server, application and sensor name in your metric queries you can use variables in their place. Variables are shown as dropdown select boxes at the top of the dashboard. These dropdowns make it easy to change the data being displayed in your dashboard.
Note that the Azure Monitor service does not support multiple values yet. If you want to visualize multiple time series (for example, metrics for server1 and server2) then you have to add multiple queries to able to view them on the same graph or in the same table.
The Azure Monitor data source Plugin provides the following queries you can specify in the Query field in the Variable edit view. They allow you to fill a variable’s options list.
| Name | Description |
|---|---|
Subscriptions() | Returns a list of subscriptions. |
ResourceGroups() | Returns a list of resource groups. |
ResourceGroups(12345678-aaaa-bbbb-cccc-123456789aaa) | Returns a list of resource groups for a specified subscription. |
Namespaces(aResourceGroup) | Returns a list of namespaces for the specified resource group. |
Namespaces(12345678-aaaa-bbbb-cccc-123456789aaa, aResourceGroup) | Returns a list of namespaces for the specified resource group and subscription. |
ResourceNames(aResourceGroup, aNamespace) | Returns a list of resource names. |
ResourceNames(12345678-aaaa-bbbb-cccc-123456789aaa, aResourceGroup, aNamespace) | Returns a list of resource names for a specified subscription. |
MetricNamespace(aResourceGroup, aNamespace, aResourceName) | Returns a list of metric namespaces. |
MetricNamespace(12345678-aaaa-bbbb-cccc-123456789aaa, aResourceGroup, aNamespace, aResourceName) | Returns a list of metric namespaces for a specified subscription. |
MetricNames(aResourceGroup, aNamespace, aResourceName) | Returns a list of metric names. |
MetricNames(12345678-aaaa-bbbb-cccc-123456789aaa, aResourceGroup, aNamespace, aResourceName) | Returns a list of metric names for a specified subscription. |
Examples:
- Resource Groups query:
ResourceGroups() - Passing in metric name variable:
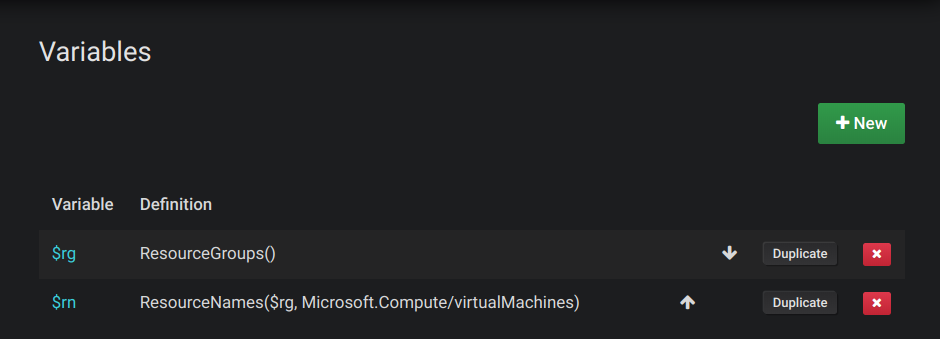
Namespaces(cosmo) - Chaining template variables:
ResourceNames($rg, $ns) - Do not quote parameters:
MetricNames(hg, Microsoft.Network/publicIPAddresses, grafanaIP)
Check out the Templating documentation for an introduction to the templating feature and the different types of template variables.
List of supported Azure Monitor metrics
Not all metrics returned by the Azure Monitor API have values. To make it easier for you when building a query, the Grafana data source has a list of supported Azure Monitor metrics and ignores metrics which will never have values. This list is updated regularly as new services and metrics are added to the Azure cloud. For more information about the list of Azure Monitor metrics, refer to current supported namespaces.
Azure Monitor alerting
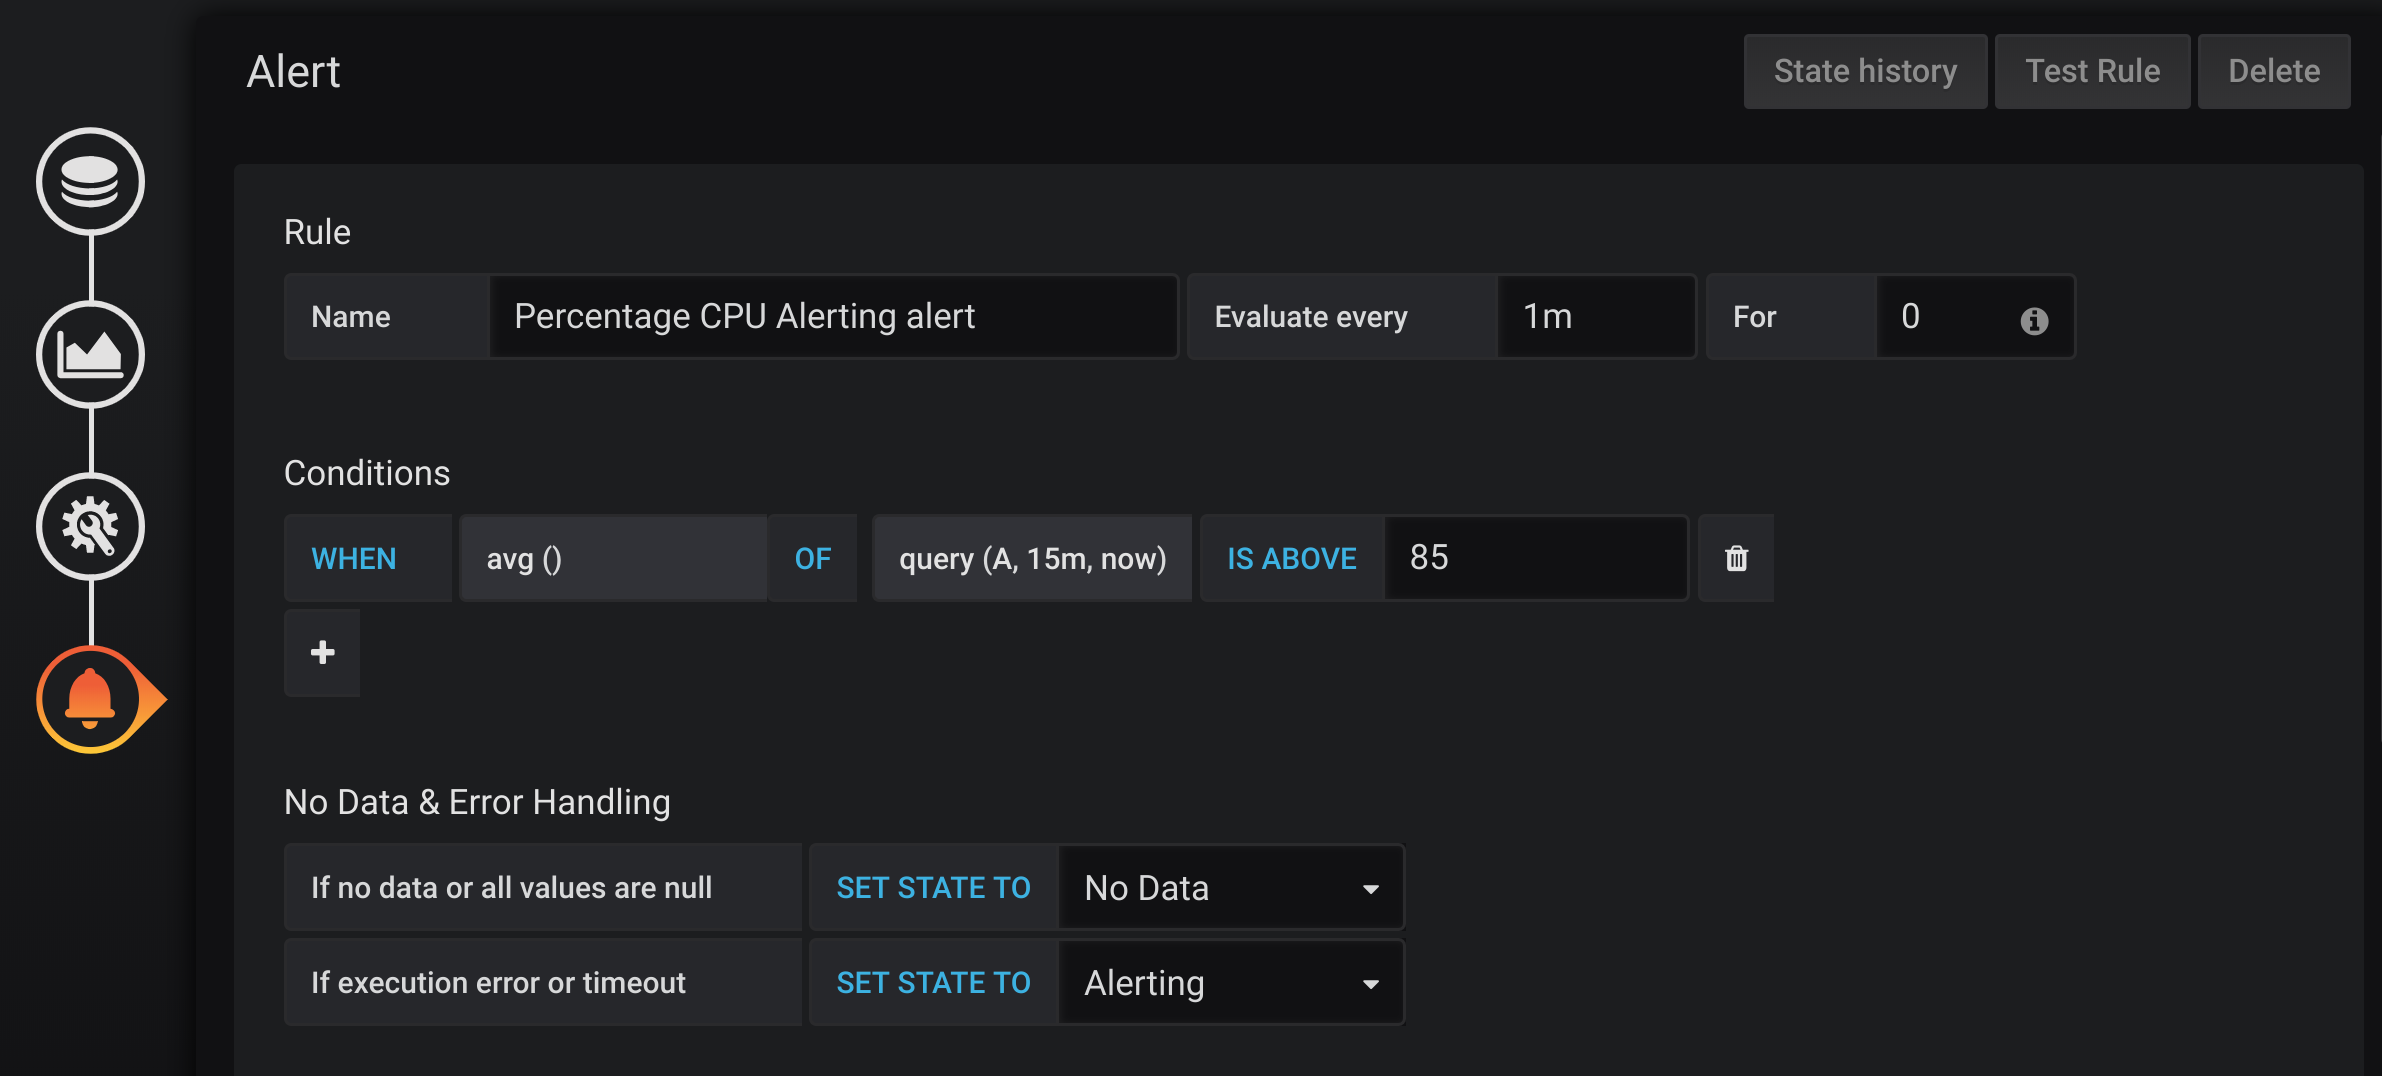
Grafana alerting is supported for the Azure Monitor service. This is not Azure Alerts support. For more information about Grafana alerting, refer to how alerting in Grafana works.
Query the Application Insights Service

As of Grafana 7.1, you can select more than one group by dimension.
Formatting legend keys with aliases for Application Insights
The default legend formatting is:
metricName{dimensionName=dimensionValue,dimensionTwoName=DimensionTwoValue}
In the Legend Format field, the aliases which are defined below can be combined any way you want.
Application Insights examples:
city: {{ client/city }}{{ metric }} [Location: {{ client/countryOrRegion }}, {{ client/city }}]
Alias patterns for Application Insights
{{ groupbyvalue }}= Legacy as of 7.1+ (for backwards compatibility) replaced with the first dimension’s key/label (as sorted by the key/label){{ groupbyname }}= Legacy as of 7.1+ (for backwards compatibility) replaced with first dimension’s value (as sorted by the key/label) (e.g. BlockBlob){{ metric }}= replaced with metric name (e.g. requests/count){{ arbitraryDim }}= Available in 7.1+ replaced with the value of the corresponding dimension. (e.g.{{ client/city }}becomes Chicago)
Filter expressions for Application Insights
The filter field takes an OData filter expression.
Examples:
client/city eq 'Boydton'client/city ne 'Boydton'client/city ne 'Boydton' and client/city ne 'Dublin'client/city eq 'Boydton' or client/city eq 'Dublin'
Templating with variables for Application Insights
Use the one of the following queries in the Query field in the Variable edit view.
Check out the Templating documentation for an introduction to the templating feature and the different types of template variables.
| Name | Description |
|---|---|
AppInsightsMetricNames() | Returns a list of metric names. |
AppInsightsGroupBys(aMetricName) | Returns a list of “group bys” for the specified metric name. |
Examples:
- Metric Names query:
AppInsightsMetricNames() - Passing in metric name variable:
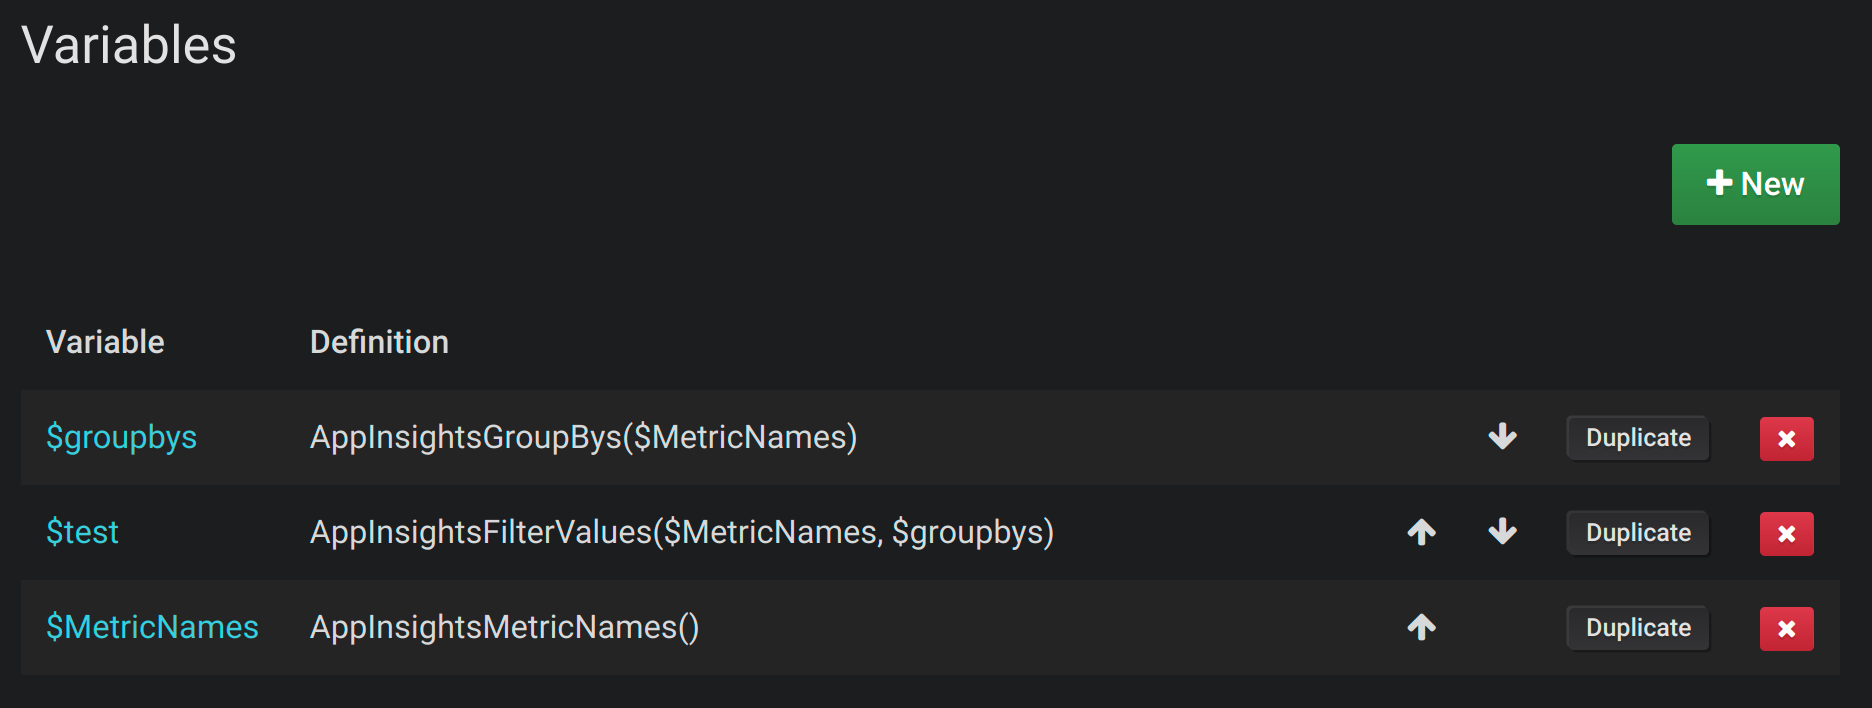
AppInsightsGroupBys(requests/count) - Chaining template variables:
AppInsightsGroupBys($metricnames)
Application Insights alerting
Grafana alerting is supported for Application Insights. This is not Azure Alerts support. For more information about Grafana alerting, refer to Alerts overview.

Querying the Azure Log Analytics service
Queries are written in the new Azure Log Analytics (or KustoDB) Query Language. A Log Analytics query can be formatted as time series data or as table data.
If your credentials give you access to multiple subscriptions, then choose the appropriate subscription before entering queries.
Time series queries
Time series queries are for the Graph panel and other panels like the SingleStat panel. Each query must contain at least a datetime column and a numeric value column. The result must also be sorted in ascending order by the datetime column.
Here is an example query that returns the aggregated count grouped by hour:
Perf
| where $__timeFilter(TimeGenerated)
| summarize count() by bin(TimeGenerated, 1h)
| order by TimeGenerated asc
A query can also have one or more non-numeric/non-datetime columns, and those columns are considered dimensions and become labels in the response. For example, a query that returns the aggregated count grouped by hour, Computer, and the CounterName:
Perf
| where $__timeFilter(TimeGenerated)
| summarize count() by bin(TimeGenerated, 1h), Computer, CounterName
| order by TimeGenerated asc
You can also select additional number value columns (with, or without multiple dimensions). For example, getting a count and average value by hour, Computer, CounterName, and InstanceName:
Perf
| where $__timeFilter(TimeGenerated)
| summarize Samples=count(), ["Avg Value"]=avg(CounterValue)
    by bin(TimeGenerated, $__interval), Computer, CounterName, InstanceName
| order by TimeGenerated ascTip: In the above query, the Kusto syntax
Samples=count()and["Avg Value"]=...is used to rename those columns — the second syntax allowing for the space. This changes the name of the metric that Grafana uses, and as a result, things like series legends and table columns will match what you specify. HereSamplesis displayed instead of_count.

Table queries
Table queries are mainly used in the Table panel and show a list of columns and rows. This example query returns rows with the six specified columns:
AzureActivity
| where $__timeFilter()
| project TimeGenerated, ResourceGroup, Category, OperationName, ActivityStatus, Caller
| order by TimeGenerated desc
Format the display name for Log Analytics
The default display name format is:
metricName{dimensionName=dimensionValue,dimensionTwoName=DimensionTwoValue}
This can be customized by using the display name field option.
Azure Log Analytics macros
To make writing queries easier there are several Grafana macros that can be used in the where clause of a query:
$__timeFilter()- Expands toTimeGenerated ≥ datetime(2018-06-05T18:09:58.907Z) andTimeGenerated ≤ datetime(2018-06-05T20:09:58.907Z)where the from and to datetimes are from the Grafana time picker.$__timeFilter(datetimeColumn)- Expands todatetimeColumn ≥ datetime(2018-06-05T18:09:58.907Z) anddatetimeColumn ≤ datetime(2018-06-05T20:09:58.907Z)where the from and to datetimes are from the Grafana time picker.$__timeFrom()- Returns the From datetime from the Grafana picker. Example:datetime(2018-06-05T18:09:58.907Z).$__timeTo()- Returns the From datetime from the Grafana picker. Example:datetime(2018-06-05T20:09:58.907Z).$__escapeMulti($myVar)- is to be used with multi-value template variables that contain illegal characters. If$myVarhas the following two values as a string'\\grafana-vm\Network(eth0)\Total','\\hello!', then it expands to:@'\\grafana-vm\Network(eth0)\Total', @'\\hello!'. If using single value variables there is no need for this macro, simply escape the variable inline instead -@'\$myVar'.$__contains(colName, $myVar)- is to be used with multi-value template variables. If$myVarhas the value'value1','value2', it expands to:colName in ('value1','value2').If using the
Alloption, then check theInclude All Optioncheckbox and in theCustom all valuefield type in the following value:all. If$myVarhas valueallthen the macro will instead expand to1 == 1. For template variables with a lot of options, this will increase the query performance by not building a large “where..in” clause.
Azure Log Analytics builtin variables
There are also some Grafana variables that can be used in Azure Log Analytics queries:
$__interval- Grafana calculates the minimum time grain that can be used to group by time in queries. For more information about$__interval, refer to interval variables. It returns a time grain like5mor1hthat can be used in the bin function. E.g.summarize count() by bin(TimeGenerated, $__interval)
Templating with variables for Azure Log Analytics
Any Log Analytics query that returns a list of values can be used in the Query field in the Variable edit view. There is also one Grafana function for Log Analytics that returns a list of workspaces.
Refer to the Variables documentation for an introduction to the templating feature and the different types of template variables.
| Name | Description |
|---|---|
workspaces() | Returns a list of workspaces for the default subscription. |
workspaces(12345678-aaaa-bbbb-cccc-123456789aaa) | Returns a list of workspaces for the specified subscription (the parameter can be quoted or unquoted). |
Example variable queries:
| Query | Description |
|---|---|
subscriptions() | Returns a list of Azure subscriptions |
workspaces() | Returns a list of workspaces for default subscription |
workspaces("12345678-aaaa-bbbb-cccc-123456789aaa") | Returns a list of workspaces for a specified subscription |
workspaces("$subscription") | With template variable for the subscription parameter |
workspace("myWorkspace").Heartbeat | distinct Computer | Returns a list of Virtual Machines |
workspace("$workspace").Heartbeat | distinct Computer | Returns a list of Virtual Machines with template variable |
workspace("$workspace").Perf | distinct ObjectName | Returns a list of objects from the Perf table |
workspace("$workspace").Perf | where ObjectName == "$object" | distinct CounterName | Returns a list of metric names from the Perf table |
Example of a time series query using variables:
Perf
| where ObjectName == "$object" and CounterName == "$metric"
| where TimeGenerated >= $__timeFrom() and TimeGenerated <= $__timeTo()
| where  $__contains(Computer, $computer)
| summarize avg(CounterValue) by bin(TimeGenerated, $__interval), Computer
| order by TimeGenerated asc
Deep linking from Grafana panels to the Log Analytics query editor in Azure Portal
Only available in Grafana v7.0+.
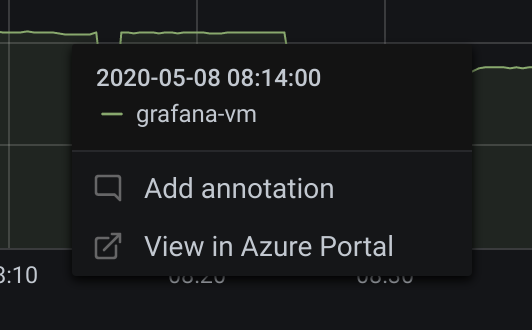
Click on a time series in the panel to see a context menu with a link to View in Azure Portal. Clicking that link opens the Azure Log Analytics query editor in the Azure Portal and runs the query from the Grafana panel there.
If you’re not currently logged in to the Azure Portal, then the link opens the login page. The provided link is valid for any account, but it only displays the query if your account has access to the Azure Log Analytics workspace specified in the query.
Azure Log Analytics alerting
Only available in Grafana v7.0+.
Grafana alerting is supported for Application Insights. This is not Azure Alerts support. Read more about how alerting in Grafana works in Alerting rules.
Query the Application Insights Analytics service
If you change the service type to Insights Analytics, then a similar editor to the Log Analytics service is available. This service also uses the Kusto language, so the instructions for querying data are identical to querying the log analytics service, except that you query Application Insights Analytics data instead.

Configure the data source with provisioning
It’s now possible to configure data sources using config files with Grafana’s provisioning system. You can read more about how it works and all the settings you can set for data sources on the provisioning docs page
Here are some provisioning examples for this data source.
# config file version
apiVersion: 1

datasources:
  - name: Azure Monitor
    type: grafana-azure-monitor-datasource
    access: proxy
    jsonData:
      appInsightsAppId: <app-insights-app-id>
      clientId: <client-id>
      cloudName: azuremonitor
      subscriptionId: <subscription-id>
      tenantId: <tenant-id>
      logAnalyticsClientId: <log-analytics-client-id>
      logAnalyticsDefaultWorkspace: <log-analytics-default-workspace>
      logAnalyticsSubscriptionId: <log-analytics-subscription-id>
      logAnalyticsTenantId: <log-analytics-tenant-id>
    secureJsonData:
      clientSecret: <client-secret>
      appInsightsApiKey: <app-insights-api-key>
      logAnalyticsClientSecret: <log-analytics-client-secret>
    version: 1
