Important: This documentation is about an older version. It's relevant only to the release noted, many of the features and functions have been updated or replaced. Please view the current version.
Share a panel
Note: Looking for prebuilt Grafana dashboards? Check out our full library of dashboards and more →
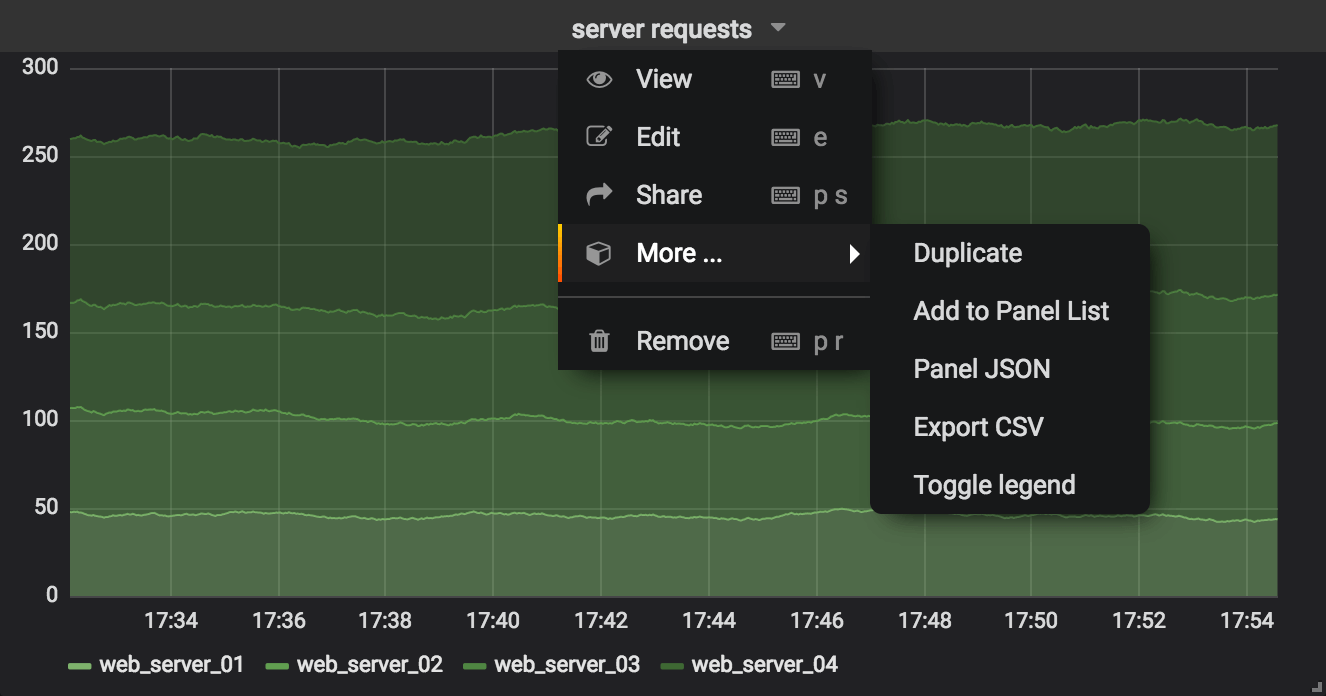
Click a panel title to open the panel menu, then click share in the panel menu to open the Share Panel dialog. Here you have access to a link that will take you to exactly this panel with the current time range and selected template variables. Below are ways to share a panel.
Direct Link Rendered Image
You also get a link to render a .png image of the panel, which is useful if you want to share an image of the panel. For more information about the requirements and how to configure image rendering, refer to [Image rendering](/docs/grafana/v7.2/administration/image_rendering/.
Example of a link to a server-side rendered PNG:
https://play.grafana.org/d/000000012/grafana-play-home?orgId=1&from=1568719680173&to=1568726880174&panelId=4&fullscreenQuery String Parameters For Server-Side Rendered Images
- width: width in pixels. Default is 800.
- height: height in pixels. Default is 400.
- tz: timezone in the format
UTC%2BHH%3AMMwhere HH and MM are offset in hours and minutes after UTC - timeout: number of seconds. The timeout can be increased if the query for the panel needs more than the default 30 seconds.
- scale: numeric value to configure device scale factor. Default is 1. Use a higher value to produce more detailed images (higher DPI). Supported in Grafana v7.0+.
Embed Panel
You can embed a panel using an iframe on another web site. This tab will show you the html that you need to use.
Note: This sharing requires allow_embedding enabled and anonymous access, or proper configuration of the cookie_samesite setting.
Example:
<iframe src="https://snapshot.raintank.io/dashboard-solo/snapshot/y7zwi2bZ7FcoTlB93WN7yWO4aMiz3pZb?from=1493369923321&to=1493377123321&panelId=4" width="650" height="300" frameborder="0"></iframe>Below there should be an interactive Grafana graph embedded in an iframe:
Export Panel Data

The submenu for a panel can be found by clicking on the title of a panel and then on the More submenu.
This menu contains two options for exporting data:
- The panel JSON (the specification and not the data) can be exported or updated via the panel context menu.
- Panel data can be exported in the CSV format for Table and Graph Panels.


