Important: This documentation is about an older version. It's relevant only to the release noted, many of the features and functions have been updated or replaced. Please view the current version.
Troubleshooting
This page lists some useful tools to help troubleshoot common Grafana issues.
Visualization and query issues

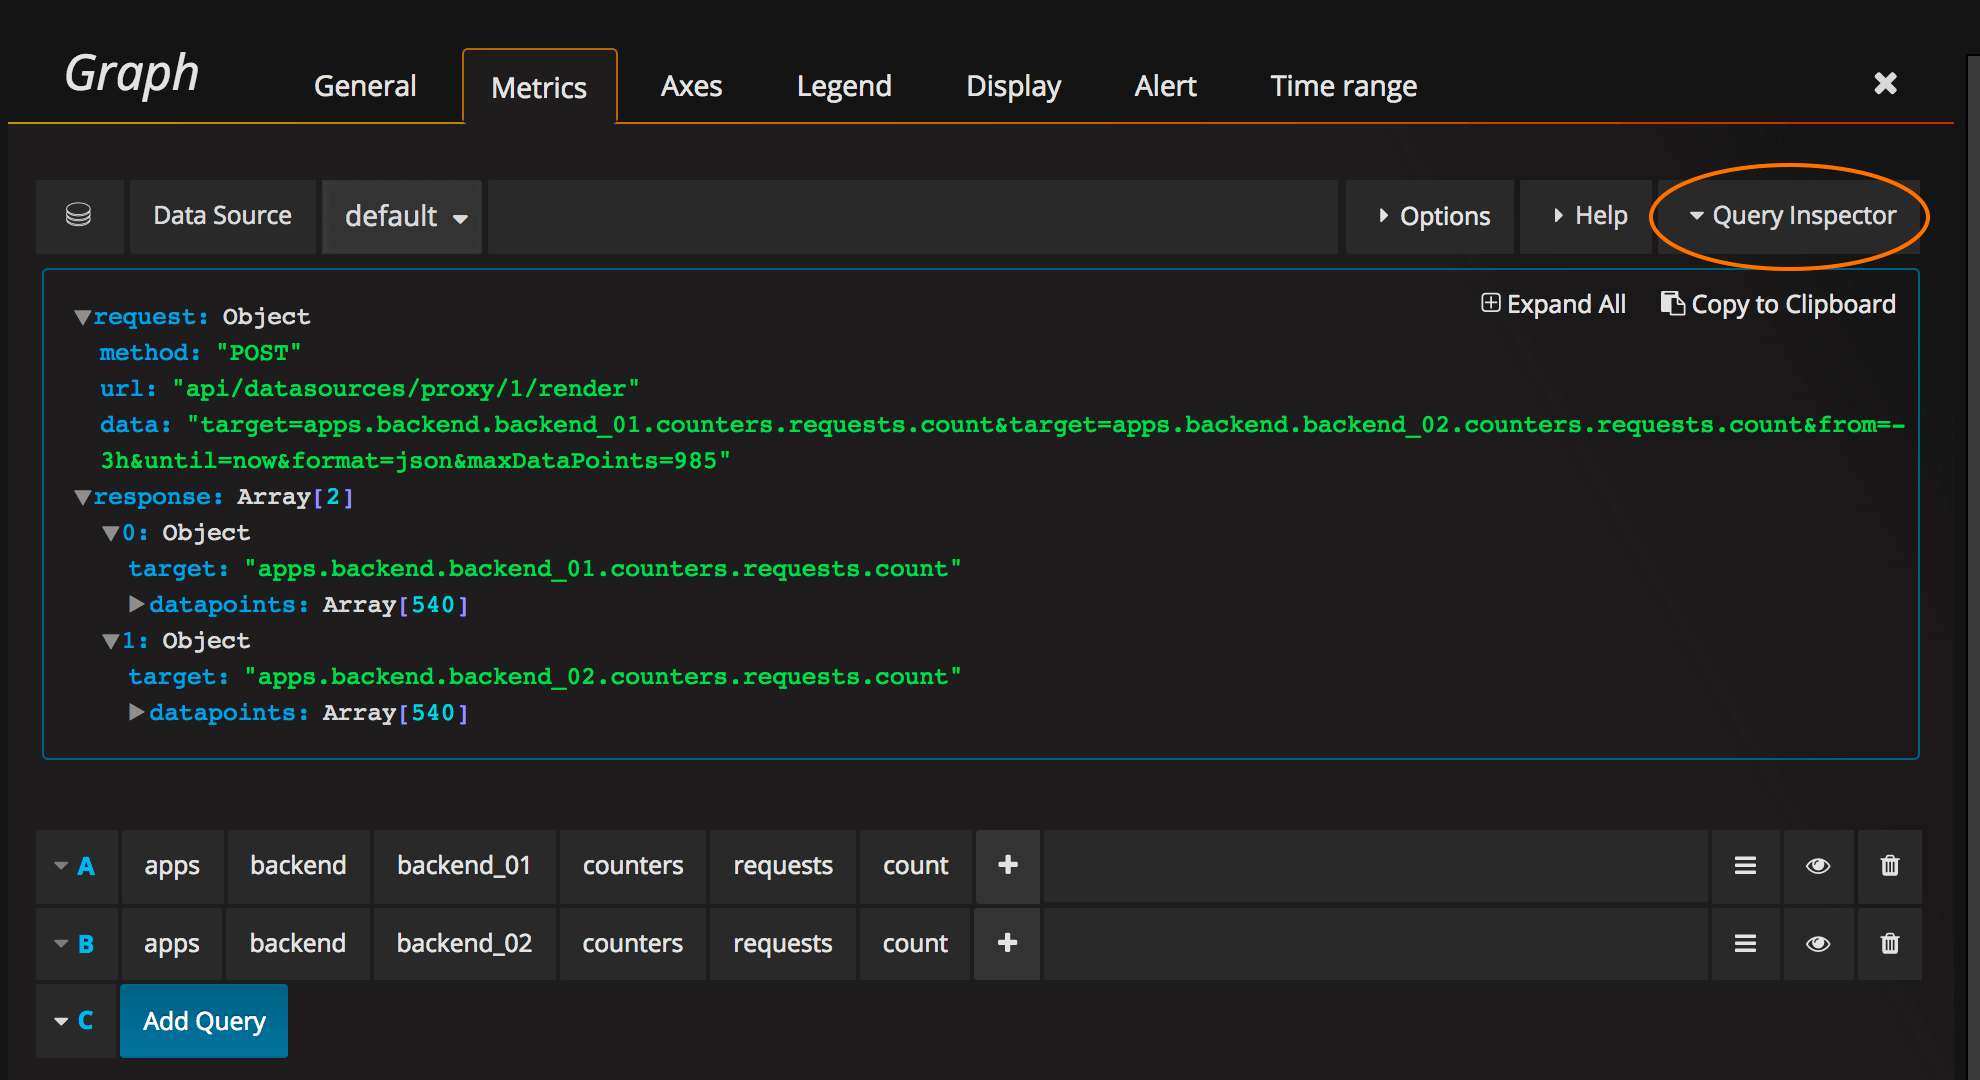
The most common problems are related to the query and response from your data source. Even if it looks like a bug or visualization issue in Grafana, it is almost always a problem with the data source query or the data source response.
To check this you should use query inspector, which was added in Grafana 4.5. The query inspector shows query requests and responses. Refer to the data source page for more information.
For more on the query inspector read the Grafana Community article Using Grafana’s Query Inspector to troubleshoot issues. For older versions of Grafana, refer to the How troubleshoot metric query issue article.
Logging
If you encounter an error or problem, then you can check the Grafana server log. Usually located at /var/log/grafana/grafana.log on Unix systems or in <grafana_install_dir>/data/log on other platforms and manual installations.
You can enable more logging by changing log level in the Grafana configuration file.
Diagnostics
The grafana-server process can be instructed to enable certain diagnostics when it starts. This can be helpful
when investigating certain performance problems. It’s not recommended to have these enabled by default.
Profiling
The grafana-server can be started with the arguments -profile to enable profiling and -profile-port to override
the default HTTP port (6060) where the pprof debugging endpoints will be available, e.g.
./grafana-server -profile -profile-port=8080Note that pprof debugging endpoints are served on a different port than the Grafana HTTP server.
You can configure or override profiling settings using environment variables:
export GF_DIAGNOSTICS_PROFILING_ENABLED=true
export GF_DIAGNOSTICS_PROFILING_PORT=8080
Refer to Go command pprof for more information about how to collect and analyze profiling data.
Server side image rendering (RPM-based Linux)
Server side image (png) rendering is a feature that is optional but very useful when sharing visualizations, for example in alert notifications.
If the image is missing text make sure you have font packages installed.
sudo yum install fontconfig
sudo yum install freetype*
sudo yum install urw-fonts
Tracing
The grafana-server can be started with the arguments -tracing to enable tracing and -tracing-file to override the default trace file (trace.out) where trace result is written to. For example:
./grafana-server -tracing -tracing-file=/tmp/trace.outYou can configure or override profiling settings using environment variables:
export GF_DIAGNOSTICS_TRACING_ENABLED=true
export GF_DIAGNOSTICS_TRACING_FILE=/tmp/trace.out
View the trace in a web browser (Go required to be installed):
go tool trace <trace file>
2019/11/24 22:20:42 Parsing trace...
2019/11/24 22:20:42 Splitting trace...
2019/11/24 22:20:42 Opening browser. Trace viewer is listening on http://127.0.0.1:39735
See Go command trace for more information about how to analyze trace files.
FAQs
Check out the FAQ section on the Grafana Community page for answers to frequently asked questions.


