Important: This documentation is about an older version. It's relevant only to the release noted, many of the features and functions have been updated or replaced. Please view the current version.
What’s new in Grafana v6.3
For all details please read the full CHANGELOG.md.
Highlights
- New Explore features
- Data links
- New Time Picker
- Graph Area Gradients - A new graph display option!
- Grafana Enterprise
- LDAP Active Sync - LDAP Active Sync
- SAML Authentication - SAML Authentication
Explore improvements
This release adds a ton of enhancements to Explore. Both in terms of new general enhancements but also in new data source specific features.
Loki live streaming
For log queries using the Loki data source you can now stream logs live directly to the Explore UI.
Loki context queries
After finding a log line through the heavy use of query filters it can then be useful to
see the log lines surrounding the line your searched for. The show context feature
allows you to view lines before and after the line of interest.
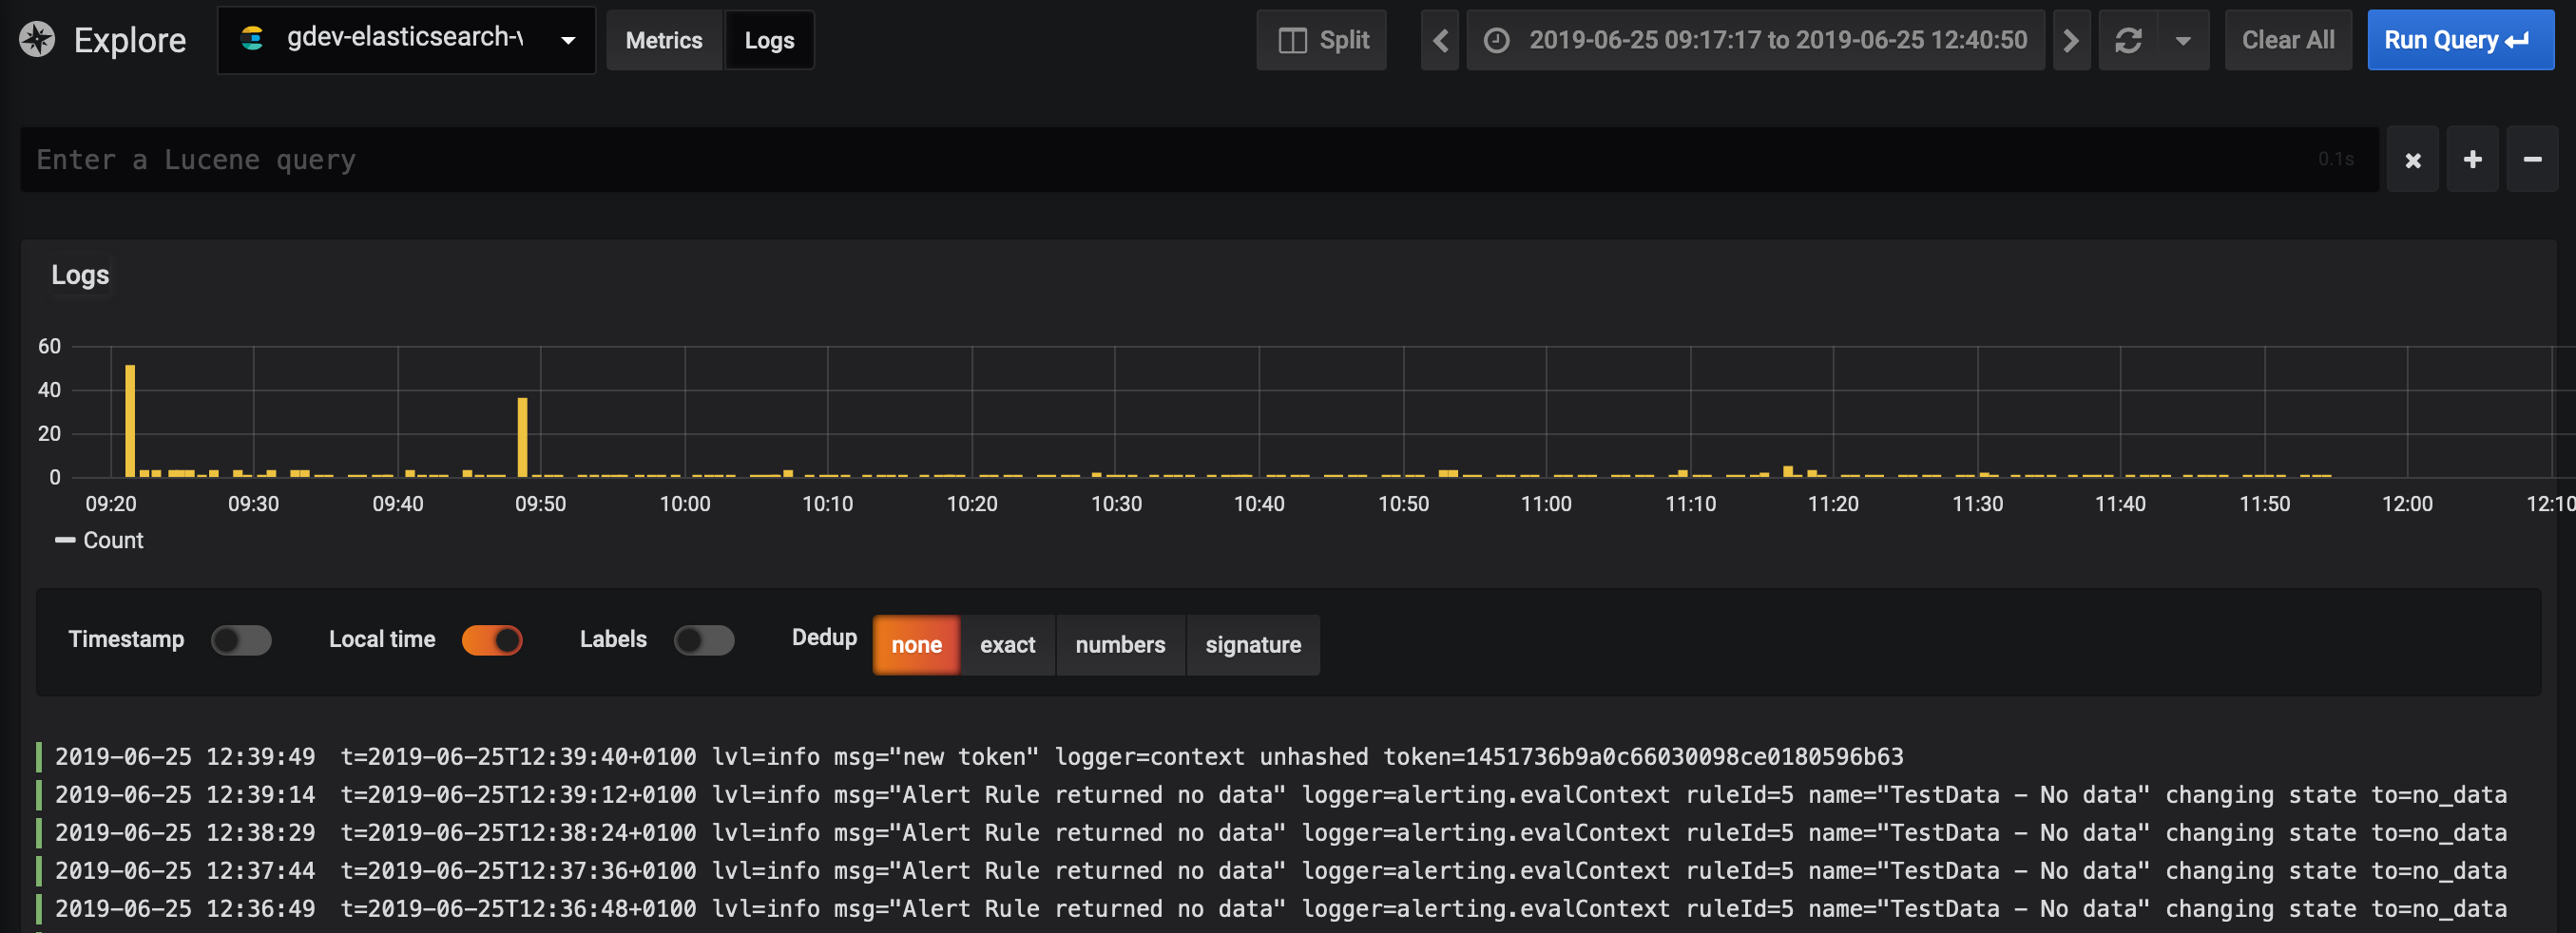
Elasticsearch logs support
This release adds support for searching and visualizing logs stored in Elasticsearch in the Explore mode. With a special simplified query interface specifically designed for logs search.

Please read Using Elasticsearch in Grafana for more detailed information on how to get started and use it.
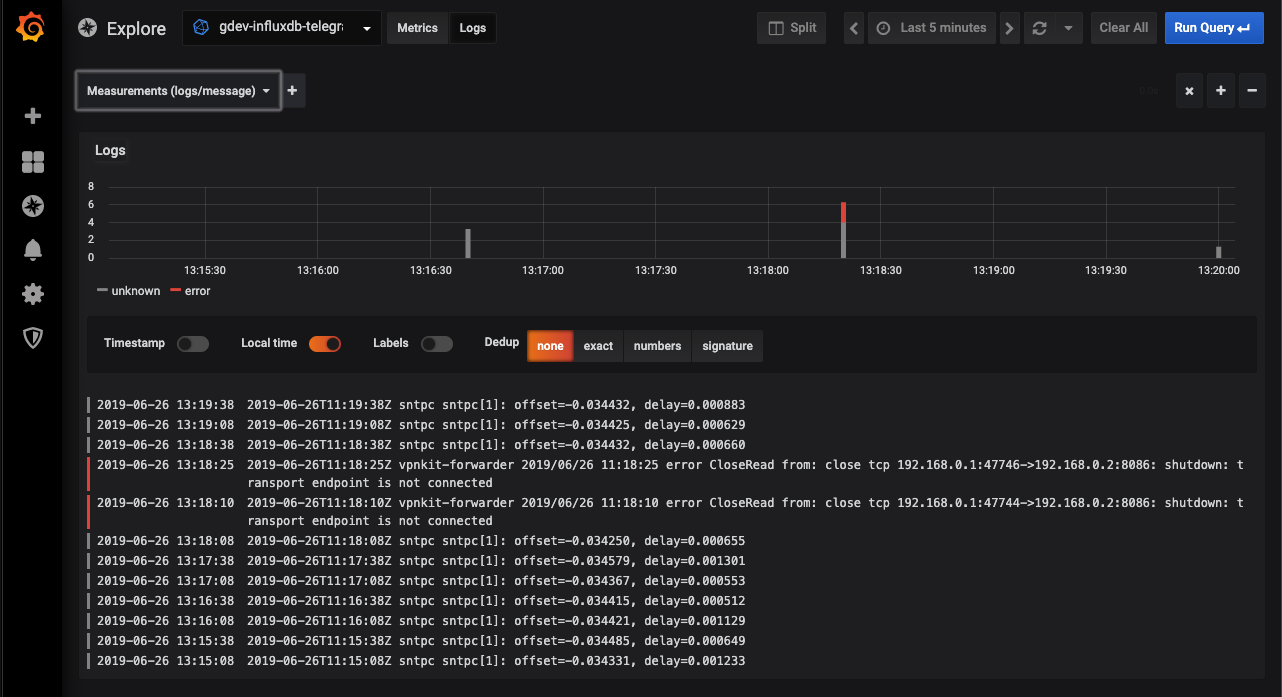
InfluxDB logs support
This release adds support for searching and visualizing logs stored in InfluxDB in the Explore mode. With a special simplified query interface specifically designed for logs search.

Please read Using InfluxDB in Grafana for more detailed information on how to get started and use it.
Data Links
We have simplified the UI for defining panel drilldown links (and renamed them to Panel links). We have also added a
new type of link named Data link. The reason to have two different types is to make it clear how they are used
and what variables you can use in the link. Panel links are only shown in the top left corner of
the panel and you cannot reference series name or any data field.
While Data links are used by the actual visualization and can reference data fields.
Example:
http://my-grafana.com/d/bPCI6VSZz/other-dashboard?var-server=${__series_name}You have access to these variables:
| Name | Description |
|---|---|
| ${__series_name} | The name of the time series (or table) |
| ${__value_time} | The time of the point your clicking on (in millisecond epoch) |
| ${__url_time_range} | Interpolates as the full time range (i.e. from=21312323412&to=21312312312) |
| ${__all_variables} | Adds all current variables (and current values) to the URL |
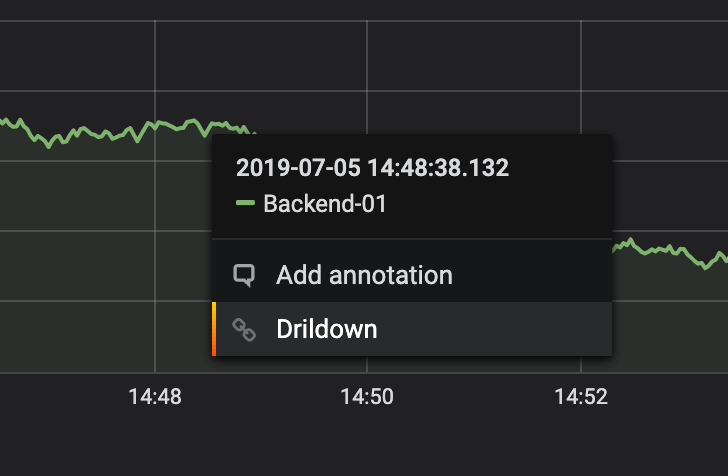
You can then click on point in the Graph.

For now only the Graph panel supports Data links but we hope to add these to many visualizations.
New Time Picker
The time picker has been re-designed and with a more basic design that makes accessing quick ranges more easy.

Graph Gradients
Want more eye candy in your graphs? Then the fill gradient option might be for you! Works really well for graphs with only a single series.

Looks really nice in light theme as well.

Grafana Enterprise
Substantial refactoring and improvements to the external auth systems has gone in to this release making the features listed below possible as well as laying a foundation for future enhancements.
LDAP Active Sync
This is a new Enterprise feature that enables background syncing of user information, org role and teams memberships. This syncing is otherwise only done at login time. With this feature you can schedule how often this user synchronization should occur.
For example, lets say a user is removed from an LDAP group. In previous versions of Grafana an admin would have to wait for the user to logout or the session to expire for the Grafana permissions to update, a process that can take days.
With active sync the user would be automatically removed from the corresponding team in Grafana or even logged out and disabled if no longer belonging to an LDAP group that gives them access to Grafana.
SAML Authentication
Built-in support for SAML is now available in Grafana Enterprise.
Team Sync for GitHub OAuth
When setting up OAuth with GitHub it’s now possible to sync GitHub teams with Teams in Grafana.
Team Sync for Auth Proxy
We’ve added support for enriching the Auth Proxy headers with Teams information, which makes it possible to use Team Sync with Auth Proxy.


