Important: This documentation is about an older version. It's relevant only to the release noted, many of the features and functions have been updated or replaced. Please view the current version.
What’s new in Grafana v6.0
This update to Grafana introduces a new way of exploring your data, support for log data, and tons of other features.
The main highlights are:
- Explore - A new query focused workflow for ad-hoc data exploration and troubleshooting.
- Grafana Loki - Integration with the new open source log aggregation system from Grafana Labs.
- Gauge Panel - A new standalone panel for gauges.
- New Panel Editor UX improves panel editing and enables easy switching between different visualizations.
- Google Stackdriver data source is out of beta and is officially released.
- Azure Monitor plugin is ported from being an external plugin to being a core data source
- React Plugin support enables an easier way to build plugins.
- Named Colors in our new improved color picker.
- Removal of user session storage makes Grafana easier to deploy and improves security.
Explore

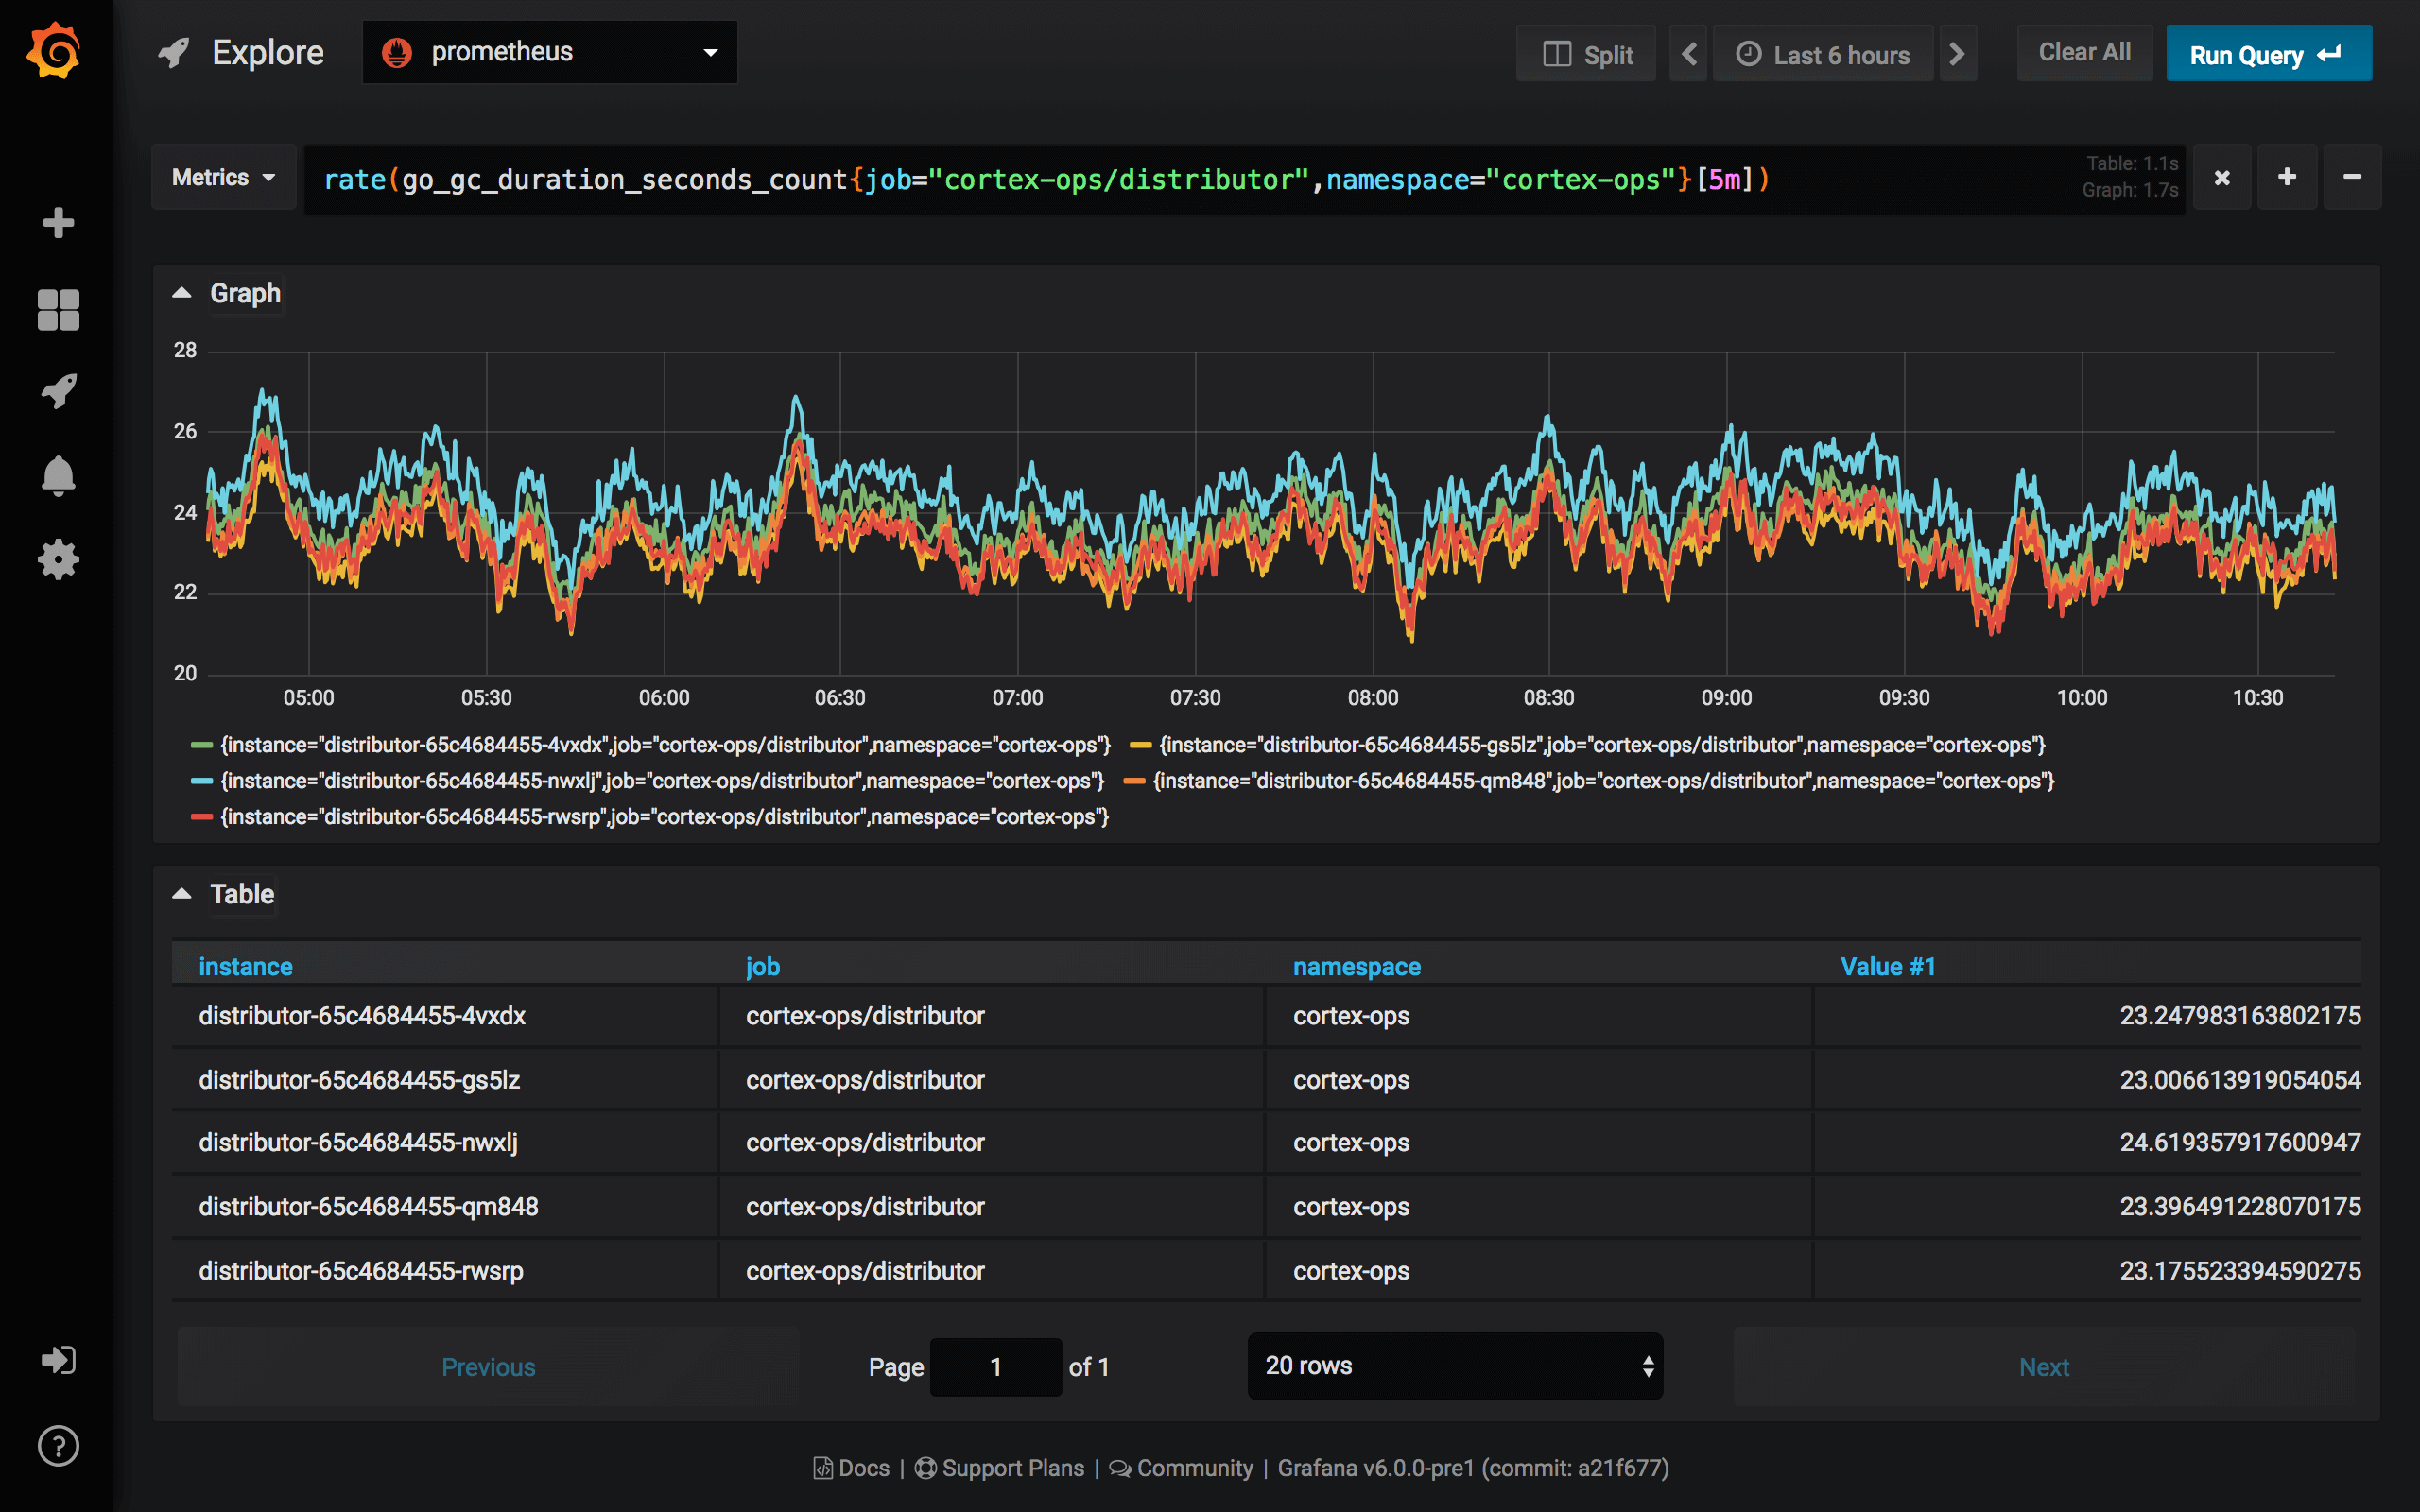
Grafana’s dashboard UI is all about building dashboards for visualization. Explore strips away all the dashboard and panel options so that you can focus on the query and metric exploration. Iterate until you have a working query and then think about building a dashboard. You can also jump from a dashboard panel into Explore and from there do some ad-hoc query exporation with the panel queries as a starting point.
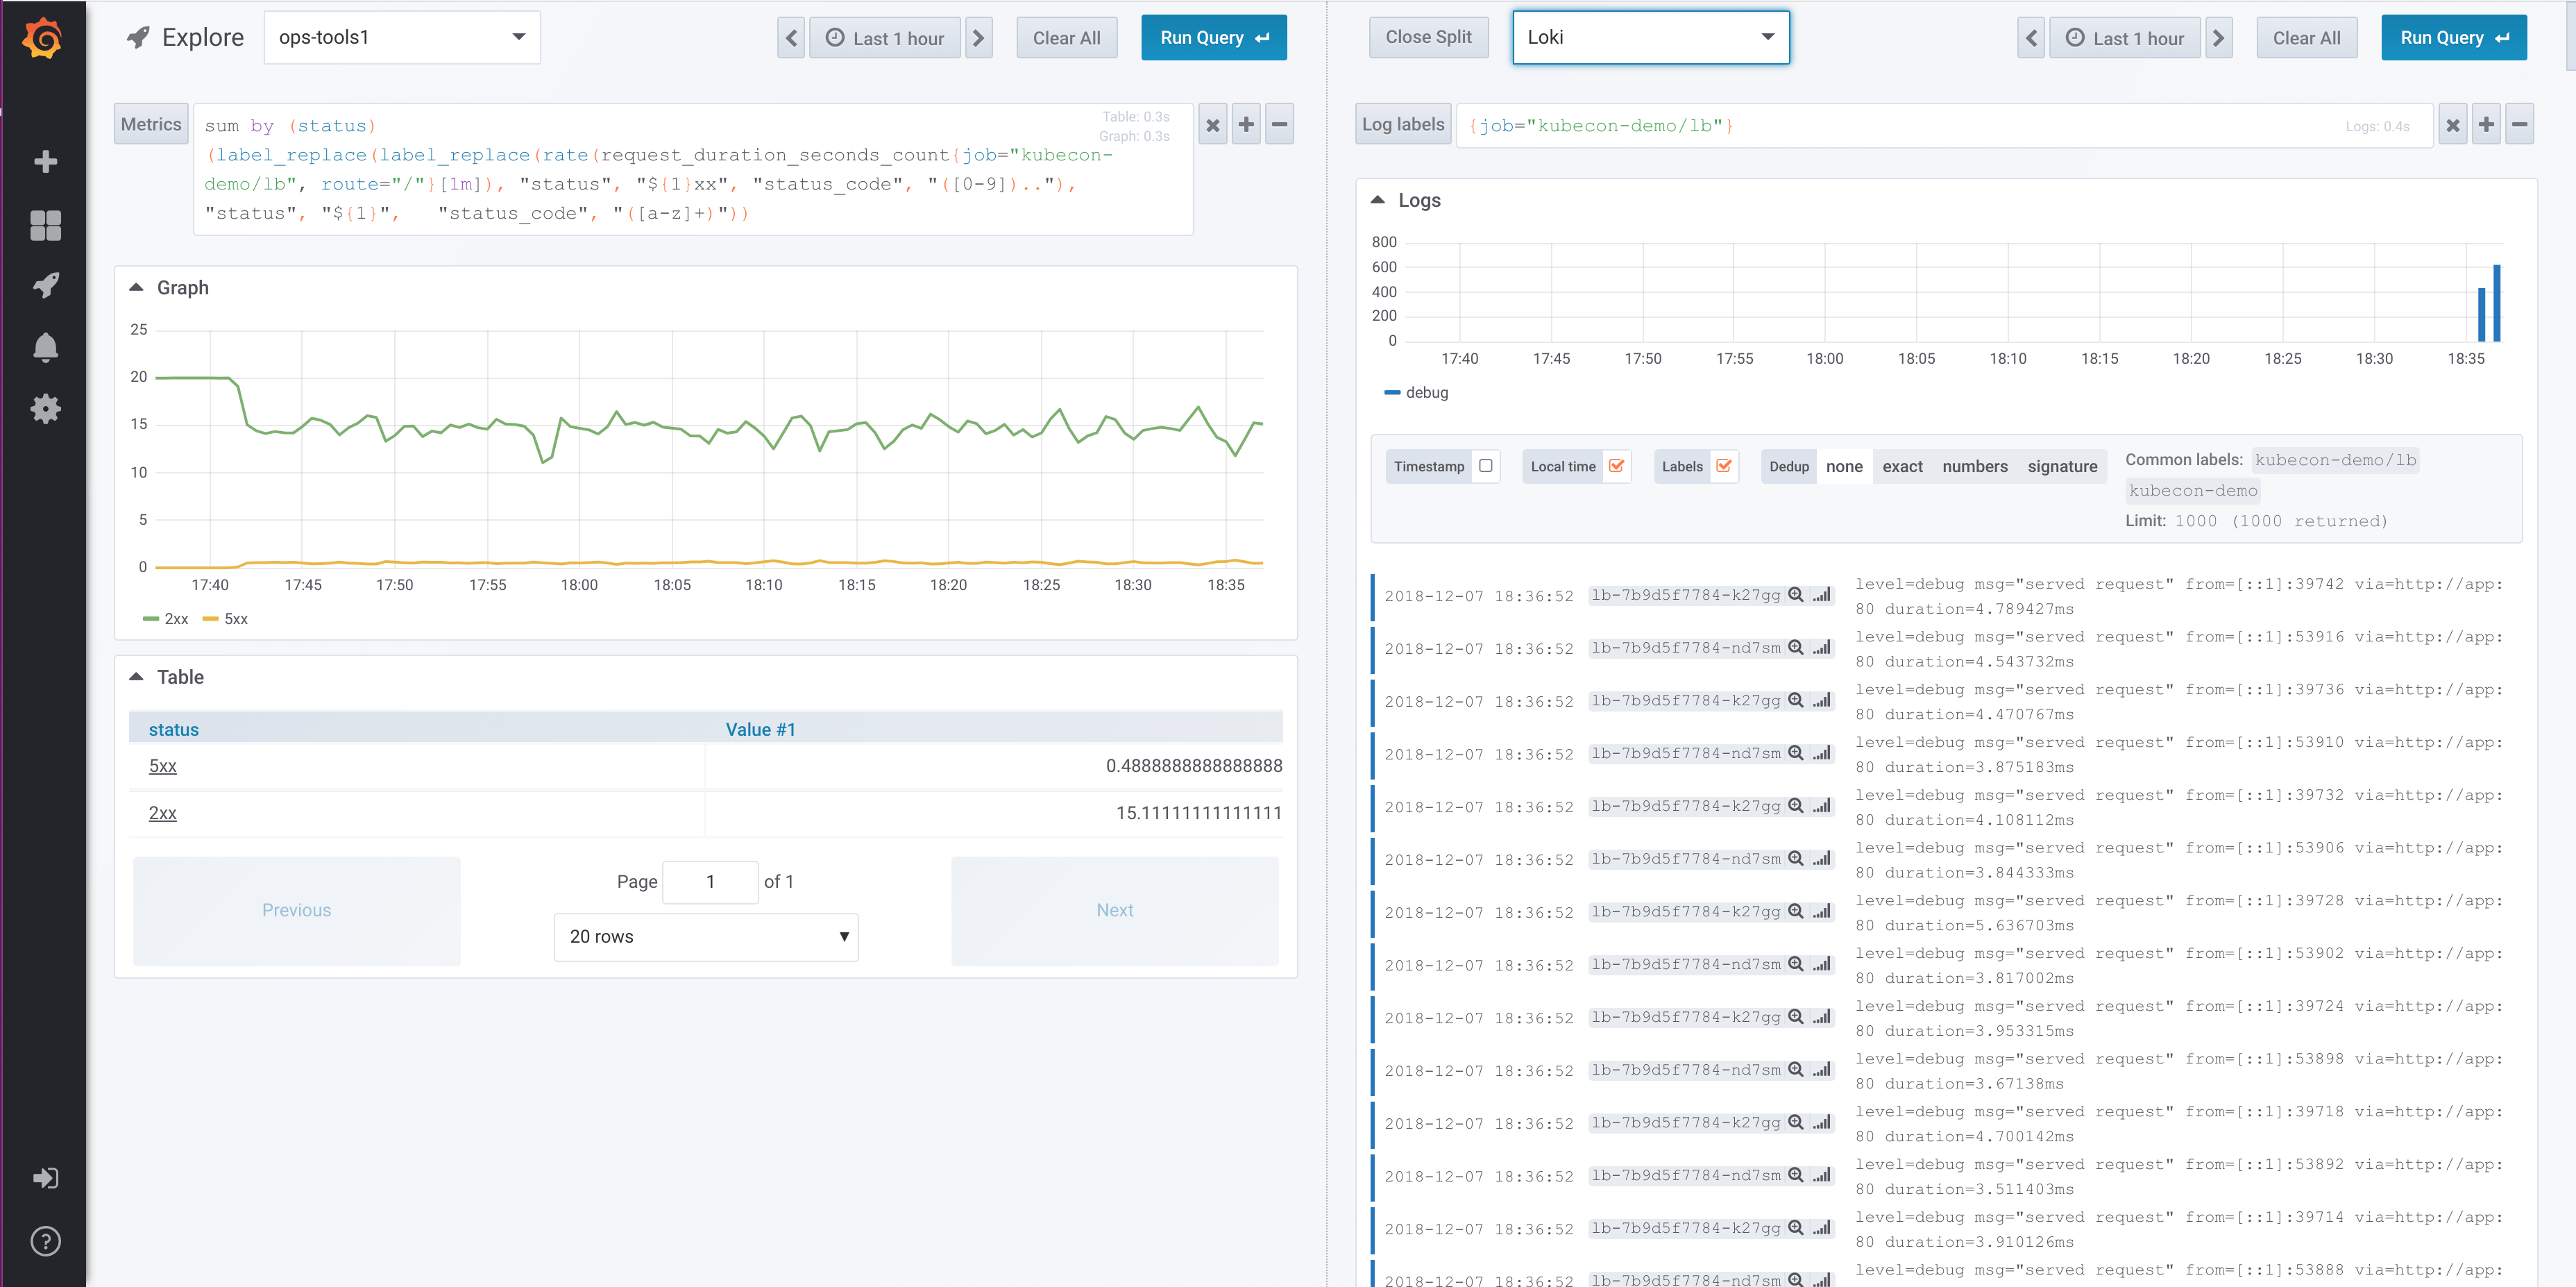
For infrastructure monitoring and incident response, you no longer need to switch to other tools to debug what went wrong. Explore allows you to dig deeper into your metrics and logs to find the cause. Grafana’s new logging data source, Loki is tightly integrated into Explore and allows you to correlate metrics and logs by viewing them side-by-side.
Explore is a new paradigm for Grafana. It creates a new interactive debugging workflow that integrates two pillars of observability—metrics and logs. Explore works with every data source but for Prometheus we have customized the query editor and the experience to provide the best possible exploration UX.
Explore and Prometheus
Explore features a new Prometheus query editor. This new editor has improved autocomplete, metric tree selector, integrations with the Explore table view for easy label filtering, and useful query hints that can automatically apply functions to your query. There is also integration between Prometheus and Grafana Loki (see more about Loki below) that enabled jumping between metrics query and logs query with preserved label filters.
Explore splits
Explore supports splitting the view so you can compare different queries, different data sources and metrics and logs side by side!

Explore and Grafana Loki
The log exploration and visualization features in Explore are available to any data source but are currently only implemented by the new open source log aggregation system from Grafana Lab called Grafana Loki.
Loki is a horizontally-scalable, highly-available, multi-tenant log aggregation system inspired by Prometheus. It is designed to be very cost effective, as it does not index the contents of the logs, but rather a set of labels for each log stream. The logs from Loki are queried in a similar way to querying with label selectors in Prometheus. It uses labels to group log streams which can be made to match up with your Prometheus labels.
Read more about Grafana Loki here or Grafana Labs hosted Loki.
The Explore feature allows you to query logs and features a new log panel. In the near future, we will be adding support for other log sources to Explore and the next planned integration is Elasticsearch.
New Panel Editor
Grafana v6.0 has a completely redesigned UX around editing panels. You can now resize the visualization area if you want more space for queries/options and vice versa. You can now also change visualization (panel type) from within the new panel edit mode. No need to add a new panel to try out different visualizations! Check out the video below to see the new Panel Editor in action.
Gauge Panel
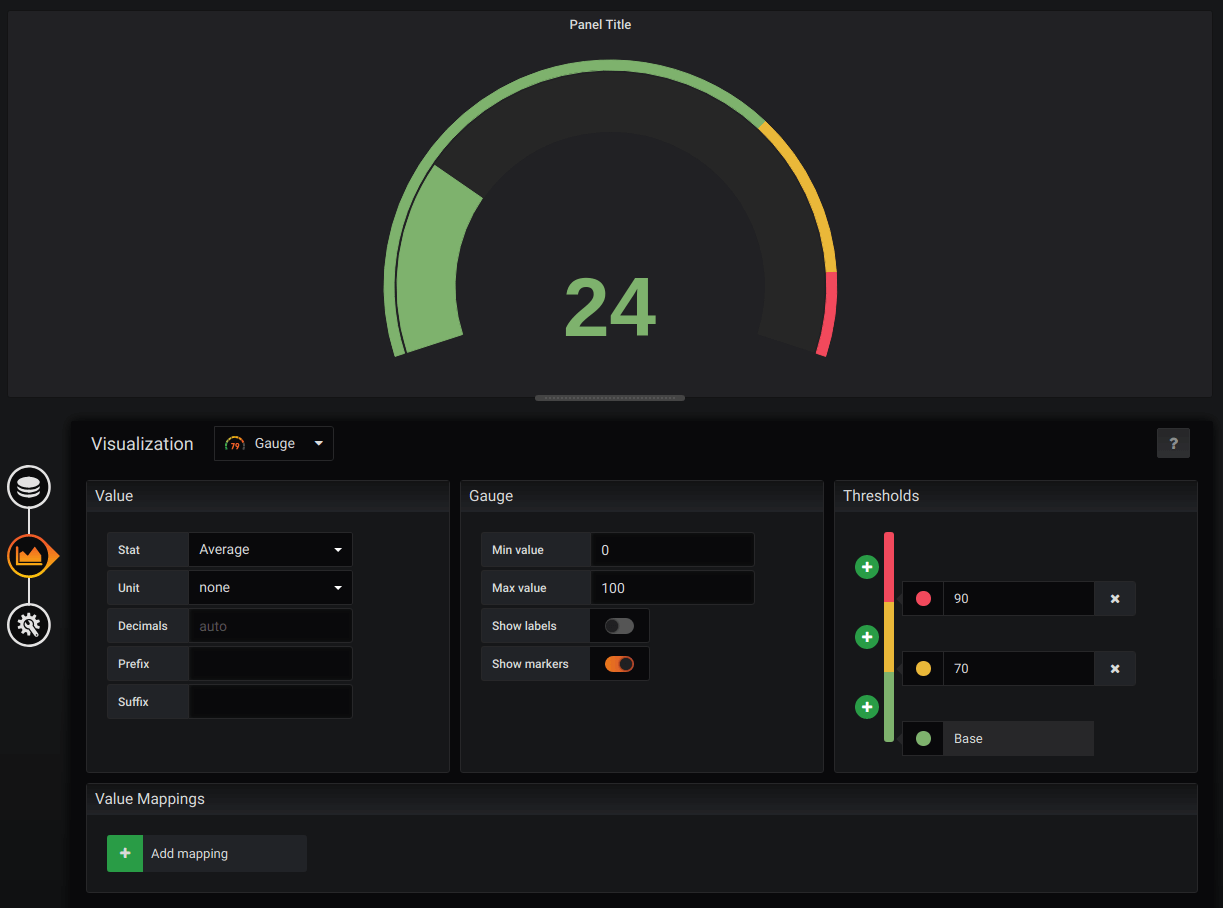
We have created a new separate Gauge panel as we felt having this visualization be a hidden option in the Singlestat panel was not ideal. When it supports 100% of the Singlestat Gauge features, we plan to add a migration so all singlestats that use it become Gauge panels instead. This new panel contains a new Threshold editor that we will continue to refine and start using in other panels.

React Panels and Query Editors
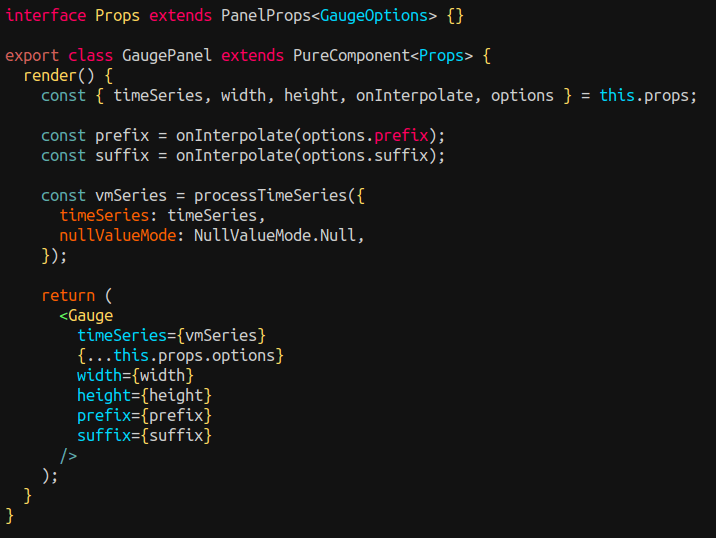
A major part of all the work that has gone into Grafana v6.0 has been on the migration to React. This investment
is part of the future-proofing of Grafana’s code base and ecosystem. Starting in v6.0 Panels and Data
source plugins can be written in React using our published @grafana/ui sdk library. More information on this
will be shared soon.
Google Stackdriver data source
Built-in support for Google Stackdriver is officially released in Grafana 6.0. Beta support was added in Grafana 5.3 and we have added lots of improvements since then.
To get started read the guide: Using Google Stackdriver in Grafana.
Azure Monitor data source
One of the goals of the Grafana v6.0 release is to add support for the three major clouds. Amazon CloudWatch has been a core data source for years and Google Stackdriver is also now supported. We developed an external plugin for Azure Monitor last year and for this release the plugin is being moved into Grafana to be one of the built-in data sources. For users of the external plugin, Grafana will automatically start using the built-in version. As a core data source, the Azure Monitor data source is able to get alerting support, in the 6.0 release alerting is supported for the Azure Monitor service, with the rest to follow.
The Azure Monitor data source integrates four Azure services with Grafana - Azure Monitor, Azure Log Analytics, Azure Application Insights and Azure Application Insights Analytics.
Please read Using Azure Monitor in Grafana documentation for more detailed information on how to get started and use it.
Provisioning support for alert notifiers
Grafana now has support for provisioning alert notifiers from configuration files, allowing operators to provision notifiers without using the UI or the API. A new field called uid has been introduced which is a string identifier that the administrator can set themselves. This is the same kind of identifier used for dashboards since v5.0. This feature makes it possible to use the same notifier configuration in multiple environments and refer to notifiers in dashboard json by a string identifier instead of the numeric id which depends on insert order and how many notifiers exist in the instance.
Easier to deploy and improved security
Grafana 6.0 removes the need to configure and set up additional storage for user sessions. This should make it easier to deploy and operate Grafana in a high availability setup and/or if you’re using a stateless user session store like Redis, Memcache, Postgres or MySQL.
Instead of user sessions, we’ve implemented a solution based on short-lived tokens that are rotated frequently. This also replaces the old “remember me cookie” solution, which allowed a user to be logged in between browser sessions and which have been subject to several security holes throughout the years. Read more about the short-lived token solution and how to configure it here.
Please note that due to these changes, all users will be required to login upon next visit after upgrade.
Besides these changes we have also made security improvements regarding Cross-Site Request Forgery (CSRF) and Cross-site Scripting (XSS) vulnerabilities:
- Cookies are per default using the SameSite attribute to protect against CSRF attacks
- Script tags in text panels are per default disabled to protect against XSS attacks
If you’re using Auth Proxy Authentication you still need to have user sessions set up and configured but our goal is to remove this requirement in the near future.
Named Colors

We have updated the color picker to show named colors and primary colors. We hope this will improve accessibility and helps making colors more consistent across dashboards. We hope to do more in this color picker in the future, like showing colors used in the dashboard.
Named colors also enables Grafana to adapt colors to the current theme.
Other features
- The ElasticSearch data source now supports bucket script pipeline aggregations. This gives the ability to do per-bucket computations like the difference or ratio between two metrics.
- Support for Google Hangouts Chat alert notifications
- New built in template variables for the current time range in
$__fromand$__to
Upgrading
See upgrade notes.
Changelog
Check out the CHANGELOG.md file for a complete list of new features, changes, and bug fixes.


