Grafana Pyroscope data source
Grafana Pyroscope is a horizontally scalable, highly available, multi-tenant, OSS, continuous profiling aggregation system. Add a Pyroscope data source to query your profiles in Explore.
Refer to Introduction to Pyroscope to understand profiling and Pyroscope.
To use profiling data, you should:
- Configure your application to send profiles
- Configure the Grafana Pyroscope data source.
- View and query profiling data using Explore Profiles or the query editor
Continuous profiling
While code profiling has been a long-standing practice, continuous profiling represents a modern and more advanced approach to performance monitoring.
This technique adds two critical dimensions to traditional profiles:
- Time
- Profiling data is collected continuously, providing a time-centric view that allows querying performance data from any point in the past.
- Metadata
- Profiles are enriched with metadata, adding contextual depth to the performance data.
These dimensions, coupled with the detailed nature of performance profiles, make continuous profiling a uniquely valuable tool.
Flame graphs
Flame graphs help you visualize resource allocation and performance bottlenecks, and you even get suggested recommendations and performance fixes via AI-driven flame graph analysis, as well as line-level insights from our GitHub integration.
On views with a flame graph, you can use Explain flame graph to provide an AI flame graph analysis that explains the performance bottleneck, root cause, and recommended fix. For more information, refer to Flame graph AI.
Integrate profiles into dashboards
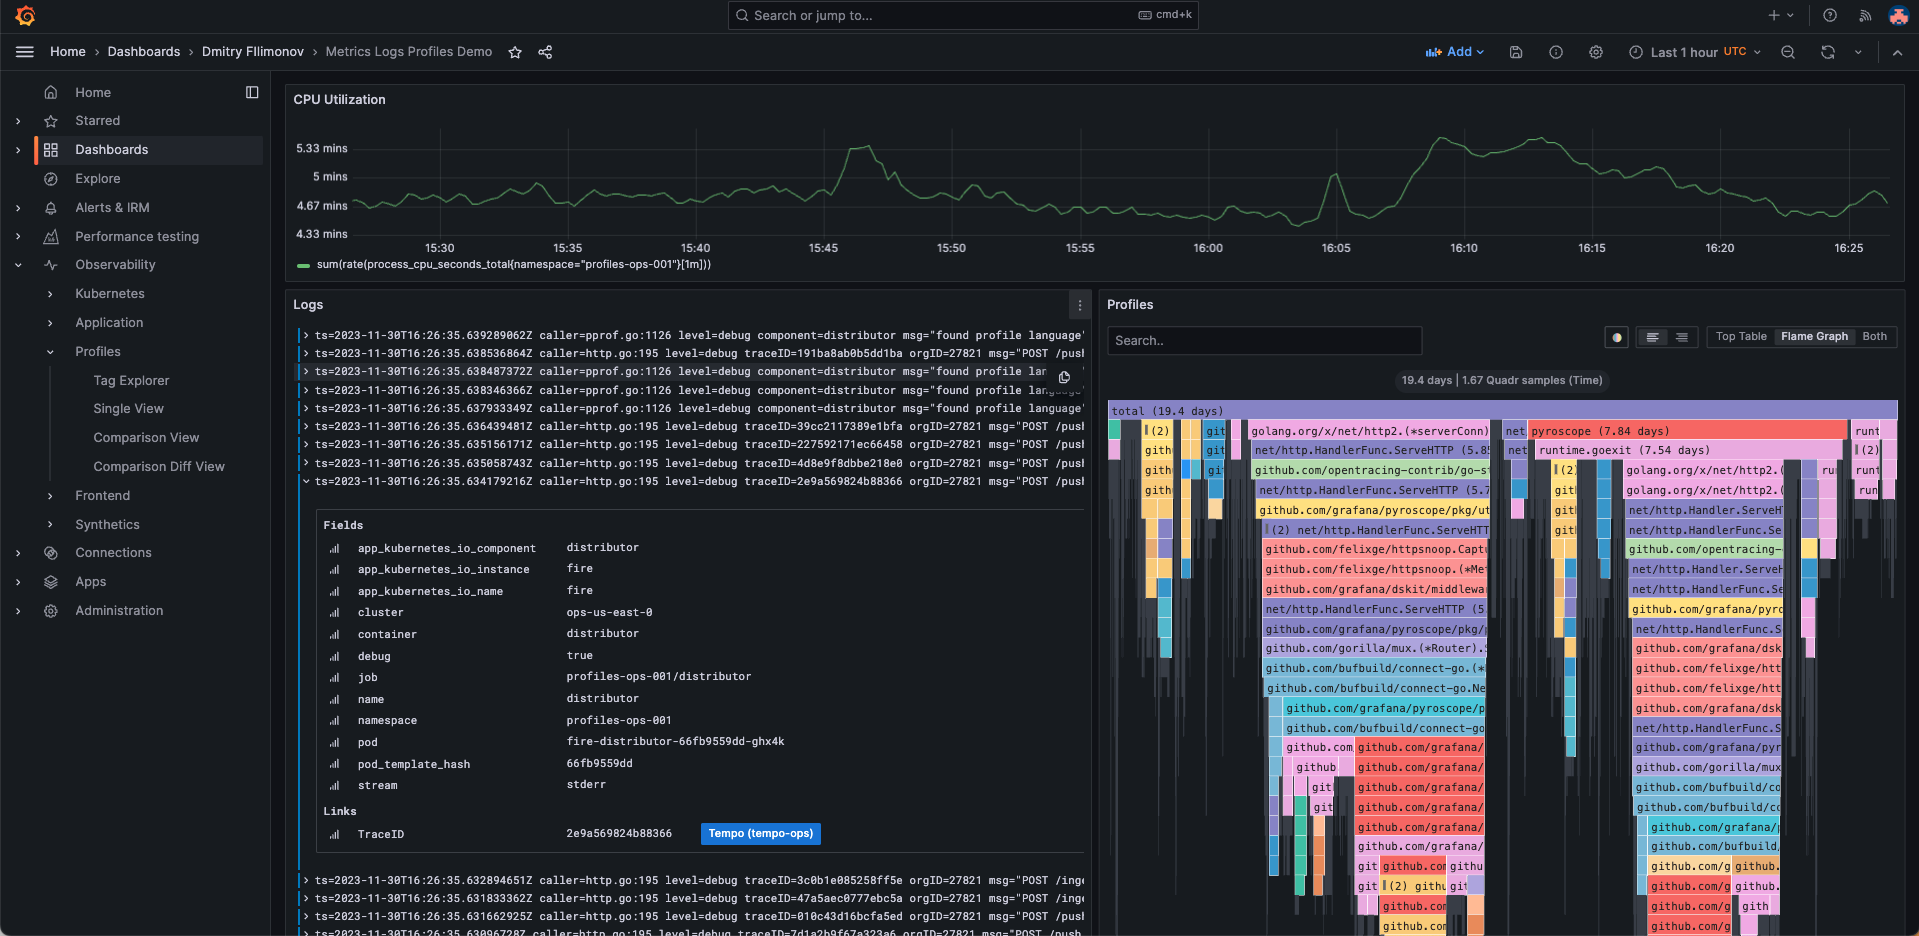
Using the Pyroscope data source, you can integrate profiles into your dashboards. For example, you can embed flame graphs using the flame graph panel.
In this case, the screenshot shows memory profiles alongside panels for logs and metrics to be able to debug out of memory (OOM) errors alongside the associated logs and metrics.

Visualize traces and profiles data using Traces to profiles
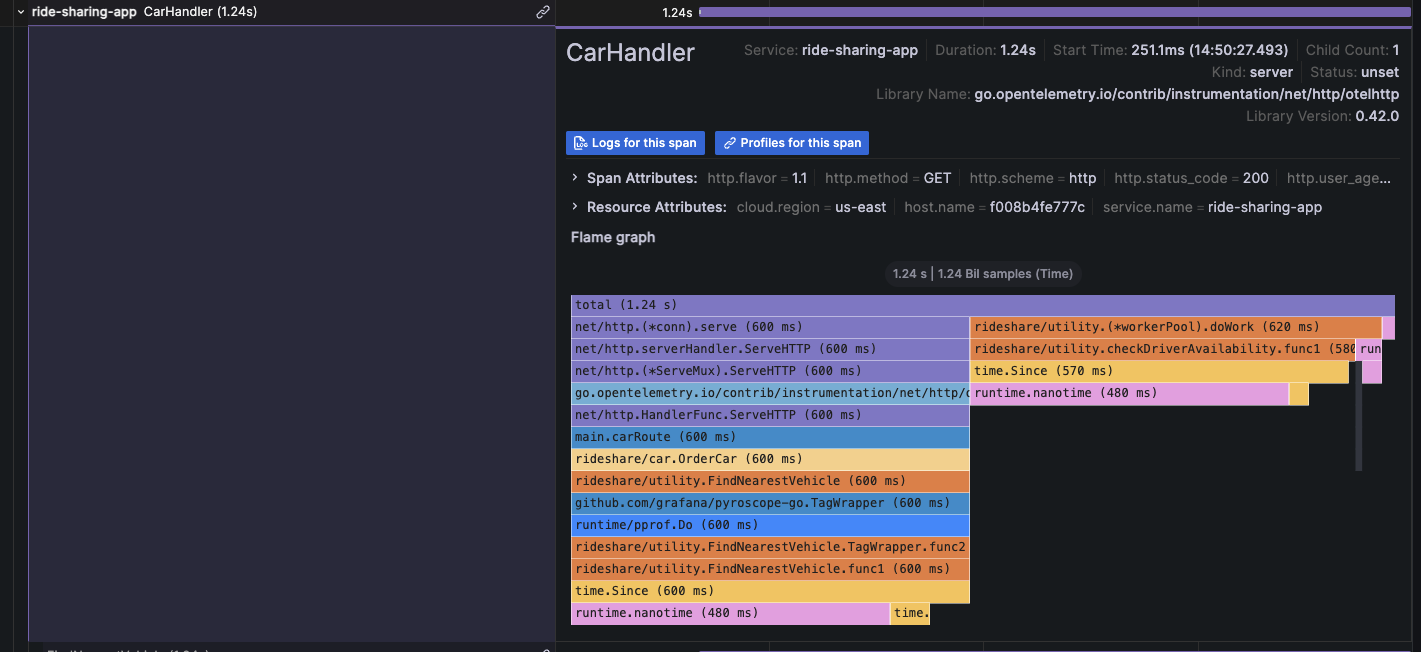
You can link profile and tracing data using your Pyroscope data source with the Tempo data source. To learn more about how profiles and tracing can work together, refer to Profiling and tracing synergies.
Combined traces and profiles let you see granular line-level detail when available for a trace span. This allows you pinpoint the exact function that’s causing a bottleneck in your application as well as a specific request.

For more information, refer to the Traces to profile section and Link tracing and profiling with span profiles.
Provision the Pyroscope data source
You can modify the Grafana configuration files to provision the Pyroscope data source. To learn more, and to view the available provisioning settings, refer to provisioning documentation.
Here is an example configuration:
apiVersion: 1

datasources:
  - name: Grafana Pyroscope
    type: grafana-pyroscope-datasource
    url: http://localhost:4040
    jsonData:
      minStep: '15s'


