Important: This documentation is about an older version. It's relevant only to the release noted, many of the features and functions have been updated or replaced. Please view the current version.
Get started with Grafana Logs Drilldown
The best way to see what Grafana Logs Drilldown can do for you is to use it to explore your own data. If you have a Grafana Cloud account, you can access Grafana Logs Drilldown by selecting Explore > Logs, or you can install Grafana Logs Drilldown in your own Grafana instance.
To learn more, check out our overview video:
Guided tour
We will walk through a simple step-by-step guided tour of Grafana Logs Drilldown.
While you are browsing your log data in Grafana Logs Drilldown, watch for any unexpected spikes in your logs. Or perhaps one of your services is down and has stopped logging. Maybe you’re seeing an increase in errors after a recent release.

To take a tour of Grafana Logs Drilldown, follow these steps:
- From the Grafana main menu, select Explore > Logs.
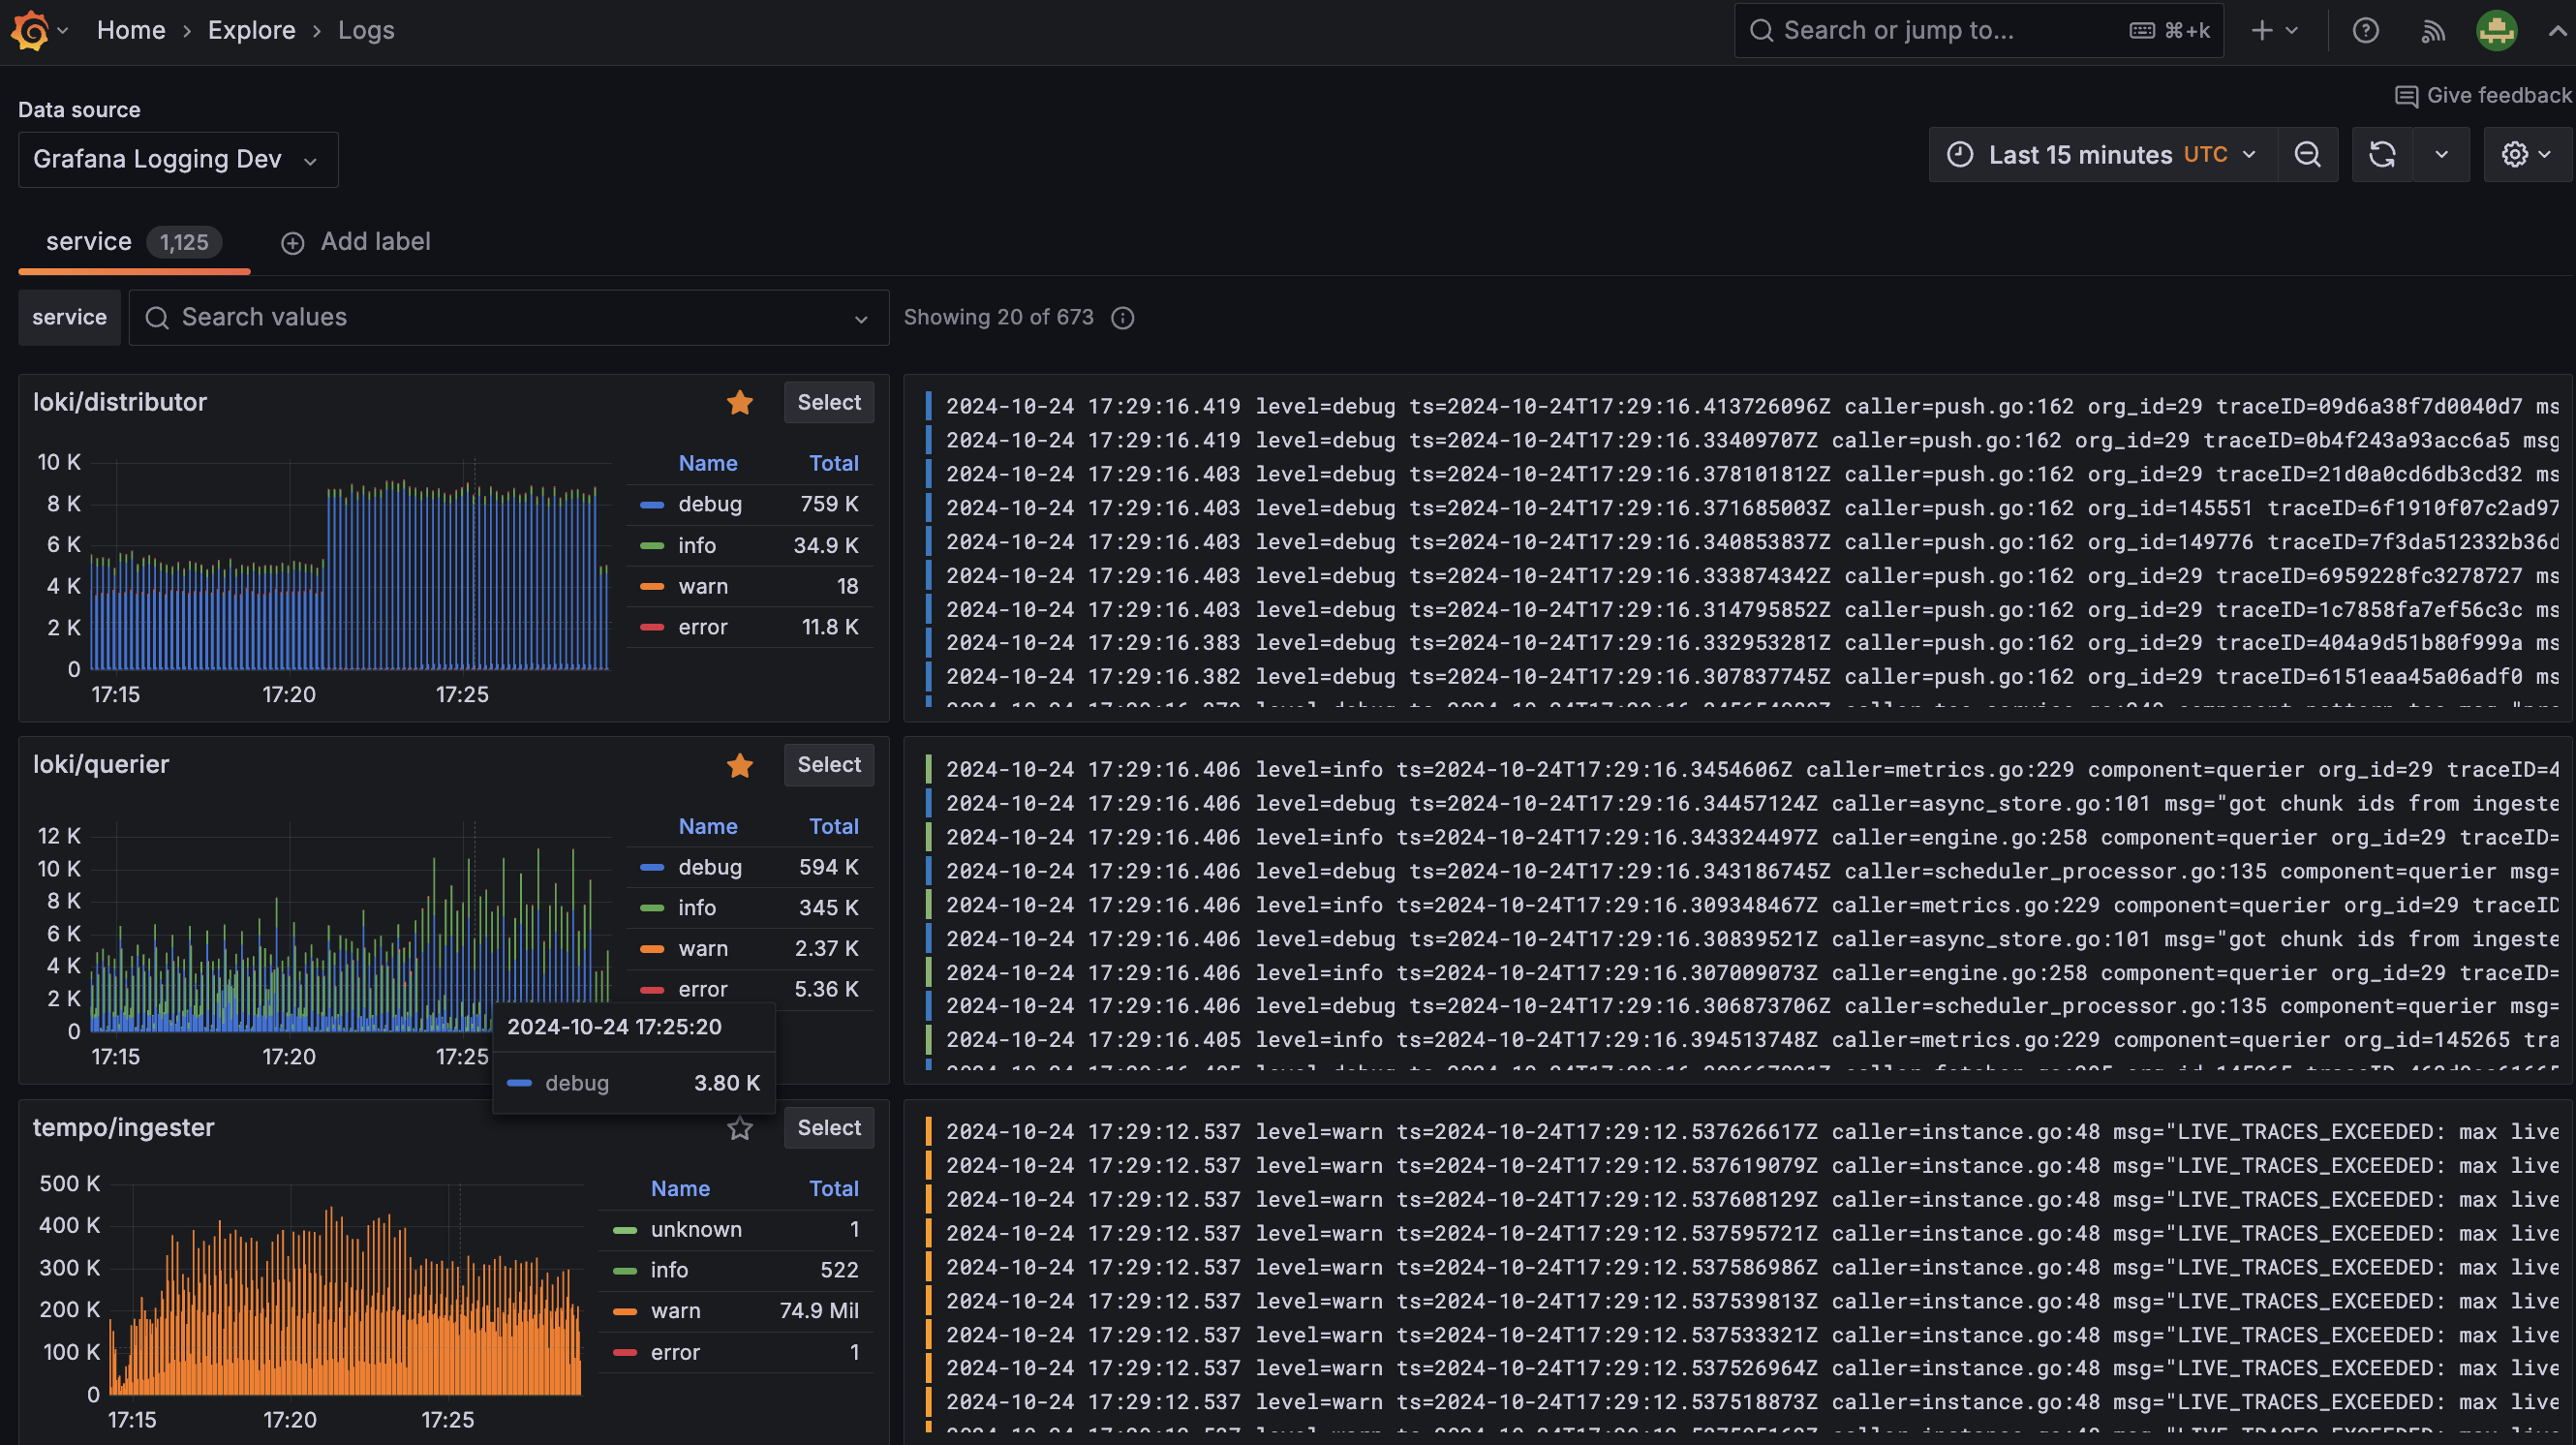
- This opens the Overview page showing time series and log visualizations for all the services in your selected Loki instance. (No services?)
- Change your Data source from the menu on the top left, then select a recent time range. You can modify your time range in two ways:
- With the standard time range picker on the top right.
- By clicking and dragging the time range on any time series visualization.
- Services are shown based on the volume of logs, or you can use the Search Services field to search for the service by name.
- To explore logs for a service, click the Select button on the service graph. New for version 1.0.2: You can now begin a workflow with any label, not just service, by clicking Add Label.
- On the service details page, click the Labels tab to see visualizations of the log volume for each label. (No labels?)
- On the Labels tab, select a label to see the log volume for each value of that label. Grafana Logs Drilldown shows you the volume of logs with specific labels and fields. Learn more about Labels and Fields.
- Select the Fields tab to see visualizations of the log volume for each field. You can select fields to drill down into the details in the same way as labels.
- Click the Patterns tab to see the log volume for each automatically detected pattern. Log patterns let you work with groups of similar log lines. You can hide log patterns that are noisy, or focus only on the patterns that are most useful. Learn more about Log Patterns.
If you’re having trouble using Logs Drilldown, refer to the troubleshooting page.
What do you think?
Please share your feedback and help make Logs Drilldown better.


