Important: This documentation is about an older version. It's relevant only to the release noted, many of the features and functions have been updated or replaced. Please view the current version.
What’s new in Grafana v8.2
Grafana 8.2 continues to build on the foundation of Grafana 8.0 & 8.1. Grafana 8.2 also marks the start of our work to bring Grafana closer to all users with a focus on increasing Grafana’s accessibility, part of its continuing mission to democratize metrics for everyone.
The plugin catalog is now on by default in Grafana 8.2. Using the plugin catalog you can now find and install official and community plugins without having to leave or restart Grafana. We’ve also updated the time picker to include configurable fiscal quarters. This update makes it easier to use Grafana to produce reports more closely aligned with common review and forecasting cycles.
Grafana Enterprise includes a revamped Stats and Licensing page, new role-based access control permissions, and improvements that make usage insights and reporting easier to access.
We’ve summarized what’s new in the release here, but you might also be interested in the announcement blog post. If you’d like all the details you can check out the release notes and complete CHANGELOG.md.
OSS
Community Contributions
Grafana 8.2 includes a number of important community contributions including support for OAuth role mapping with GitLab accounts (#30025), a new wide-to-long function (#38670) included in the prepare time series transformation. A number of additions to the Azure Monitor data source were submitted, including an overview dashboard(#38801) and support for parsing numeric fields in the Azure Resource Graph(#38728). Contributions also included regular-expression based value mapping (#38931) and improvements to our systemd unit for Grafana installations (#38109). This list is by no means exhaustive or comprehensive. We greatly appreciate all the contributions submitted for inclusion in Grafana.
Accessibility
We’ve taken our first, measured but important step towards improving the accessibility of Grafana, with much needed tweaks to keyboard navigation, accessibility labeling for UI elements for Grafana viewers, and an accessibility statement for Grafana laying out what you can expect from a Grafana focused on making our project accessible to all.
Dashboards
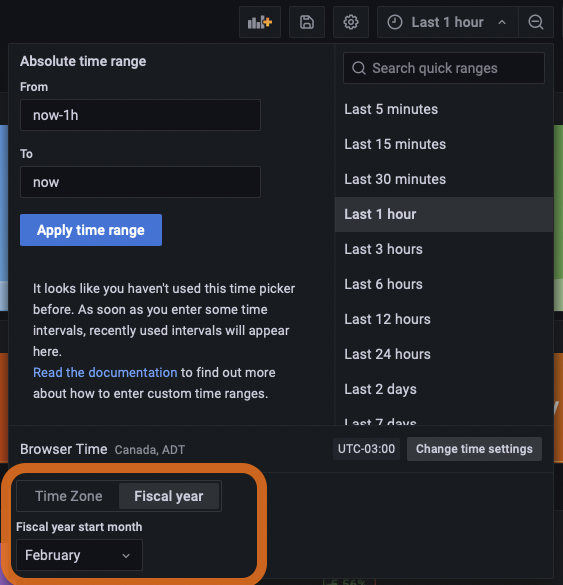
The biggest change to dashboards in Grafana 8.2 is the inclusion of a configurable fiscal year in the time picker. This option enables fiscal quarters as time ranges, which can be helpful for business-focused and executive dashboards in addition to many other common use cases. Please see the time range controls documentation for more information.
Plugins management
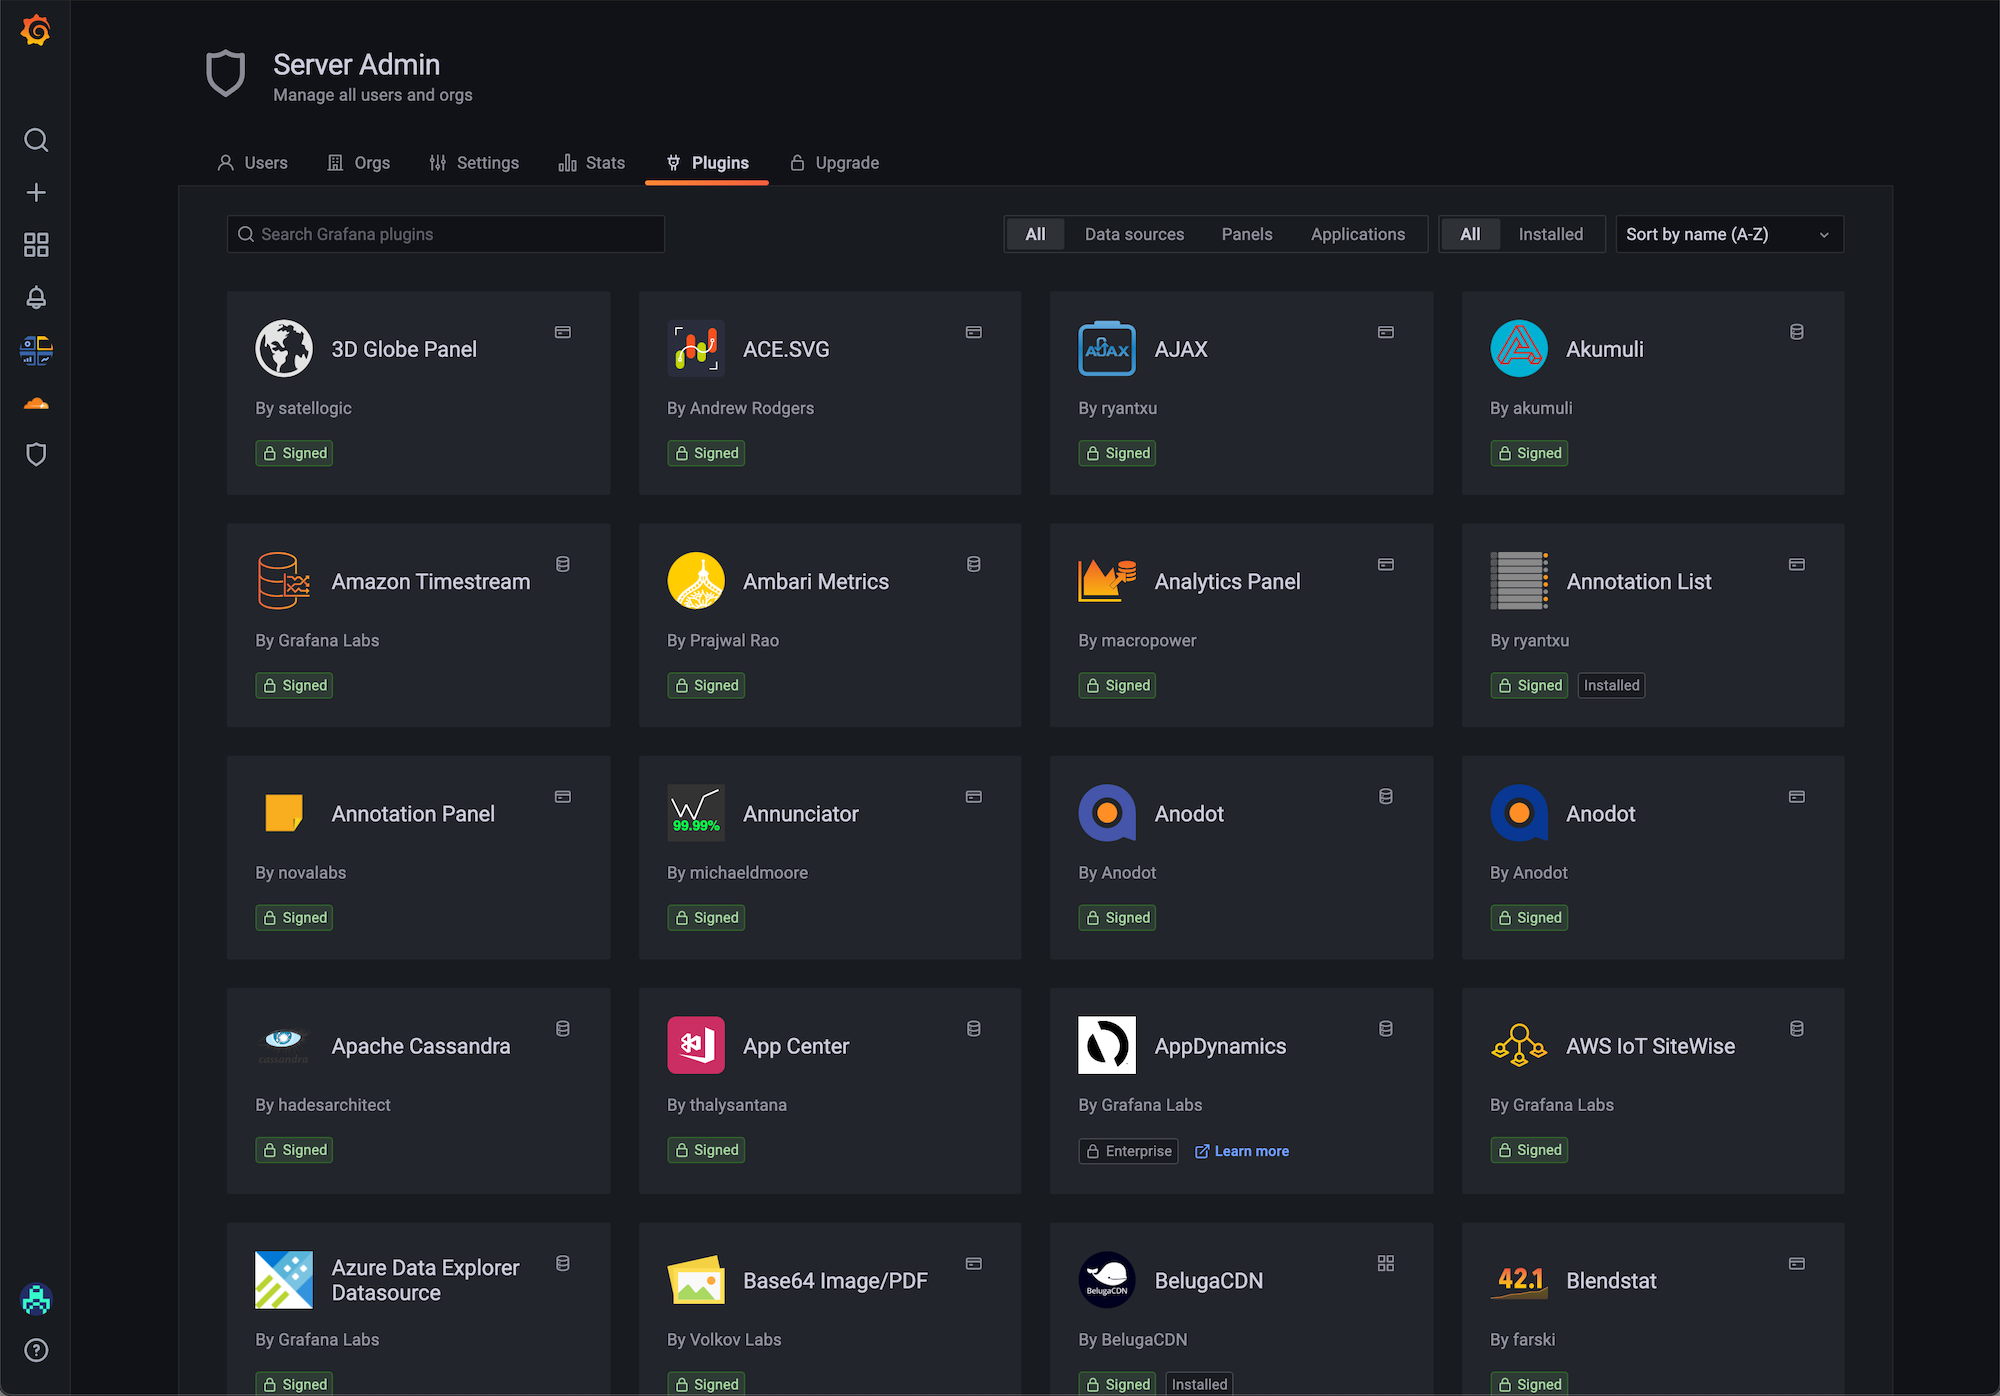
We have continued to improve how you manage your plugins within Grafana. The new plugins catalog is now enabled by default. You can use the plugin catalog to find, install, and uninstall your plugins directly from within Grafana without needing the Grafana CLI or to restart Grafana.
Grafana Alerting
We’ve continued to bolster the new, unified alerting system launched in Grafana 8. This update includes the addition of a UI to edit the Cortex/Loki namespace, edit the alert group name, and edit the alert group evaluation interval. We’ve also added a Test button to test an alert notification contact point. There’s even more to explore here including custom grouping for alert manager notifications and several small but significant changes to improve creation editing and managing alert rules. Please see the alerting documentation for more details and information on how you can enable the unified alerting system in your instance of Grafana.
Image Renderer performance improvements and measurement
You can use Grafana’s image renderer to generate images of panels and dashboards. Grafana uses these images for alert notifications, PDF exports (Grafana Enterprise), and reports sent by Grafana (Grafana Enterprise). We’ve added additional metrics to the image renderer to help you diagnose its performance, and included guidance in our documentation to help you configure it for the best mix of performance and resource usage. Tests show that we have reduced image load time from the 95th percentile of 10 seconds to less than 3 seconds under normal load.
Grafana Enterprise
Brand-new license and stats screen
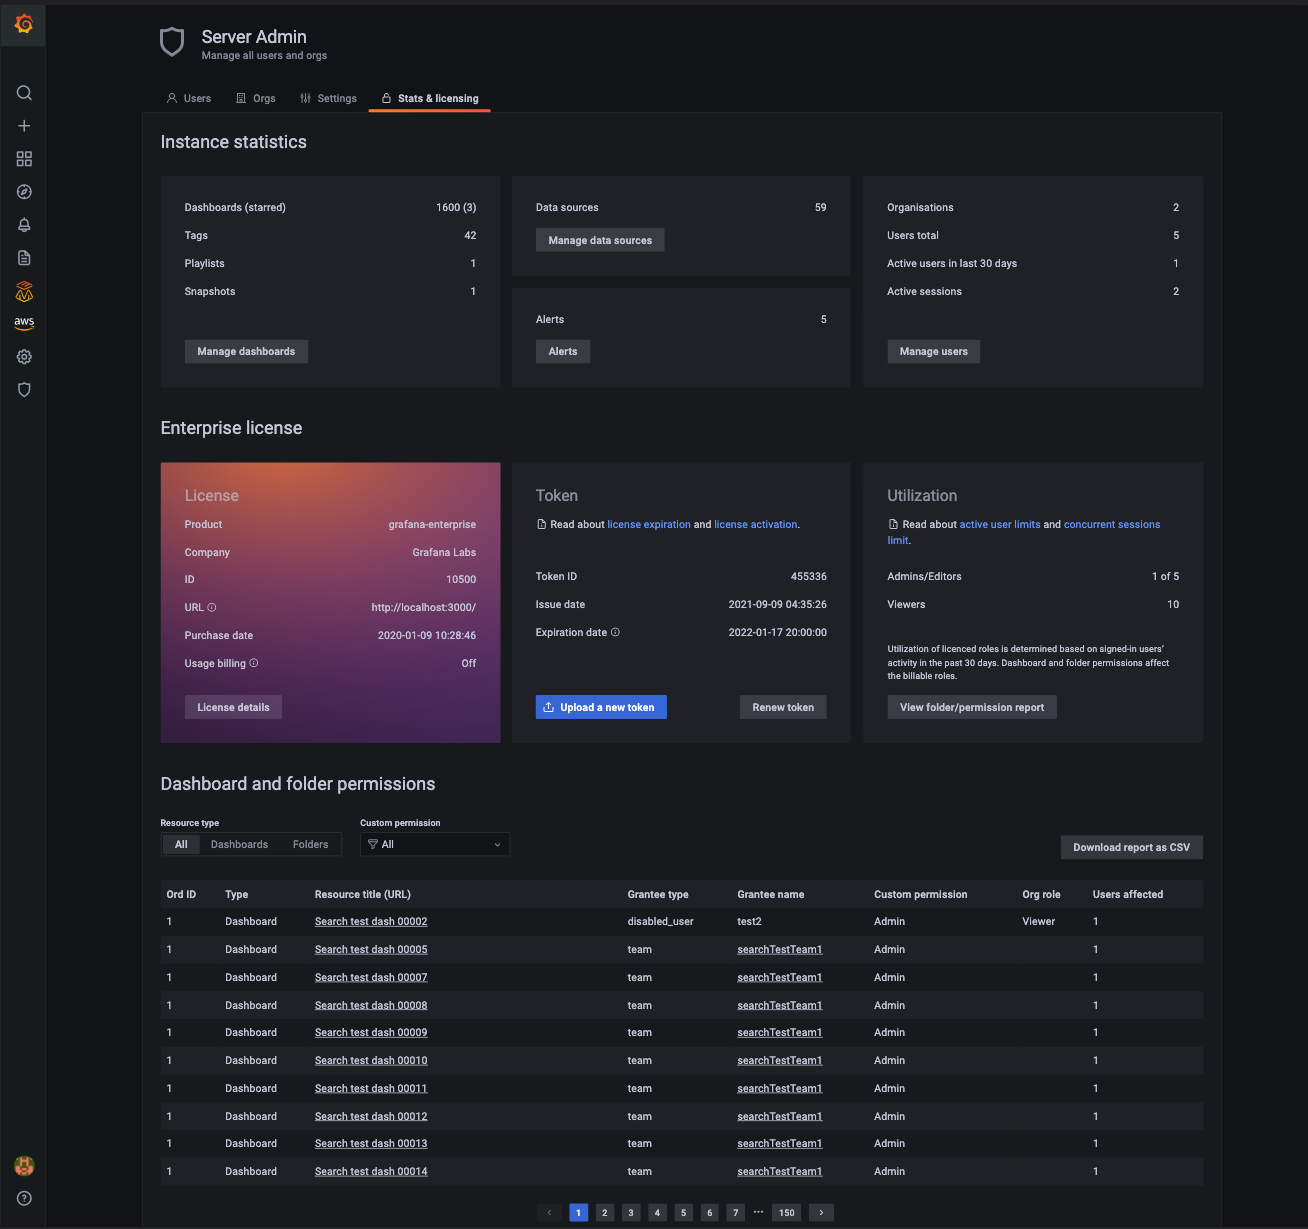
We’ve revamped the Stats and License sections of Grafana for administrators. The new combined screen makes it easier to understand a license’s term and user counts, and find out early when you need to renew or expand a license. It’s also easier to parse Grafana statistics like the number of dashboards, data sources, and alerts in a given instance. This screen also includes an interactive list of dashboard and folder permissions, which can affect your users’ licensed roles in Grafana. Learn more about Grafana Enterprise on our website, and more about licenses in particular in our docs.
New role-based access control permissions
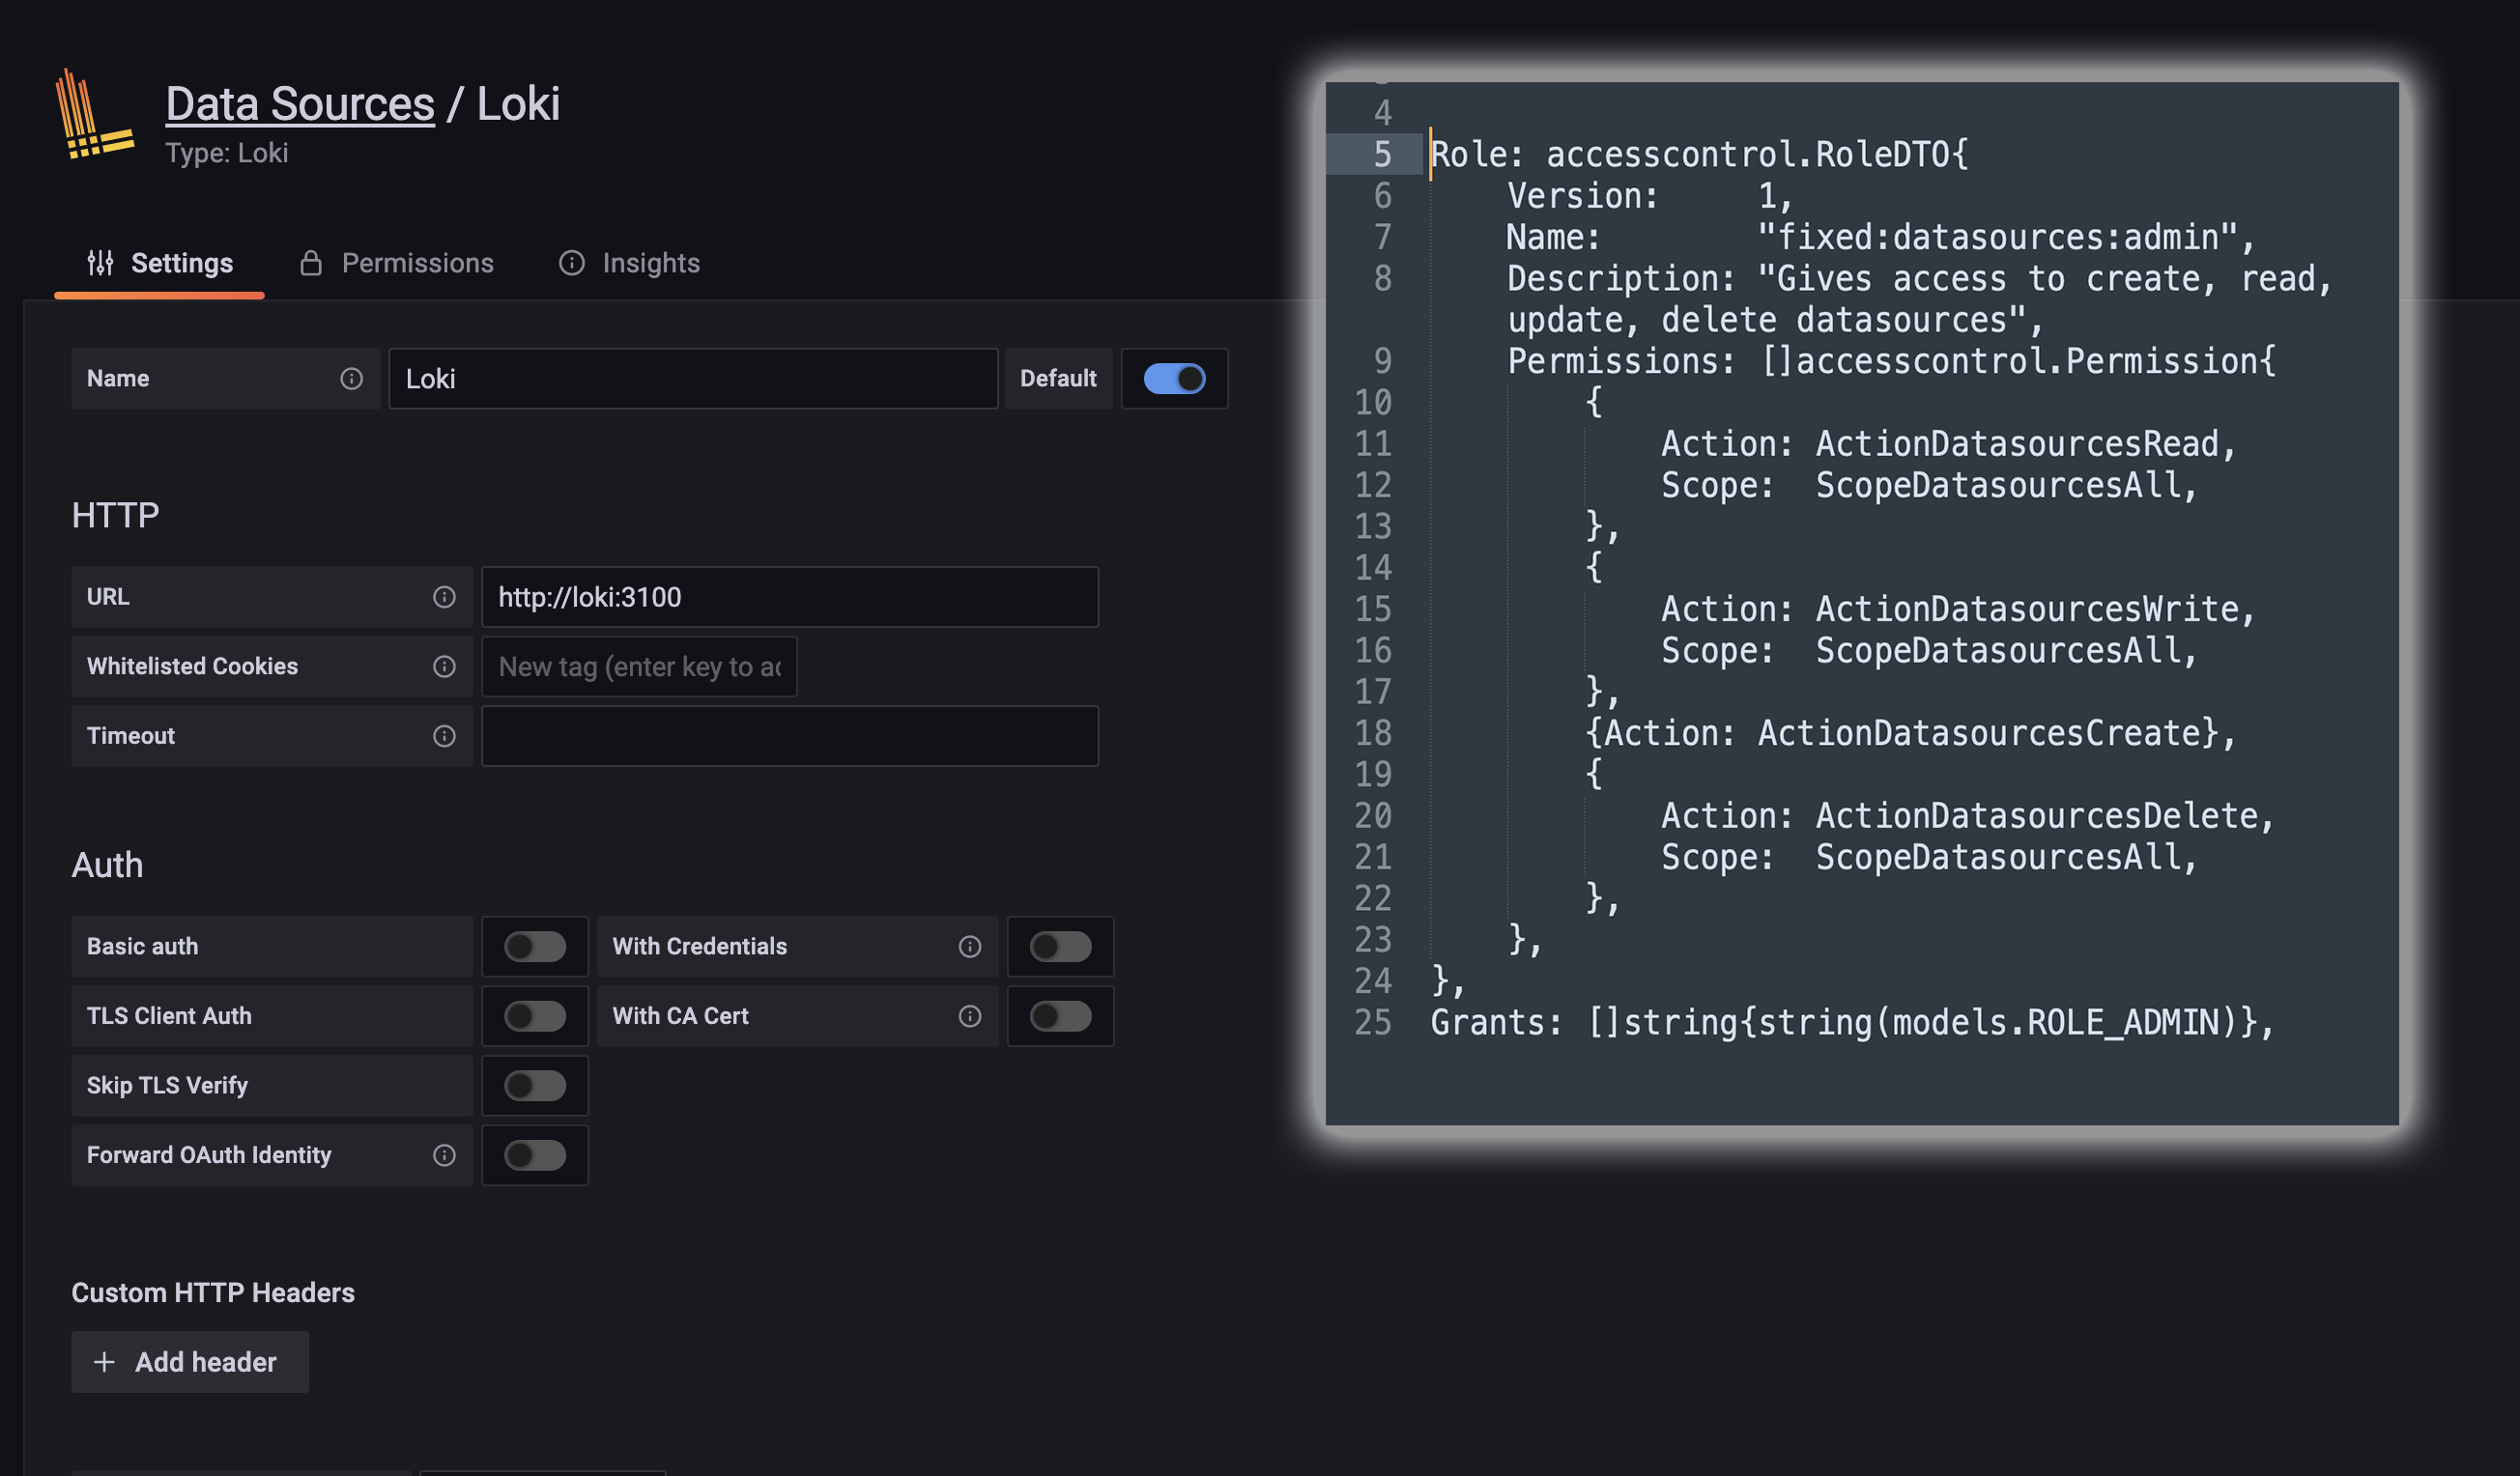
Role-based access control now covers data source and provisioning permissions. You can decide which roles (Viewers, Editors, and Admins) can manage data sources and data source permissions in Grafana, and which roles can reload provisioning configuration for dashboards, data sources, and other provisioned resources. We’ll continue adding role-based access control to more Grafana services, like dashboards and API Keys, in upcoming releases. Learn more about role-based access control in our release post and our docs.
Export usage insights logs as server logs
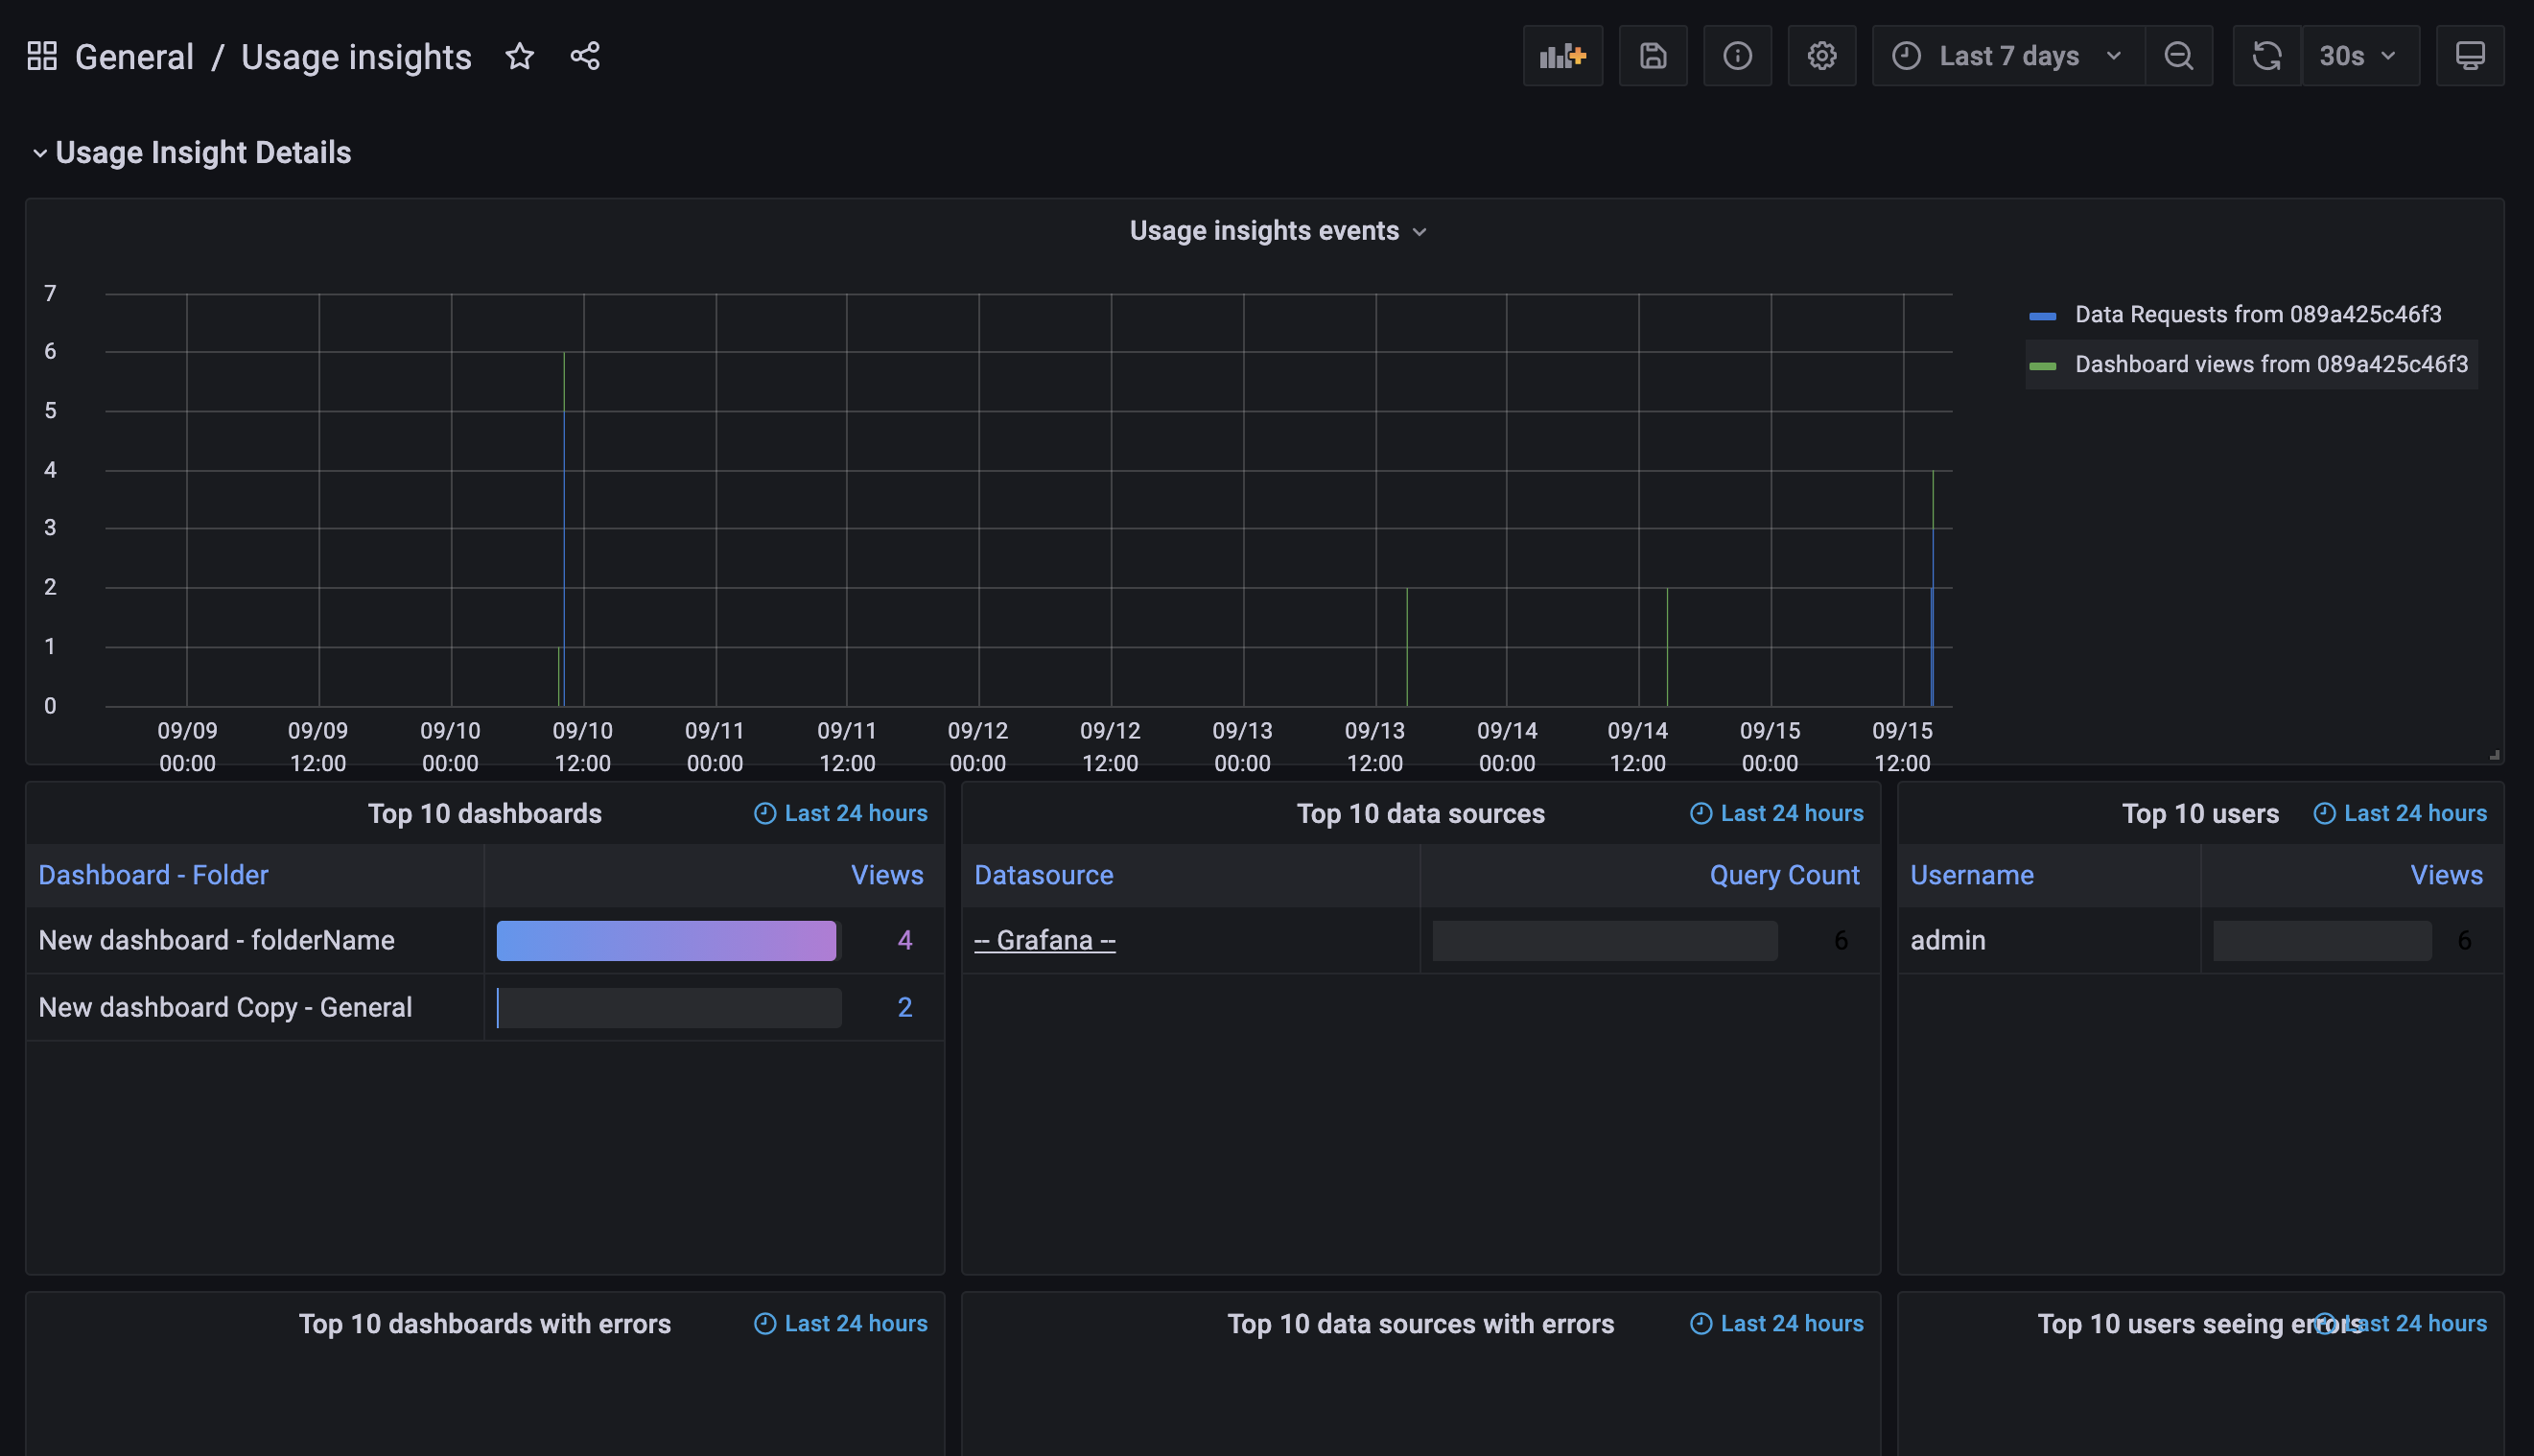
Usage Insights Logs contain valuable information about user dashboard visits, queries, and front-end errors that are otherwise impossible to track in Grafana. You can now export those logs alongside your regular server logs to identify problematic dashboards and data sources and improve users’ experience with Grafana. Previously, these metrics could only be exported directly to Loki. Learn more in the documentation about exporting logs
Create a report from the dashboard Share dialogue
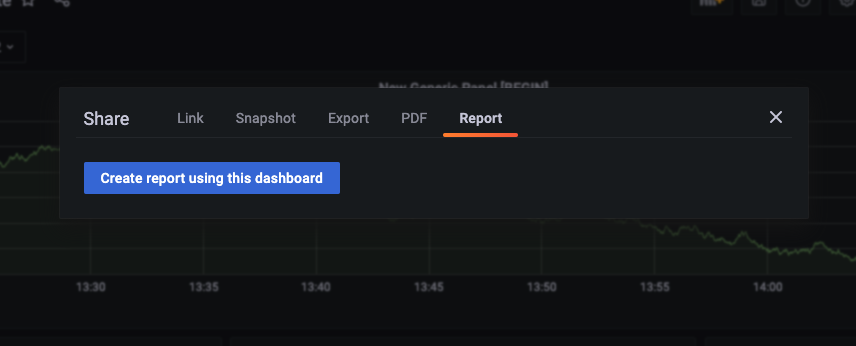
Reports offer a powerful way to deliver insights directly to your email inboxes. Now you can create a report directly from any dashboard, using the Share button. This is especially useful when combined with role-based access control, which you can use to grant Editors or Viewers the ability to create reports in Grafana. To learn more, see the reporting documentation.
