Important: This documentation is about an older version. It's relevant only to the release noted, many of the features and functions have been updated or replaced. Please view the current version.
Prometheus query editor
Grafana provides a query editor for the Prometheus data source to create queries in PromQL. For more information about PromQL, see Querying Prometheus.
For general documentation on querying data sources in Grafana, see Query and transform data.
For options and functions common to all query editors, see Query editors.
Choose a query editing mode
The Prometheus query editor has two modes:
Each mode is explained in greater detail below.

Both modes are synchronized, so you can switch between them. However, if there is an issue with the query while switching modes, a warning message will appear.
Toolbar elements
The query editor toolbar contains the following elements:
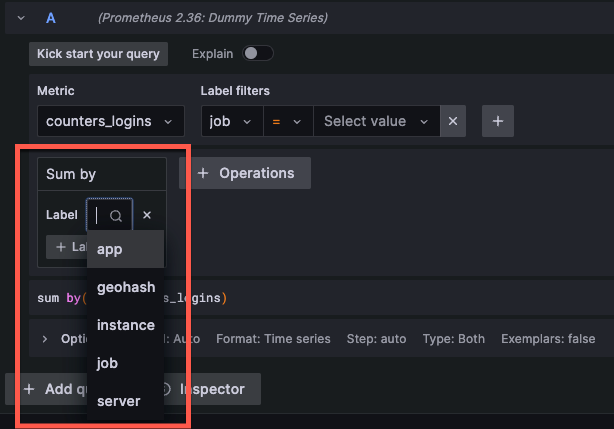
Kick start your query - Click to see a list of operation patterns that help you quickly get started adding multiple operations to your query. These include:
- Rate query starters
- Histogram query starters
- Binary query starters
Click the arrow next to each to see available options to add to your query.
- Explain - Toggle to display a step-by-step explanation of all query components and operations.

- Builder/Code - Click the corresponding Builder or Code tab on the toolbar to select a editor mode.
Configure common options
You can configure Prometheus-specific options in the query editor by setting several options regardless of mode.

Legend
The Legend setting defines the time series’s name. You can use a predefined or custom format.
- Auto - Displays unique labels. Also displays all overlapping labels if a series has multiple labels.
- Verbose - Displays all label names.
- Custom - Uses templating to select which labels will be included. For example,
{{hostname}}is replaced by the label value for the labelhostname. Clear the input and click outside of it to select another mode.
Min step
The Min step setting defines the lower bounds on the interval between data points.
For example, set this to 1h to hint that measurements are taken hourly.
This setting supports the $__interval and $__rate_interval macros. Be aware that the query range dates are aligned to the step and this can change the start and end of the range.
Format
Switch between the following format options:
- Time series - The default time series format. See Time series kind formats for information on time series data frames and how time and value fields are structured.
- Table - This works only in a Table panel.
- Heatmap - Displays metrics of the Histogram type on a Heatmap panel by converting cumulative histograms to regular ones and sorting the series by the bucket bound.
Type
The Type setting sets the query type. These include:
- Both - The default option. Returns results for both a Range query and an Instant query.
- Range - Returns a range vector consisting of a set of time series data containing a range of data points over time for each time series. You can choose lines, bars, points, stacked lines or stacked bars
- Instant - Returns one data point per query and only the most recent point in the time range provided. The results can be shown in table format or as raw data. To depict instant query results in the time series panel, first add a field override, next add a property to the override named
Transform, and finally selectConstantfrom the Transform dropdown.
For more information, refer to the Time Series Transform option documentation.
Note
Grafana modifies the request dates for queries to align them with the dynamically calculated step. This ensures a consistent display of metrics data and Prometheus requires this for caching results. But, aligning the range with the step can result in a small gap of data at the right edge of a graph or change the start date of the range. For example, a 15s step aligns the range to Unix time divisible by 15s and a 1w minstep aligns the range to the start of the week on a Thursday.
Exemplars
Toggle Exemplars to run a query that includes exemplars in the graph. Exemplars are unique to Prometheus. For more information see Introduction to exemplars.
Note
There is no option to add exemplars with an Instant query type.
Inspector
Click Inspector to get detailed statistics regarding your query. Inspector functions as a kind of debugging tool that “inspects” your query. It provides query statistics under Stats, request response time under Query, data frame details under {} JSON, and the shape of your data under Data.

Builder mode
Builder mode helps you build queries using a visual interface. This option is best for users who have limited or no previous experience working with Prometheus and PromQL.
This video demonstrates how to use the visual Prometheus query builder available in Grafana v9.0:
There’s supposed to be a video here, but for some reason there isn’t. Either we entered the id wrong (oops!), or Vimeo is down. If it’s the latter, we’d expect they’ll be back up and running soon. In the meantime, check out our blog!
Metrics

When you are ready to create a query, you can choose the specific metric name from the dropdown list under Metric. The data source requests the list of available metrics from the Prometheus server based on the selected time rage. You can also enter text into the selector when the dropdown is open to search and filter the list.
Metrics explorer

If you would like to explore your metrics in the query builder further, you can open the Metrics Explorer by clicking the first option in the metric select component of the query builder.
The metrics explorer is different than the metrics browser. The metrics explorer is only found in the query builder section. The metrics browser is only found in the code editor. The metrics explorer does not have the ability to browse labels yet, but the metrics browser can display all labels on a metric name.
The metrics explorer displays all metrics in a paginated table list. The list shows the total number of metrics, as well as the name, type and description for each metric. You can enter text into the search input to filter results. You can also filter by type.
There are also additional settings for the following items:
- Include description in search. Search by name and description
- Include results with no metadata. Many Prometheus metrics have no metadata. This allows users to include metrics with undefined type and description.
- Disable text wrap.
- Enable regex search. This uses the Prometheus API to enable regex search for the metric name.
Label filters
Select desired labels and their values from the dropdown list.
When a metric is selected, the data source requests available labels and their values from the server.
Use the + button to add a label, and the x button to remove a label.
Operations

Select the + Operations button to add operations to your query.
The query editor groups operations into the following sections:
- Aggregations - for additional information see Aggregation operators.
- Range functions - for additional information see Functions.
- Functions - for additional information see Functions.
- Binary operations - for additional information see Binary operators.
- Trigonometric - for additional information see Trigonometric functions.
- Time functions - for additional information see Functions.
All operations have function parameters under the operation header. Click the operator to see a full list of supported functions. Some operations allow you to apply specific labels to functions.

Some operations make sense only when used in a specific order. If adding an operation would result in nonsensical query, the query editor adds the operation to the correct place.
Hints

The query editor can detect which operations are most appropriate for some selected metrics. If it does, it displays a hint next to the + Operations button.
To add the operation to your query, click the Hint.
Once you are satisfied with your query, click Run query.
Code mode
Code mode is for the experienced Prometheus user with prior expertise in PromQL, Prometheus’ query language. The Code mode editor allows you to create queries just as you would in Prometheus. For more information about PromQL see Querying Prometheus.

The user interface (UI) also lets you select metrics, labels, filters and operations.
You can write complex queries using the text editor with autocompletion features and syntax highlighting. It also contains a Metrics browser to further help you write queries.
Use autocomplete
Code mode’s autocomplete feature works automatically while typing. The query editor can autocomplete static functions, aggregations, keywords, and also dynamic items like metrics and labels. The autocompletion dropdown includes documentation for the suggested items where available.
Metrics browser
The metrics browser locates metrics and selects relevant labels to help you build basic queries.
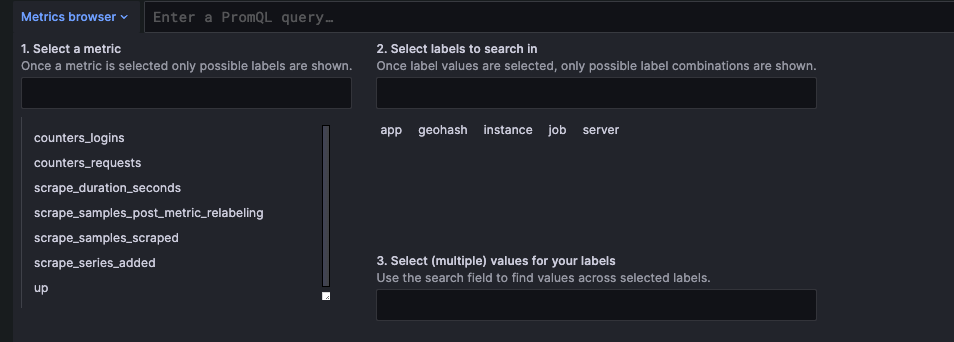
When you click Metrics browser in Code mode, it displays all available metrics and labels.
If supported by your Prometheus instance, each metric also displays its HELP and TYPE as a tooltip.

When you select a metric under Step 1, the browser narrows down the available labels to show only the ones applicable to the metric.
You can then select one or more labels shown in Step 2.
Select one or more values in Step 3 for each label to tighten your query scope.
In Step 4, you can select Use query to run the query, Use as rate query to add the rate operation to your query ($__rate_interval), Validate selector to verify the selector is valid and show the number of series found, or Clear to clear your selections and start over.
Note
If you do not remember a metric name, you can also select a few labels to narrow down the list, then find relevant label values.
All lists in the metrics browser have a search field above them to quickly filter for metrics or labels that match a certain string. The values section has only one search field, and its filtering applies to all labels to help you find values across labels once selected.
For example, among your labels app, job, job_name only one might have the value you are looking for.
Once you are satisfied with your query, click Run query.


