Important: This documentation is about an older version. It's relevant only to the release noted, many of the features and functions have been updated or replaced. Please view the current version.
Service Graph and Service Graph view
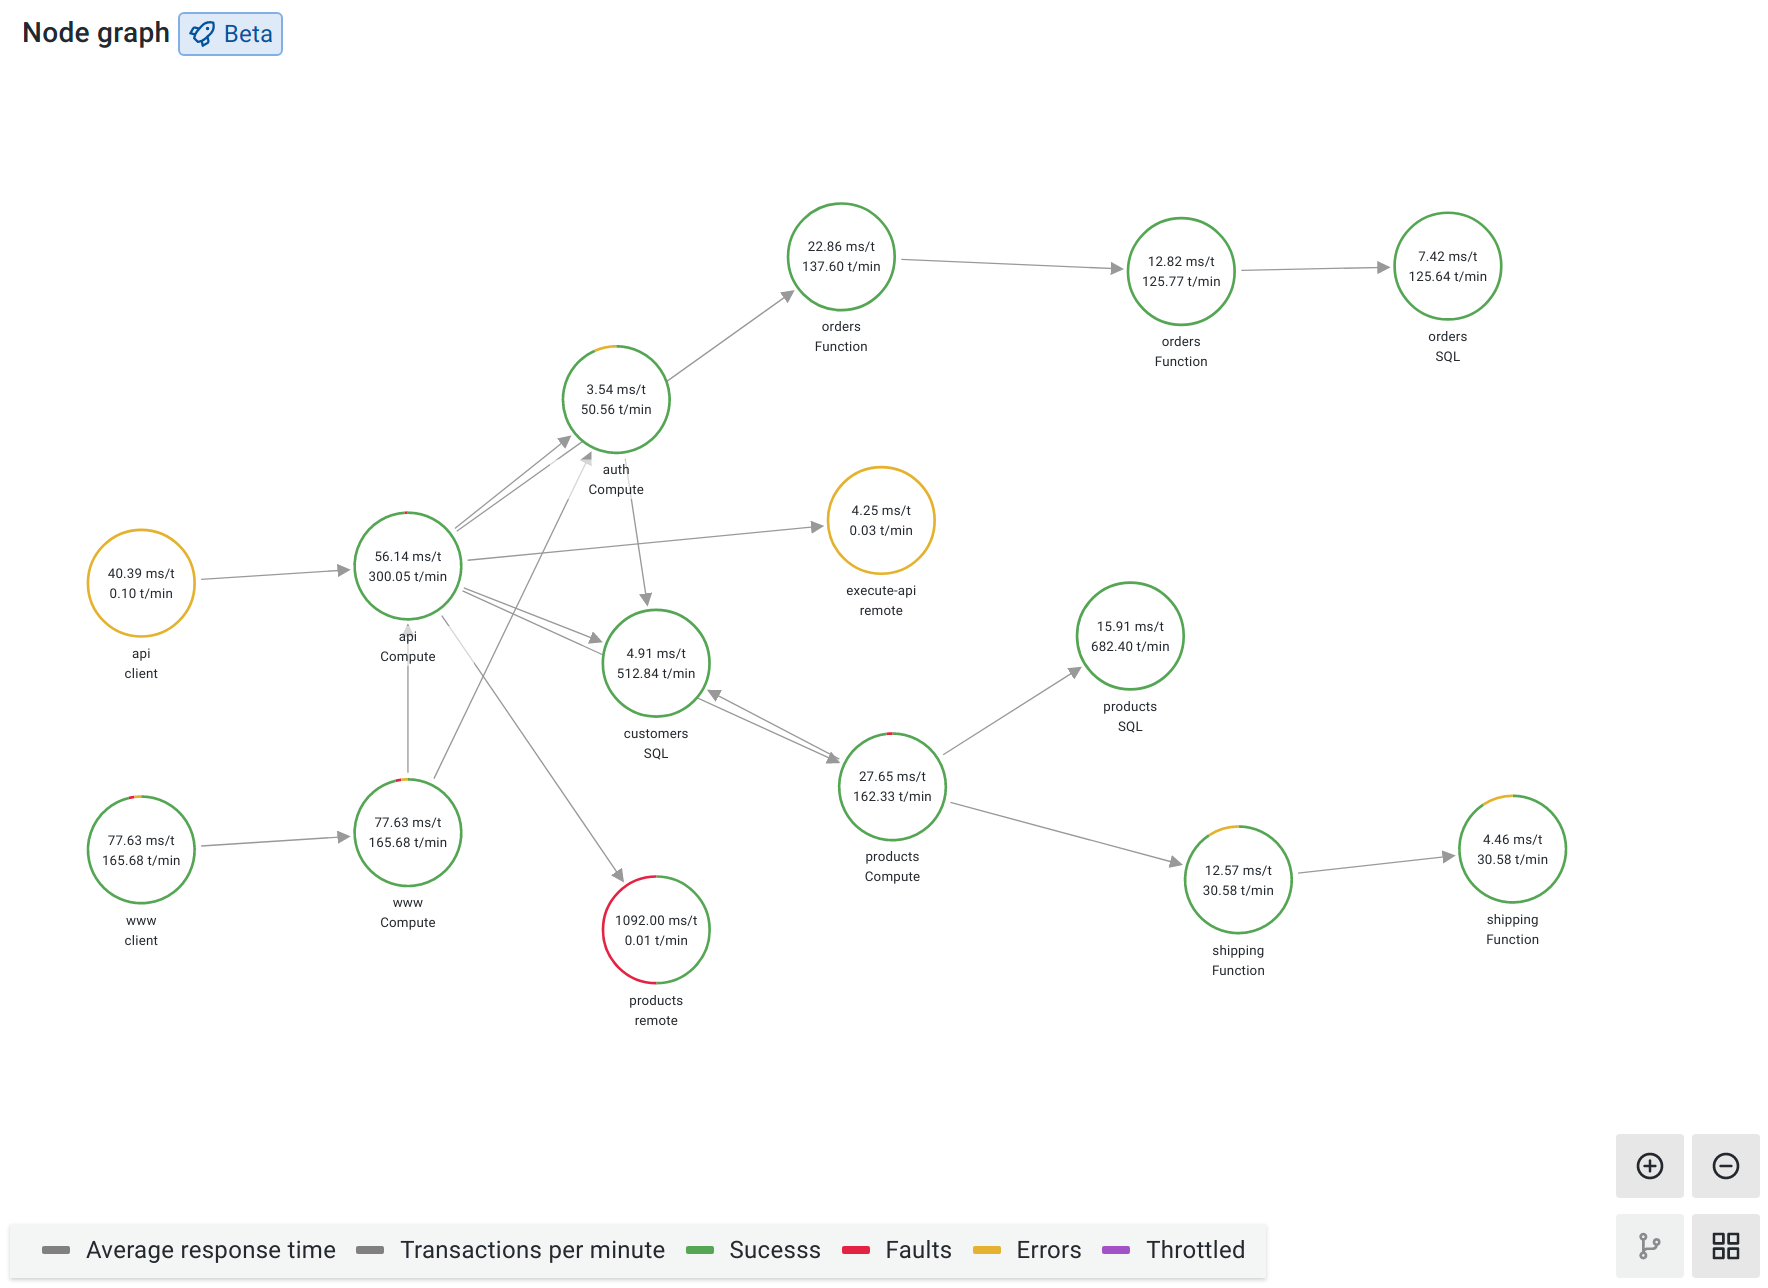
The Service Graph is a visual representation of the relationships between services. Each node on the graph represents a service such as an API or database.
You use the Service Graph to detect performance issues; track increases in error, fault, or throttle rates in services; and investigate root causes by viewing corresponding traces.

Display the Service Graph
- Configure Grafana Alloy or Tempo or GET to generate Service Graph data.
- Link a Prometheus data source in the Tempo data source’s Service Graph settings.
- Navigate to Explore.
- Select the Tempo data source.
- Select the Service Graph query type.
- Run the query.
- (Optional) Filter by service name.
For details, refer to Node Graph panel.
Each circle in the graph represents a service. To open a context menu with additional links for quick navigation to other relevant information, click a service.
Numbers inside the circles indicate the average time per request and requests per second.
Each circle’s color represents the percentage of requests in each state:
| Color | State |
|---|---|
| Green | Success |
| Red | Fault |
| Yellow | Errors |
| Purple | Throttled responses |
Open the Service Graph view
Service graph view displays a table of request rate, error rate, and duration metrics (RED) calculated from your incoming spans. It also includes a node graph view built from your spans.

For details, refer to the Service Graph view documentation.
To open the Service Graph view:
- Link a Prometheus data source in the Tempo data source settings.
- Navigate to Explore.
- Select the Tempo data source.
- Select the Service Graph query type.
- Run the query.
- (Optional) Filter your results.
Note
Grafana uses the
traces_spanmetrics_calls_totalmetric to display the name, rate, and error rate columns, andtraces_spanmetrics_latency_bucketto display the duration column. These metrics must exist in your Prometheus data source.
To open a query in Prometheus with the span name of that row automatically set in the query, click a row in the rate, error rate, or duration columns.
To open a query in Tempo with the span name of that row automatically set in the query, click a row in the links column.


