Important: This documentation is about an older version. It's relevant only to the release noted, many of the features and functions have been updated or replaced. Please view the current version.
Alert rule types
Grafana supports two different alert rule types. Learn more about each of the alert rule types, how they work, and decide which one is best for your use case.
Grafana-managed alert rules
Grafana-managed alert rules are the most flexible alert rule type. They allow you to create alerts that can act on data from any of our supported data sources.
In addition to supporting multiple data sources, you can also add expressions to transform your data and set alert conditions. Using images in alert notifications is also supported. This is the only type of rule that allows alerting from multiple data sources in a single rule definition.
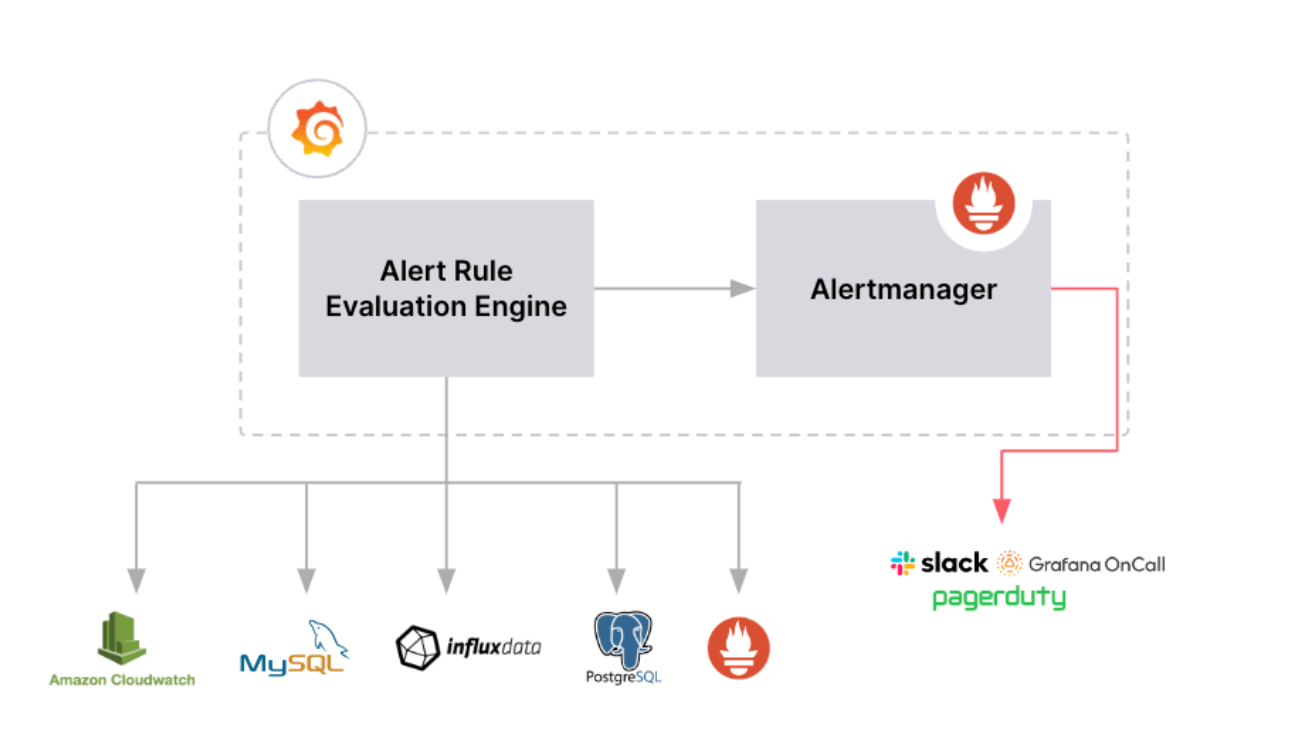
The following diagram shows how Grafana-managed alerting works.

Alert rules are created within Grafana based on one or more data sources.
Alert rules are evaluated by the Alert Rule Evaluation Engine from within Grafana.
Alerts are delivered using the internal Grafana Alertmanager.
Note:
You can also configure alerts to be delivered using an external Alertmanager; or use both internal and external alertmanagers. For more information, see Add an external Alertmanager.
Data source-managed alert rules
To create data source-managed alert rules, you must have a compatible Prometheus or Loki data source.
You can check if your data source supports rule creation via Grafana by testing the data source and observing if the Ruler API is supported.
For more information on the Ruler API, refer to Ruler API.
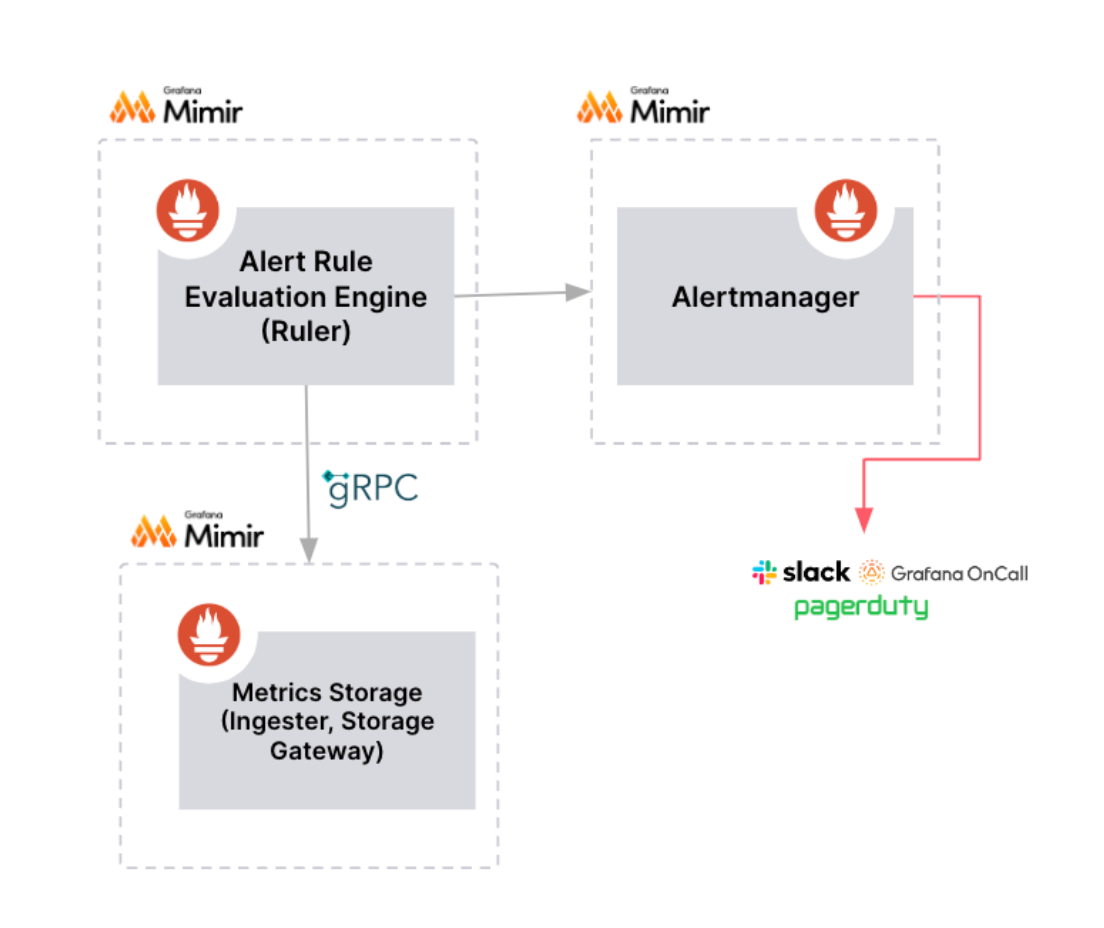
The following diagram shows how data source-managed alerting works.

- Alert rules are created and stored within the data source itself.
- Alert rules can only be created based on Prometheus data.
- Alert rule evaluation and delivery is distributed across multiple nodes for high availability and fault tolerance.
Choose an alert rule type
When choosing which alert rule type to use, consider the following comparison between Grafana-managed alert rules and Grafana Mimir or Loki alert rules.
Feature | Grafana-managed alert rule | Loki/Mimir-managed alert rule |
|---|---|---|
| Create alert rules | Yes | No: You can only create alert rules that are based on Prometheus data. The data source must have the Ruler API enabled. |
| Mix and match data sources | Yes | No |
| Includes support for recording rules | No | Yes |
| Add expressions to transform | Yes | No |
| Use images in alert notifications | Yes | No |
| Scaling | More resource intensive, depend on the database, and are likely to suffer from transient errors. They only scale vertically. | Store alert rules within the data source itself and allow for “infinite” scaling. Generate and send alert notifications from the location of your data. |
| Alert rule evaluation and delivery | Alert rule evaluation and delivery is done from within Grafana, using an external Alertmanager; or both. | Alert rule evaluation and alert delivery is distributed, meaning there is no single point of failure. |
Note:
If you are using non-Prometheus data, we recommend choosing Grafana-managed alert rules. Otherwise, choose Grafana Mimir or Grafana Loki alert rules where possible.


