Important: This documentation is about an older version. It's relevant only to the release noted, many of the features and functions have been updated or replaced. Please view the current version.
What is Prometheus?
Observability focuses on understanding the internal state of your systems based on the data they produce, which helps determine if your infrastructure is healthy. Prometheus is a core technology for monitoring and observability of systems, but the term “Prometheus” can be confusing because it is used in different contexts. Understanding Prometheus basics, why it’s valuable for system observability, and how users use it in practice will both help you better understand it and help you use Grafana.
Prometheus began in 2012 at SoundCloud because existing technologies were insufficient for their observability needs. Prometheus offers both a robust data model and a query language. Prometheus is also simple and scalable. In 2018, Prometheus graduated from Cloud Native Computing Foundation (CNCF) incubation, and today has a thriving community.
Prometheus as data
The following panel in a Grafana dashboard shows how much disk bandwidth on a Mac laptop is being used. The green line represents disk reads, and the yellow line represents writes.

Data like these form time series. The X-axis is a moment in time and the Y-axis is a number or measurement; for example, 5 megabytes per second. This type of time series data appears everywhere in systems monitoring, as well as in places such as seasonal temperature charts and stock prices. This data is simply some measurement (such as a company stock price or Disk I/O) through a series of time instants.
Prometheus is a technology that collects and stores time series data. Time series are fundamental to Prometheus; its data model is arranged into:
- metrics that consist of a timestamp and a sample, which is the numeric value, such as how many disk bytes have been read or a stock price
- a set of labels called dimensions, for example,
jobanddevice
You can store time series data in any relational database, however, these systems are not developed to store and query large volumes of time series data. Prometheus and similar software provide tools to compact and optimize time series data.
Simple dashboard using PromQL
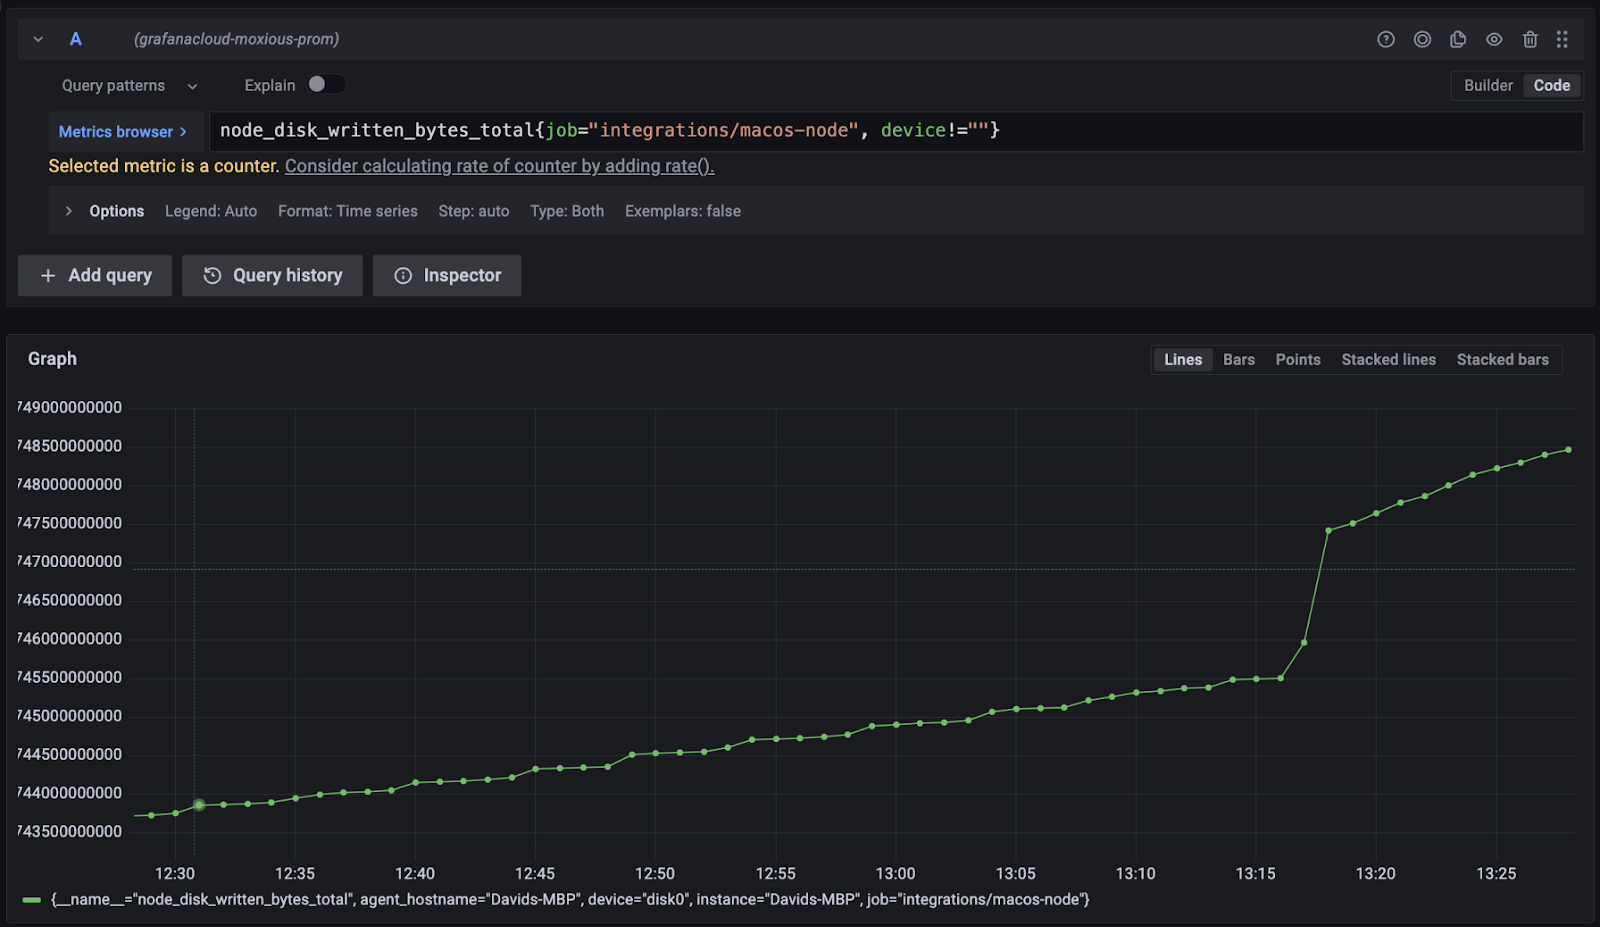
The following Grafana dashboard image shows a Disk I/O graph of raw data from Prometheus derived from a laptop.
The Metrics browser field contains the following query:
node_disk_written_bytes_total{job="integrations/macos-node", device!=""}
In this example, the Y-axis shows the total number of bytes written, and the X-axis shows dates and times. As the laptop runs, the number of bytes written increases over time. Below Metrics browser is a counter that counts the number of bytes written over time.

The query is a simple example of PromQL, the Prometheus Query Language. The query identifies the metric of interest (node_disk_written_bytes_total) and provides two labels (job and device). The label selector job="integrations/macos-node" filters metrics. It both reduces the scope of the metrics to those coming from the MacOS integration job and specifies that the “device” label cannot be empty. The result of this query is the raw stream of numbers that the graph displays.
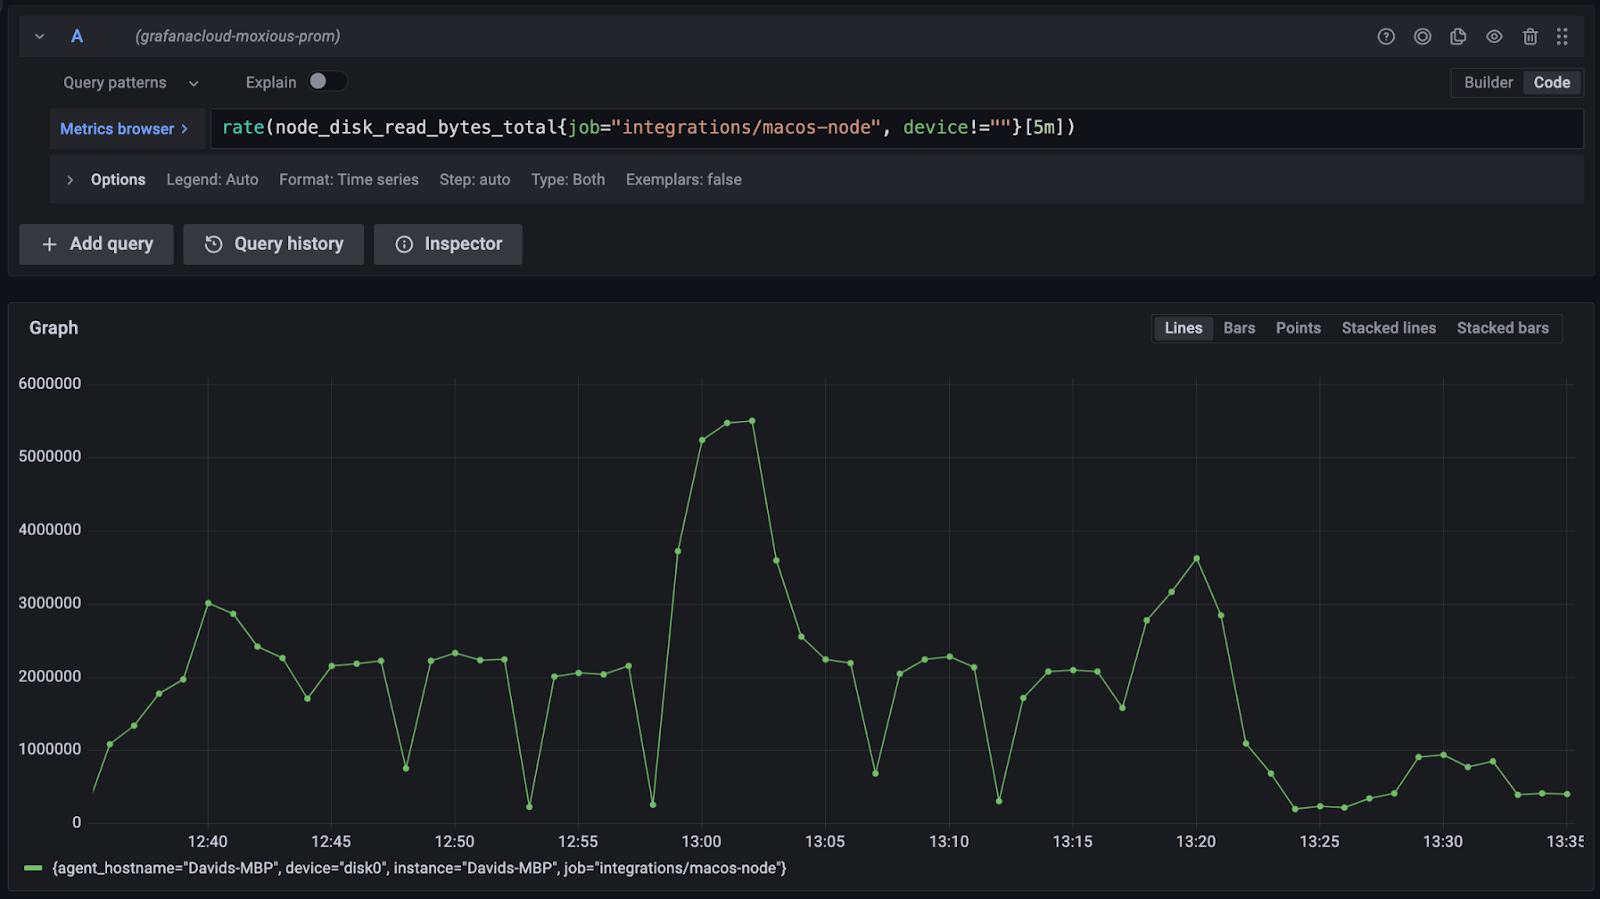
Although this view provides some insight into the performance of the system, it doesn’t provide the full story. A clearer picture of system performance requires understanding the rate of change that displays how fast the data being written is changing. To properly monitor disk performance, you need to also see spikes in activity that illustrate if and when the system is under load, and whether disk performance is at risk. PromQL includes a rate() function that shows the per-second average rate of increase over 5m (5-minute) intervals. This view provides a much clearer picture of what’s happening with the system.

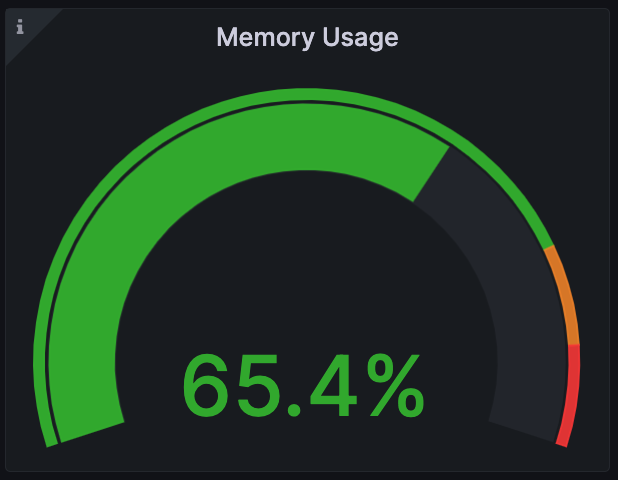
A counter metric is just one type of metric; it is a number (such as total bytes written) that only increases. Prometheus supports several others, such as the metric type gauge, which can increase or decrease.
The following gauge visualization displays the total RAM usage on a computer.

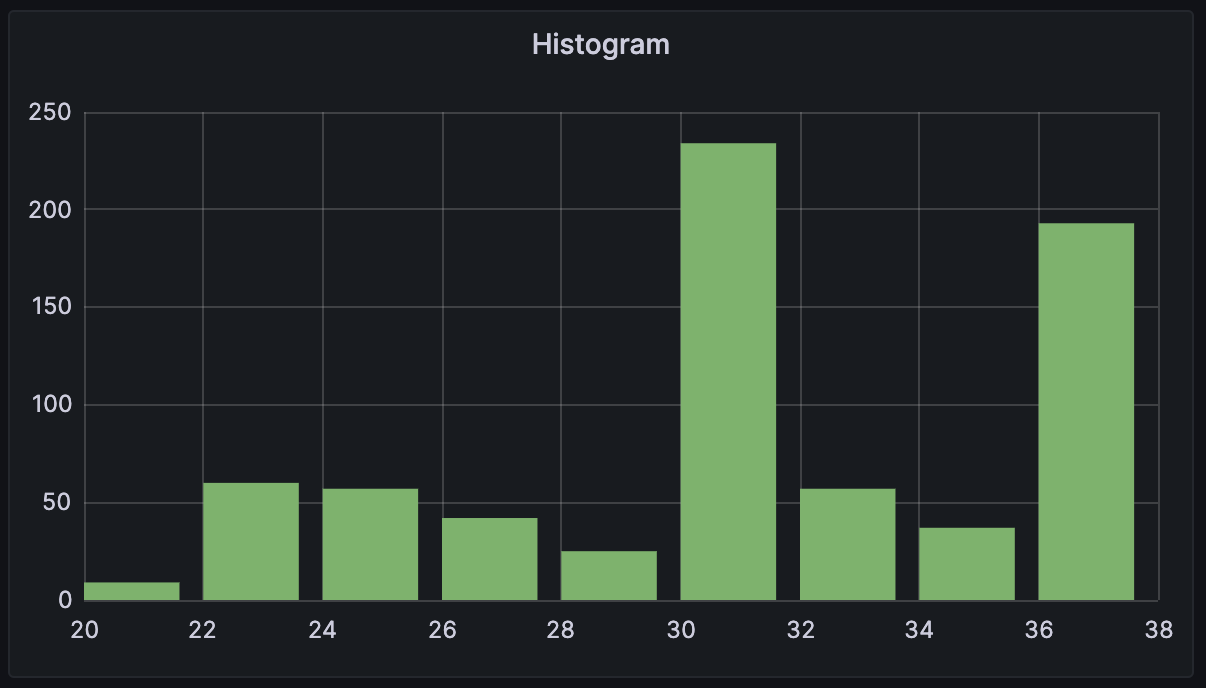
The third metric type is called a histogram, which counts observations and organizes them into configurable groups. The following example displays floating-point numbers grouped into ranges that display how frequently each occurred.

These core concepts of time series, metrics, labels, and aggregation functions are foundational to Grafana and observability.
Why this is valuable
Software and systems are a difficult business. Sometimes things go wrong. Observability helps you understand a system’s state so that issues can be quickly identified and proactively addressed. And when problems do occur, you can be alerted to them to diagnose and solve them within your Service Level Objectives (SLOs).
The three pillars of observability are metrics, logs, and traces. Prometheus supports the metrics pillar. When software on a computer runs slowly, observability can help you identify whether CPU is saturated, the system is out of memory, or if the disk is writing at maximum speed so you can proactively respond.
Prometheus as software
Prometheus isn’t just a data format; it is also considered an open source systems monitoring and alerting toolkit. That’s because Prometheus is software, not just data.
Prometheus can scrape metric data from software and infrastructure and store it. Scraping means that Prometheus software periodically revisits the same endpoint to check for new data. Prometheus scrapes data from a piece of software instrumented with a client library.
For example, a NodeJS application can configure the prom-client to expose metrics easily at an endpoint, and Prometheus can regularly scrape that endpoint. Prometheus includes a number of other tools within the toolkit to instrument your applications.
Prometheus as deployment
The first section of this document introduced the Prometheus as Data concept and how the Prometheus data model and metrics are organized. The second section introduced the concept of Prometheus as Software that is used to collect, process, and store metrics. This section describes how Prometheus as Data and Prometheus as Software come together.
Consider the following example. Suppose a ‘MyApp’ application uses a Prometheus client to expose metrics. One approach to collecting metrics data is to use a URL in the application that points to an endpoint http://localhost:3000/metrics that produces Prometheus metrics data.
The following image shows the two metrics associated with the endpoint. The HELP text explains what the metric means, and the TYPE text indicates what kind of metric it is (in this case, a gauge). MyAppnodejs_active_request_total indicates the number of requests (in this case, 1). MyAppnodejs_heap_size_total_bytes indicates the heap size reported in bytes. There are only two numbers because this data shows the value at the moment the data was fetched.

The ‘MyApp’ metrics are available in an HTTP endpoint, but how do they get to Grafana, and subsequently, into a dashboard? The process of recording and transmitting the readings of an application or piece of infrastructure is known as telemetry. Telemetry is critical to observability because it helps you understand exactly what’s going on in your infrastructure. The metrics introduced previously, for example, MyAppnodejs_active_requests_total, are telemetry data.
To get metrics into Grafana, you can use either the Prometheus software or Grafana Agent to scrape metrics. Grafana Agent collects and forwards the telemetry data to open-source deployments of the Grafana Stack, Grafana Cloud, or Grafana Enterprise, where your data can be analyzed. For example, you can configure Grafana Agent to pull the data from ‘MyApp’ every five seconds and send the results to Grafana Cloud.
Metrics data is only one type of telemetry data; the other kinds are logs and traces. Using Grafana Agent can be a great option to send telemetry data because as you scale your observability practices to include logs and traces, which Grafana Agent also supports, you’ve got a solution already in place.
The following image illustrates how Grafana Agent works as an intermediary between ‘MyApp’ and Grafana Cloud.

Bringing it together
The combination of Prometheus and Grafana Agent gives you control over the metrics you want to report, where they come from, and where they’re going. Once the data is in Grafana, it can be stored in a Grafana Mimir database. Grafana dashboards consist of visualizations populated by data queried from the Prometheus data source. The PromQL query filters and aggregates the data to provide you the insight you need. With those steps, we’ve gone from raw numbers, generated by software, into Prometheus, delivered to Grafana, queried by PromQL, and visualized by Grafana.
What’s next?
Now that you understand how Prometheus metrics work, what will you build?
- One great next step is to build a dashboard in Grafana and start turning that raw Prometheus telemetry data into insights about what’s going with your services and infrastructure.
- Another great step is to learn about Grafana Mimir, which is essentially a database for Prometheus data. If you’re wondering how to make this work for a large volumes of metrics with a lot of data and fast querying, check out Grafana Mimir.
- If you’re interested in working with Prometheus data in Grafana directly, check out the Prometheus data source documentation, or check out PromQL basics.


