Important: This documentation is about an older version. It's relevant only to the release noted, many of the features and functions have been updated or replaced. Please view the current version.
Prometheus data source
Prometheus is an open-source database that uses a telemetry collector agent to scrape and store metrics used for monitoring and alerting. If you are just getting started with Prometheus, see What is Prometheus?.
Grafana provides native support for Prometheus. For instructions on downloading Prometheus see Get started with Grafana and Prometheus.
For instructions on how to add a data source to Grafana, refer to the administration documentation.
Only users with the organization administrator role can add data sources and edit existing data sources.
Administrators can also configure the data source via YAML with Grafana’s provisioning system.
Once you’ve added the Prometheus data source, you can configure it so that your Grafana instance’s users can create queries in its query editor when they build dashboards, use Explore, and annotate visualizations.
The following guides will help you get started with the Prometheus data source:
Prometheus API
The Prometheus data source also works with other projects that implement the Prometheus querying API.
For more information on how to query other Prometheus-compatible projects from Grafana, refer to the specific project’s documentation:
Provision the data source
You can define and configure the data source in YAML files as part of Grafana’s provisioning system. For more information about provisioning, and for available configuration options, refer to Provisioning Grafana.
Note
Once you have provisioned a data source you cannot edit it.
Provisioning example
apiVersion: 1

datasources:
  - name: Prometheus
    type: prometheus
    access: proxy
    # Access mode - proxy (server in the UI) or direct (browser in the UI).
    url: http://localhost:9090
    jsonData:
      httpMethod: POST
      manageAlerts: true
      prometheusType: Prometheus
      prometheusVersion: 2.44.0
      cacheLevel: 'High'
      disableRecordingRules: false
      incrementalQueryOverlapWindow: 10m
      exemplarTraceIdDestinations:
        # Field with internal link pointing to data source in Grafana.
        # datasourceUid value can be anything, but it should be unique across all defined data source uids.
        - datasourceUid: my_jaeger_uid
          name: traceID

        # Field with external link.
        - name: traceID
          url: 'http://localhost:3000/explore?orgId=1&left=%5B%22now-1h%22,%22now%22,%22Jaeger%22,%7B%22query%22:%22$${__value.raw}%22%7D%5D'
View Grafana metrics with Prometheus
Grafana exposes metrics for Prometheus on the /metrics endpoint.
We also bundle a dashboard within Grafana so you can start viewing your metrics faster.
To import the bundled dashboard:
- Navigate to the data source’s configuration page.
- Select the Dashboards tab.
This displays dashboards for Grafana and Prometheus.
- Select Import for the dashboard to import.
For details about these metrics, refer to Internal Grafana metrics.
Amazon Managed Service for Prometheus
The Prometheus data source works with Amazon Managed Service for Prometheus.
If you use an AWS Identity and Access Management (IAM) policy to control access to your Amazon Elasticsearch Service domain, you must use AWS Signature Version 4 (AWS SigV4) to sign all requests to that domain.
For details on AWS SigV4, refer to the AWS documentation.
AWS Signature Version 4 authentication
Note
Available in Grafana v7.3.5 and higher.
To connect the Prometheus data source to Amazon Managed Service for Prometheus using SigV4 authentication, refer to the AWS guide to Set up Grafana open source or Grafana Enterprise for use with AMP.
If you run Grafana in an Amazon EKS cluster, follow the AWS guide to Query using Grafana running in an Amazon EKS cluster.
Azure authentication settings
The Prometheus data source works with Azure authentication. To configure Azure authentication see Configure Azure Active Directory (AD) authentication.
In Grafana Enterprise, update the .ini configuration file: Configure Grafana. Depending on your setup, the .ini file is located here. Add the following setting in the [auth] section :
[auth]
azure_auth_enabled = true
Note
If you are using Azure authentication settings do not enableForward OAuth identity. Both use the same HTTP authorization headers. Azure settings will get overwritten by the Oauth token.
Exemplars
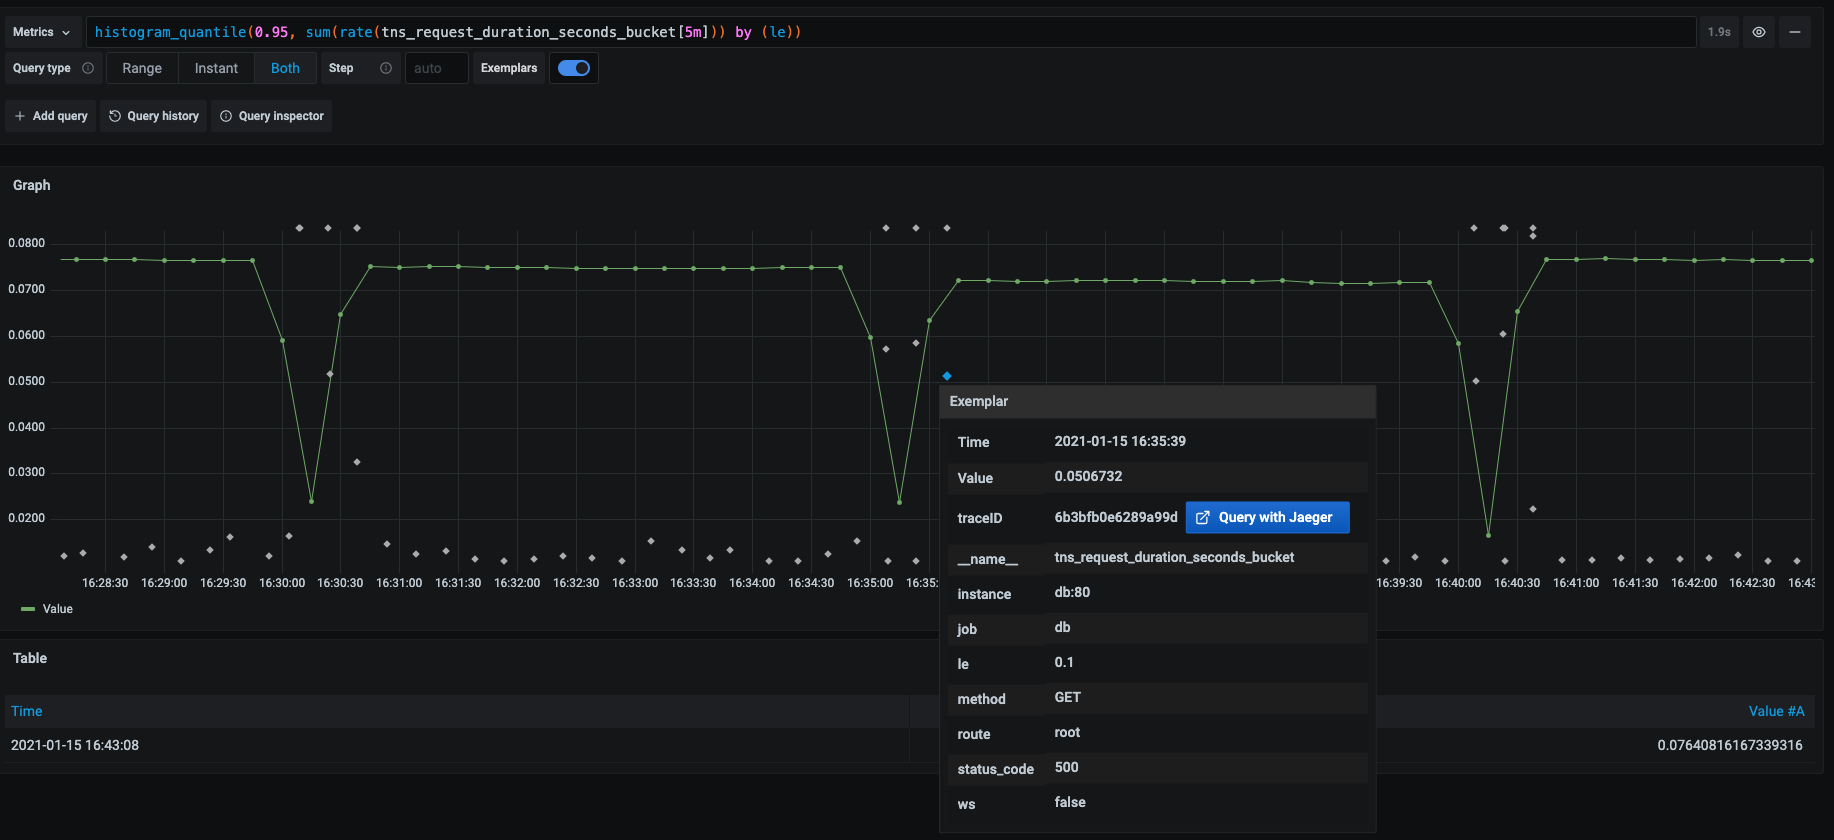
Exemplars associate higher-cardinality metadata from a specific event with traditional time series data. See Introduction to exemplars in Prometheus documentation for detailed information on how they work.
Note
Available in Prometheus v2.26 and higher with Grafana v7.4 and higher.
Grafana 7.4 and higher can show exemplars data alongside a metric both in Explore and in Dashboards.

See the Exemplars section in Configure Prometheus data source.

Incremental dashboard queries (beta)
As of Grafana 10, the Prometheus data source can be configured to query live dashboards incrementally, instead of re-querying the entire duration on each dashboard refresh.
This can be toggled on or off in the data source configuration or provisioning file (under incrementalQuerying in jsonData).
Additionally, the amount of overlap between incremental queries can be configured using the incrementalQueryOverlapWindow jsonData field, the default value is 10m (10 minutes).
Increasing the duration of the incrementalQueryOverlapWindow will increase the size of every incremental query, but might be helpful for instances that have inconsistent results for recent data.
Recording Rules (beta)
The Prometheus data source can be configured to disable recording rules under the data source configuration or provisioning file (under disableRecordingRules in jsonData).


