Important: This documentation is about an older version. It's relevant only to the release noted, many of the features and functions have been updated or replaced. Please view the current version.
What’s new in Grafana v9.4
Welcome to Grafana 9.4! Read on to learn about changes to search and navigation, dashboards and visualizations, and authentication and security. For even more detail about all the changes in this release, refer to the changelog.
Search and navigation
We’ve made the following changes to search and navigation.
Command palette enhancements
Generally available in all editions of Grafana.
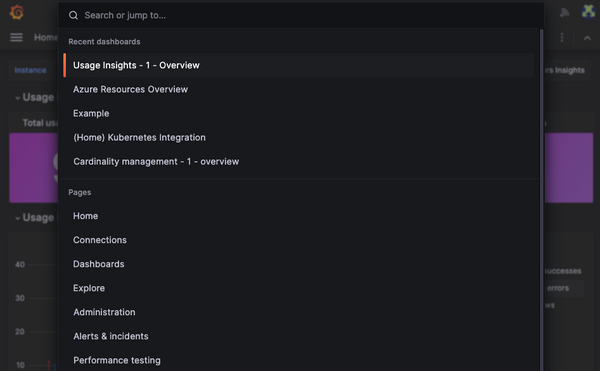
The command palette has been updated to provide a more efficient way to navigate Grafana. You can now search and access all pages and recent dashboards, making it easier to perform tasks without taking your hands off the keyboard.
To launch the command palette, use the keyboard shortcut cmd + K on Mac or ctrl + K on Linux/Windows.
To learn more about the command palette, refer to Search.
New navigation
Generally available on Grafana Cloud, and available to preview using the topnav feature toggle in all editions of Grafana.
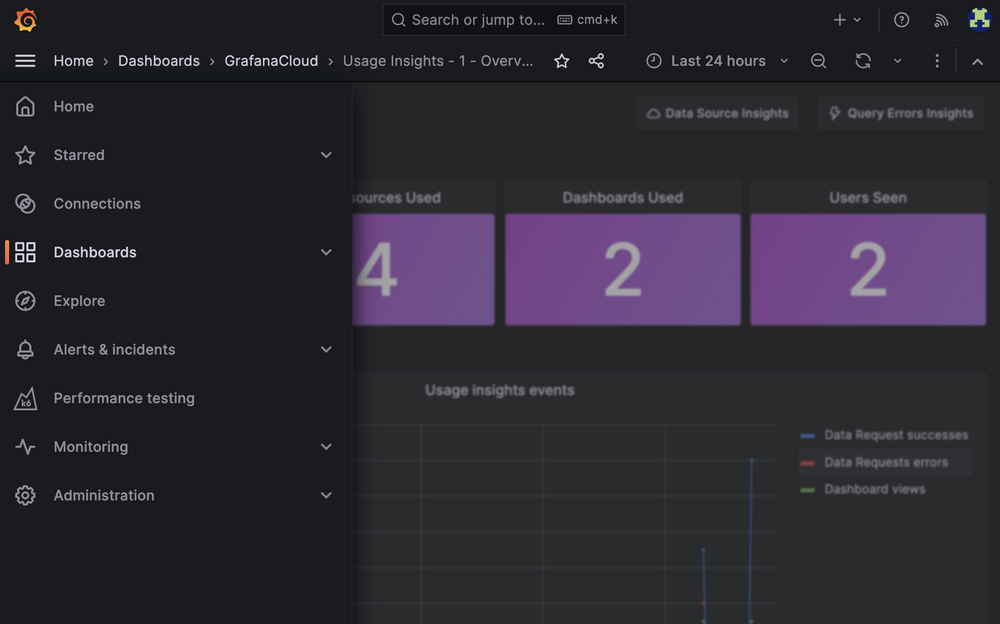
The navigation in Grafana has been updated with a new design and an improved structure to make it easier for you to access the data you need. With this update, you’ll be able to quickly navigate between features, giving you full visibility into the health of your systems.
The new navigation is gradually rolling out to all users on Grafana Cloud. If you’re using Grafana Open Source and Enterprise, you can enable this feature using the topnav feature toggle.
Note: The Grafana documentation has not yet been updated to reflect changes to the navigation.
Note: Plugin developers should refer to the migration guide to upgrade their plugins to work seamlessly with the new navigation layout.
Dashboards and visualizations
We’ve made the following changes to dashboards and visualizations. Learn more about dashboards in our dashboards documentation.
Dashboard panel redesign
Available to preview using the newPanelChromeUI feature toggle in all editions of Grafana.
Dashboard panels contain a lot of information, some of which is difficult to discover or access from the dashboard. With our redesigned panels, we’ve improved accessibility and made it easier to understand the status of a panel by adding and moving key elements.
We’ve rethought the panel information architecture, added additional interaction points, and reduced visual clutter. To start, we’ve improved the support of panels without a header, made a distinction between details set by you and data-induced information, and then included all essential components in the header of the panel. All of these are laid out from left to right in a row, so there are no overlapping, unusable components.
Grafana’s new panel is available only for React-based panels; no Angular-based panels are redesigned. For example, Angular-based panel will still have the old Graph and Table visualizations.
However, we have more planned: we’re going to make even more improvements to the accessibility of panels and improvements to panels without a header.
New data source connection page in Dashboards and Explore
Available to preview using the datasourceOnboarding feature toggle.
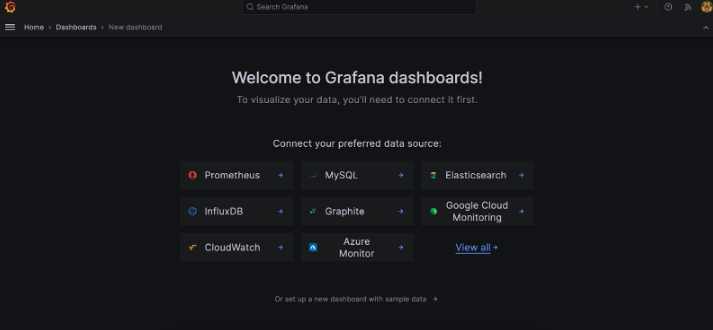
When you start your journey to create a dashboard or explore your data, but you don’t have a data source connected yet, you’ll be shown a page that guides you to set up a first connection.
Administrators can choose between selecting one of the most popular data sources or viewing the entire list. Editors are guided to contact their administrator to configure data sources. In both cases, there’s also an option to continue without setting up a data source and to use sample data instead.
Log details redesign
Generally available in all editions of Grafana.
We’ve updated the Details section of a log line. Previously some of the interactions, such as filtering, showing statistics, or toggling the visibility were split across Labels and Detected fields. With the recent changes those two sections are combined and the interactions are available for all fields.

Learn more about viewing logs in our Logs panel documentation.
Loki datasource query validation
Generally available in all editions of Grafana.
We added support to validate queries and visually display errors as a query is being written, without having to execute it to receive this feedback. This feature supports single and multi-line queries, with and without variables.

Learn more about viewing logs in our Logs panel documentation.
Loki logs sample in Explore
Generally available in all editions of Grafana.
For Loki metric queries in Explore, you can now see the sample of log lines that contributed to the displayed results. To see these logs, click on the collapsed Logs sample panel under your graph or table panel. If you want to interact with your log lines or modify the log query, click on the “Open logs in split view” button and the log query will be executed in the split view.

Canvas panel
Available in beta in all editions of Grafana
Canvas is a new panel that combines the power of Grafana with the flexibility of custom elements. Canvas visualizations are extensible form-built panels that allow you to explicitly place elements within static and dynamic layouts. This empowers you to design custom visualizations and overlay data in ways that aren’t possible with standard Grafana panels, all within Grafana’s UI. If you’ve used popular UI and web design tools, then designing Canvas panels will feel very familiar.
In Grafana v9.4, we have added the ability to create connections (arrows). Connections enable you to connect elements together to create more complex visualizations. We also added support for data links and a brand new server element. To learn more about the Canvas panel, refer to Canvas.
Auth and security
All auth updates are generally available in all editions of Grafana.
We’ve made the following changes to authentication and security.
Service account expiration dates
We have added a configuration option that enables you to require an expiration date limit for all newly created service account tokens.
This change will not affect existing tokens. However, newly created tokens will require an expiration date that doesn’t exceed the configuration option token_expiration_day_limit. This option is disabled by default.
Learn more about service accounts in our Service account documentation.
OAuth providers setting for skip org role sync
While Grafana integrates with many different auth providers, we have received requests for a feature that enables you to bypass organization role synchronization for individual providers rather than for all configured providers. This option is now available for users who want to be able to use Grafana to manage their org roles.
This option enables you to skip synchronization from your configured OAuth provider specifically in the auth provider section under skip_org_role_sync. Previously users could only do this for certain providers using the oauth_skip_org_role_sync_update option, but this would include all of the configured providers.
Learn more about Oauth in our Oauth configuration guide.
RBAC support for Grafana OnCall plugin
We’re rolling out RBAC support to Grafana plugins, with Grafana OnCall being the first plugin to fully support RBAC. Previously, Grafana OnCall relied on the Grafana basic roles (for example, Viewer, Editor, and Admin) for authorization within the plugin.
Before RBAC support in Grafana OnCall, it was only possible to allow your organization’s users to either view everything, edit everything, or be an admin (which allowed edit access plus a few additional behaviors). With this new functionality, organizations will be able to harness fine-grained access control within Grafana OnCall.
For example, you can assign a Viewer basic role to a user in your organization (users must still have a basic role assigned) and also assign them the new Grafana OnCall RBAC role of Schedules Editor. This assignment enables the user to view everything in Grafana OnCall, and edit OnCall schedules.
Learn more about role-based access control in our RBAC docs.
SAML auto login
We’ve added auto-login support for SAML authentication, which you can turn on with the auto_login configuration option. We also
have a unified configuration style among all authentication providers. Instead of using
oauth_auto_login, use the new auto_login option to enable automatic login for specific OAuth providers.
Learn more about SAML setup in our SAML configuration guide.
Auditing and Usage Insights: Support for Loki multi-tenancy
This feature is available for Enterprise customers
This feature adds support to push analytics events and auditing logs to Loki with multi-tenancy mode, by specifying a tenant id. Learn more about auditing and usage insights in our docs.
Reporting: Zoom in and out on your dashboard in a report PDF
This feature is available for Enterprise customers
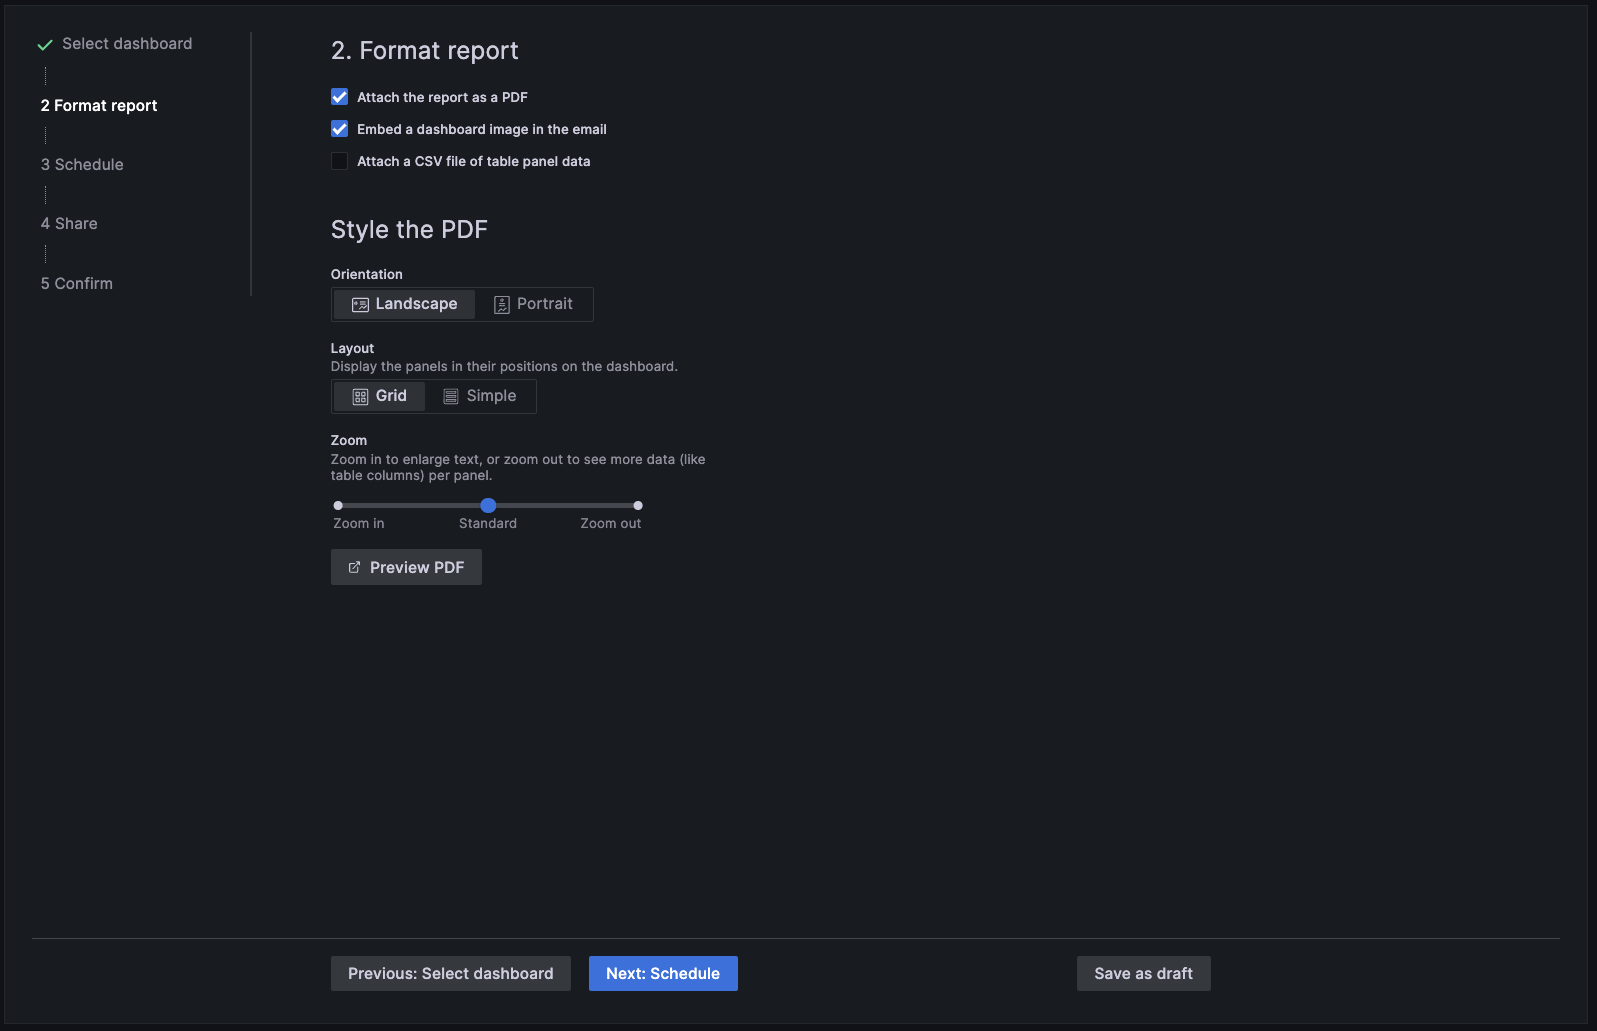
Zoom is a new feature for reports that allows you to change the dimension of the panels of the PDF document. It enables you to zoom out to show more columns in a table, or zoom in to enlarge panels. You can modify the scale factor for each report in the report editor when you share the PDF directly from the dashboard page.
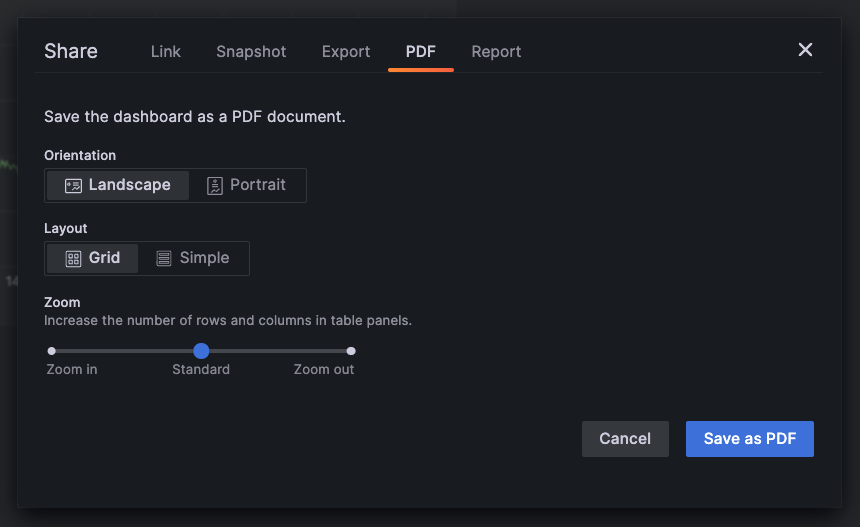
Learn more about reporting in our documentation
Alerting
We’ve made major improvements to Grafana Alerts, from new contact points and search options to improved workflows between Alerting and OnCall. For all the details, refer to our Alerting documentation.
Alerting: alert rules
We’ve made the following changes to alert rules.
Declare incidents from firing alerts
Declare an incident from a firing alert, streamlining the alert to incident workflow.

Copy alert rules and notification templates
To help you reuse existing alert rules or templates, make copies of alert rules from the Alert rule list view and templates from the Contact points page.

View query definitions for provisioned alerts
View read-only query definitions for provisioned alerts from the Alert rule details page. Check quickly if your alert rule queries are correct, without diving into your “as-code” repository for rule definitions.
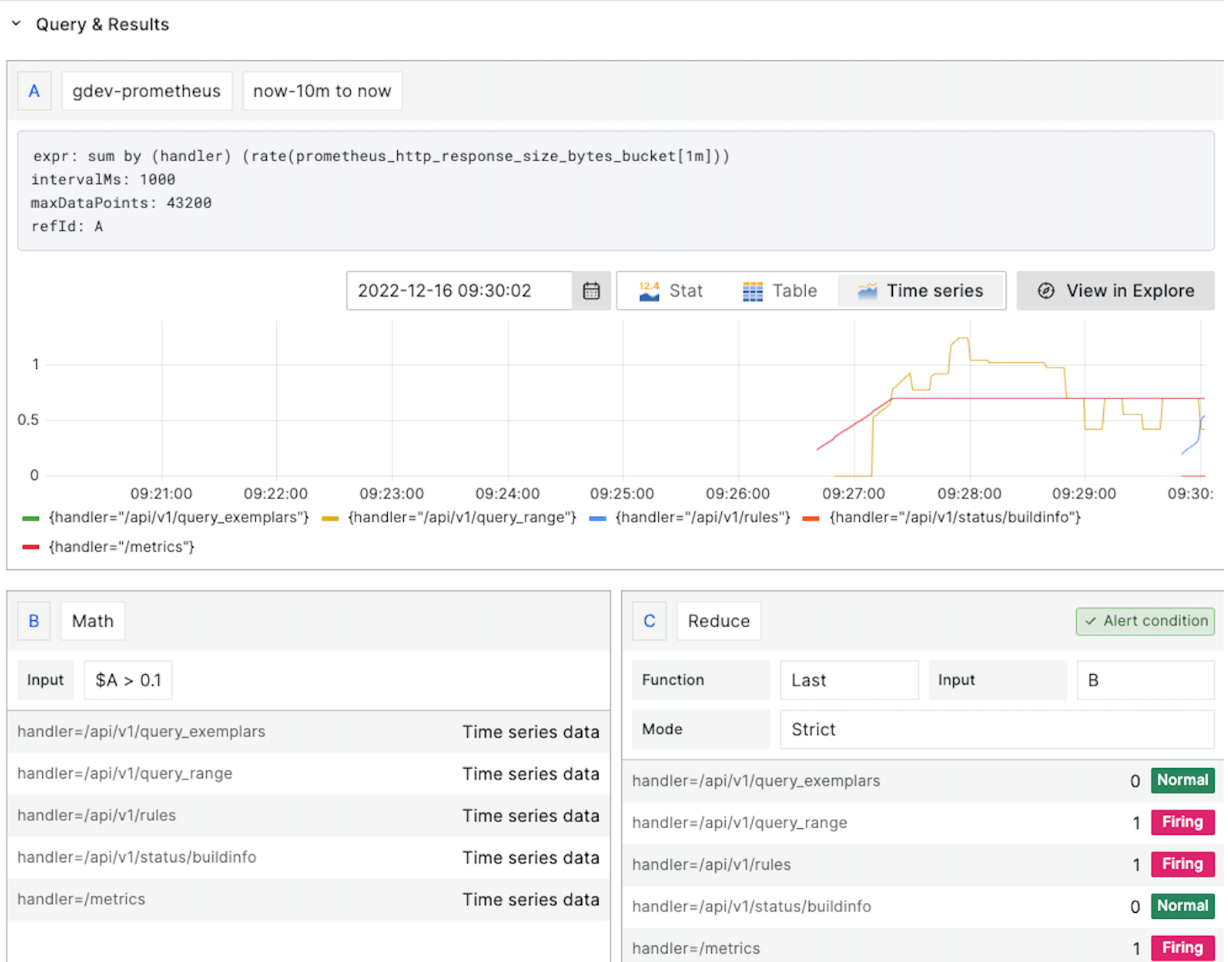
Export alert rules to use in the provisioning API or files
Create and tune an alert rule in the UI, then export to YAML or JSON, and use it in the provisioning API or files. You can also export an entire rule group to review or use. This is supported in both the UI and provisioning API.

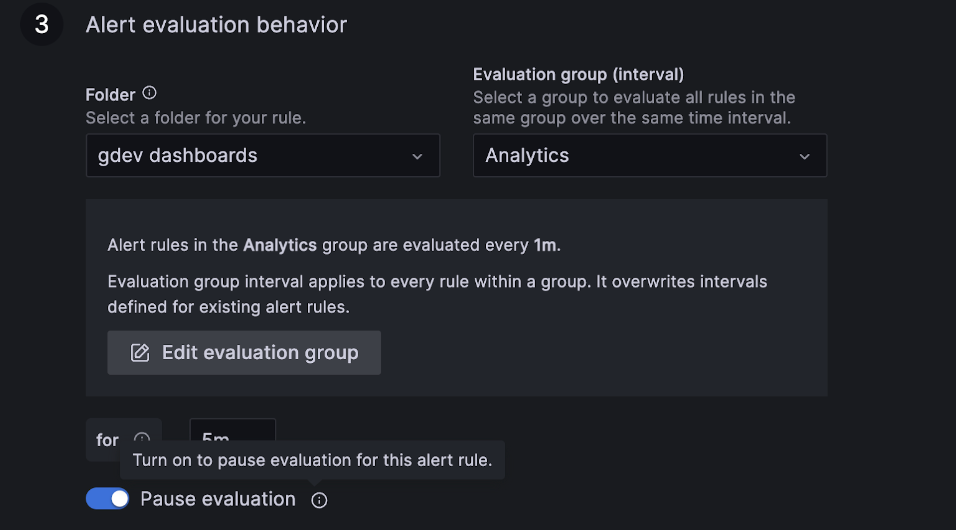
Pause alert rule evaluation
Pause alert rule evaluation to prevent noisy alerting while tuning your alerts. Pausing stops alert rule evaluation and does not create any alert instances. This is different to mute timings, which stop notifications from being delivered, but still allow for alert rule evaluation and the creation of alert instances.
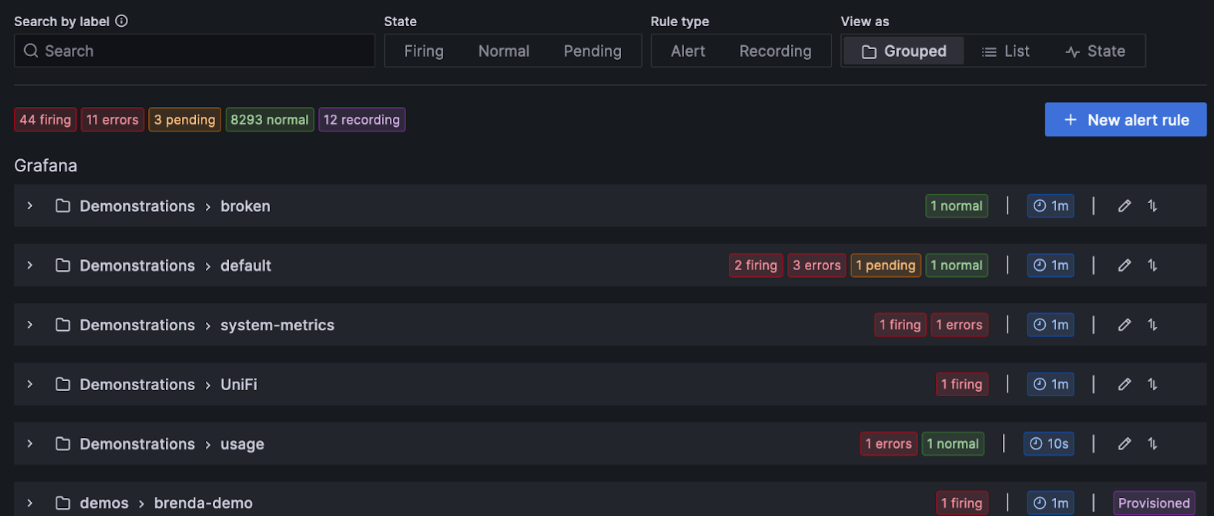
View an alert’s evaluation interval in Alert Group view
View the evaluation interval more easily from the grouped view on the Alert list page. The view now also always displays recording and normal alert rules and highlights alert rule status in different colors.
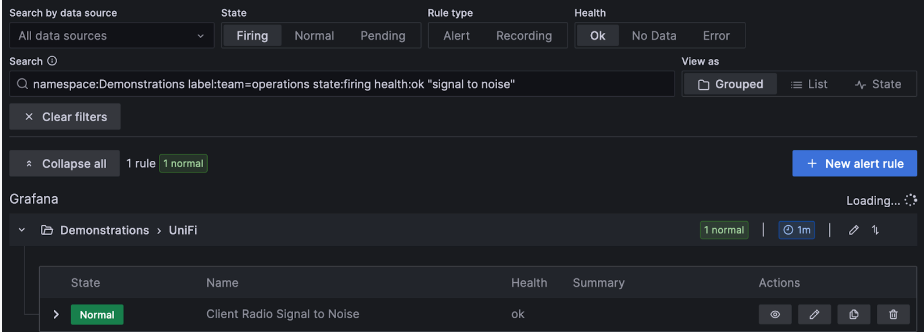
Improved search for your alert rules
When managing large volumes of alerts, use extended alert rule search capabilities to filter folders, evaluation groups, and rules. Additionally, you can filter alert rules by their properties like labels, state, type, and health.
Adjust the amount and resolution of data used in your alerting queries
Lower costs and improve performance by adjusting the maximum number of data points returned from your alerting queries.
Edit alert rule evaluation interval
Simplifies editing the evaluation interval for an alert rule within a new group. You no longer have to save the alert rule and group before editing the evaluation interval.
Alerting: contact points
We’ve made the following changes to alert contact points.
View Grafana OnCall contact point
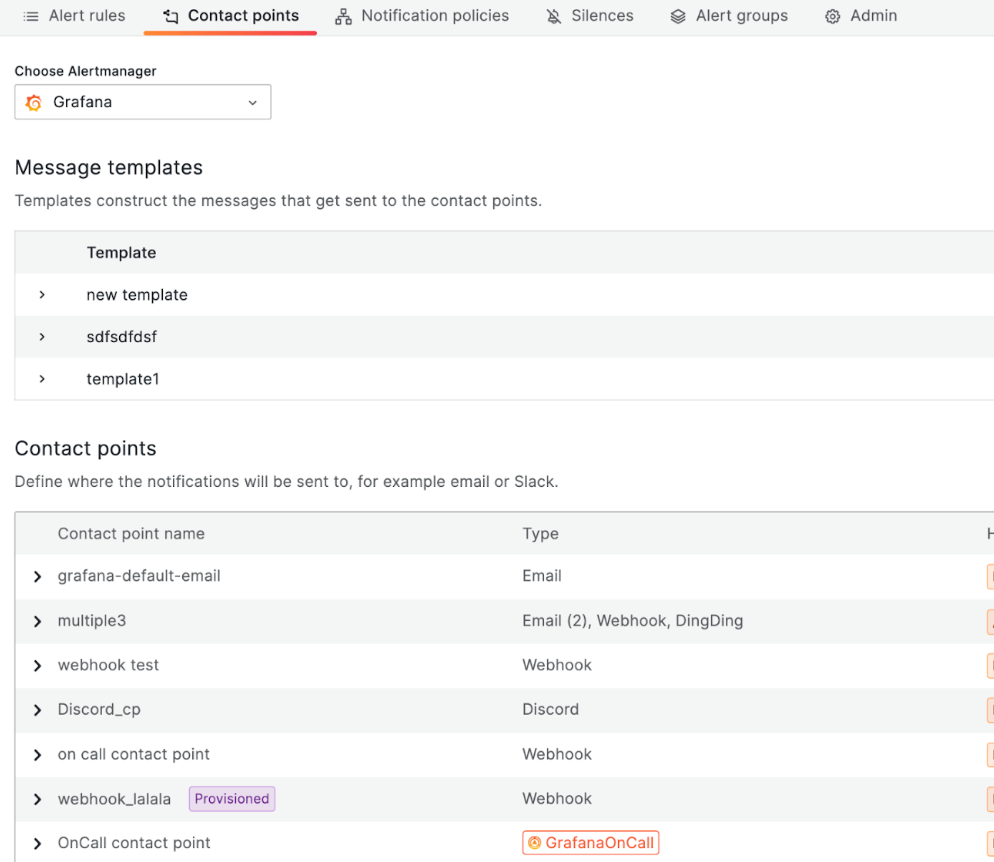
Connecting your OnCall workflows just got easier. OnCall has been added as a contact point to simplify the integration between alert notifications and your OnCall implementation.
Alert email templating
We’ve improved the design and functionality of email templates to make template creation much easier and more customizable. The email template framework utilizes MJML to define and compile the final email HTML output. Sprig functions in the email templates provide more customizable template functions.

Add support for Discord as a contact point receiver
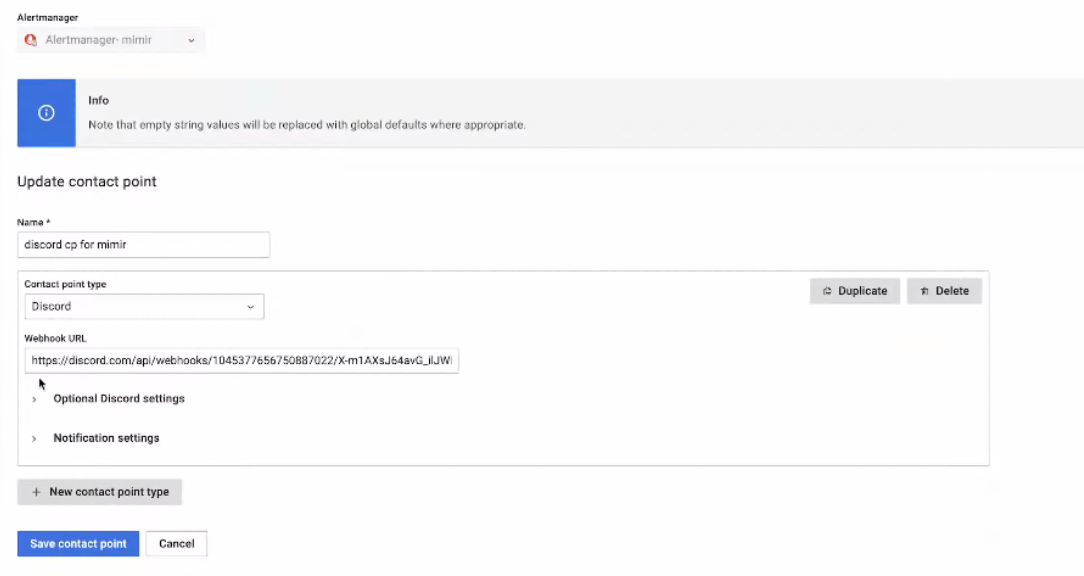
We’ve added Discord as a contact point receiver for Grafana Cloud alert rules.
Alerting: administration
We’ve made the following changes to alert administration.
Alerting landing page
Introduces a new landing page that helps you get started quickly with Alerting. It also provides you with at a glance information on how Alerting works and a video to introduce you to key concepts.

Compatibility with AWS Aurora
Grafana Alerting is now compatible with AWS Aurora, but does not provide technical support for it.
Enterprise Datasources
We’ve made improvements to all Enterprise Datasources, fixing small bugs, and updating libraries. We’ve also added many new features and support for additional APIs. Refer to each datasource’s documentation and the change log for additional information.
DataDog Datasource
We’ve added support for many new query types, including: SLO/SLI Values, RUM data, Events, and monitor group status.
Dynatrace Datasource
We’ve updated the Metric Selector to be faster and added support for filtering by management zone. We’ve also added support for Log Queries and querying the Dynatrace audit log.
GitLab Datasource
We’ve added support for many new query types, including: Audit events, Users, Merge request approvals, Field tags, Environments, and Pipelines.
Honeycomb Datasource
We’ve added support for derived columns and Honeycomb Environments.
NewRelic Datasource
We’ve added support for trace search, log search, and support for NRQL histogram queries.
Salesforce Datasource
We’ve added support for JWT authentication.
Snowflake Datasource
We’ve added support for custom session parameters.
Postgres, MySQL, and MSSQL data sources
The database property is now under the jsonData key in the data source configuration. This change is backward compatible, and existing configurations will continue to work.
Before you upgrade
There are no known breaking changes associated with this version of Grafana.


