This is documentation for the next version of Grafana. For the latest stable release, go to the latest version.
What’s new in Grafana v9.2
Welcome to Grafana v9.2, a hefty minor release with a swath of improvements that help you create and share dashboards and alerts. Read on to learn about progress on public dashboards, our new panel help menu, custom branding in Grafana Enterprise, and improvements to access control. If you’d prefer to dig into the details, check out the complete changelog.
Panel help menu
Available in beta in Grafana Open Source.
Dashboard panel issues can occur for all kinds of reasons, from problems processing data to issues with rendering or configuration. Shorten your communication time when reporting issues and requesting help from Grafana Labs by retrieving a panel’s query response data and panel settings. This will help the support team reproduce, diagnose, and fix the issue as quickly as possible. See our documentation for more info.
For details, see GitHub issue #55005 and “Send a panel to Grafana Labs support” in the documentation.

Canvas panel
Available in beta in Grafana Open Source.
Introducing the Canvas panel, a new panel that combines the power of Grafana with the flexibility of custom elements. Canvas visualizations are extensible form-built panels that allow you to explicitly place elements within static and dynamic layouts. This empowers you to design custom visualizations and overlay data in ways that aren’t possible with standard Grafana panels, all within Grafana’s UI. If you’ve used popular UI and web design tools, then designing Canvas panels will feel very familiar.
For example, you can place image layers and then overlay text that’s updated by Grafana data sources, and display icons that can change color conditionally based on data.
We’ve planned additional features and design elements for future releases to make Canvas panels even more powerful tools for creating custom, interactive, data-driven visualizations. To learn more about the Canvas panel, see the documentation.
Support for Google Analytics 4 properties
Generally available in Grafana Open Source.
You can now use Google Analytics 4 (GA4) to track usage of Grafana. To enable tracking with GA4, specify your property’s measurement ID in Grafana’s configuration file. Read more in our documentation.
Google Analytics 4 replaces Universal Analytics, which will stop processing hits in 2023 (July 1 for free accounts, October 1 for Google Analytics 360). You can continue using Universal Analytics with Grafana and send analytics data to both types of properties.
Alertmanager updated to be based on Prometheus Alertmanager v0.24
Generally available in all editions.
The Alertmanager used for Grafana-managed alert rules is now based on the latest release of the Prometheus Alertmanager, v0.24. We continue to unify the different Alertmanagers that you can use with Grafana Alertmanager and will provide updates on this topic in a future release of Grafana.
For details, see GitHub pull request #53555.
Grafana Alerting alert rules now return an Error state by default on execution error or timeout
Generally available in all editions.
Error rules created with Grafana Alerting were previously switching to an Alerting state when the rule was facing an execution error or timeout.
New error rules now switch by default to the Error state when failing to execute or timing out.
You can change this default to either Alerting or OK.
This change does not update existing alert rules.
For details on this change, see GitHub pull request #55345. For more information about alerting states, see the alerting documentation.
Configure external alertmanagers as data sources
Generally available in all editions.
Starting with release 9.2, the URL configuration of external alertmanagers from the Admin tab on the Alerting page is deprecated. It will be removed in a future release.
External alertmanagers should now be configured as data sources using Grafana Configuration from the main Grafana navigation menu. This enables you to manage the contact points and notification policies of external alertmanagers from within Grafana and also encrypts HTTP basic authentication credentials that were previously visible when configuring external alertmanagers by URL.
Public dashboards
Available in Experimental in Grafana Open Source, Enterprise, and Cloud. To enable public dashboards, you must enable a feature flag or request this feature from support.
Public dashboards launched as an experimental feature in Grafana v9.1. We’ve received lots of great feedback on this much-anticipated feature and thank everyone who has helped us improve it. The team has been hard at work polishing public dashboards, and we’ve closed quite a few bugs related to community reports. If you’re trying out public dashboards, let us know how it is going in the open discussion in GitHub. Beyond bug fixes, we’re excited to share some new features:
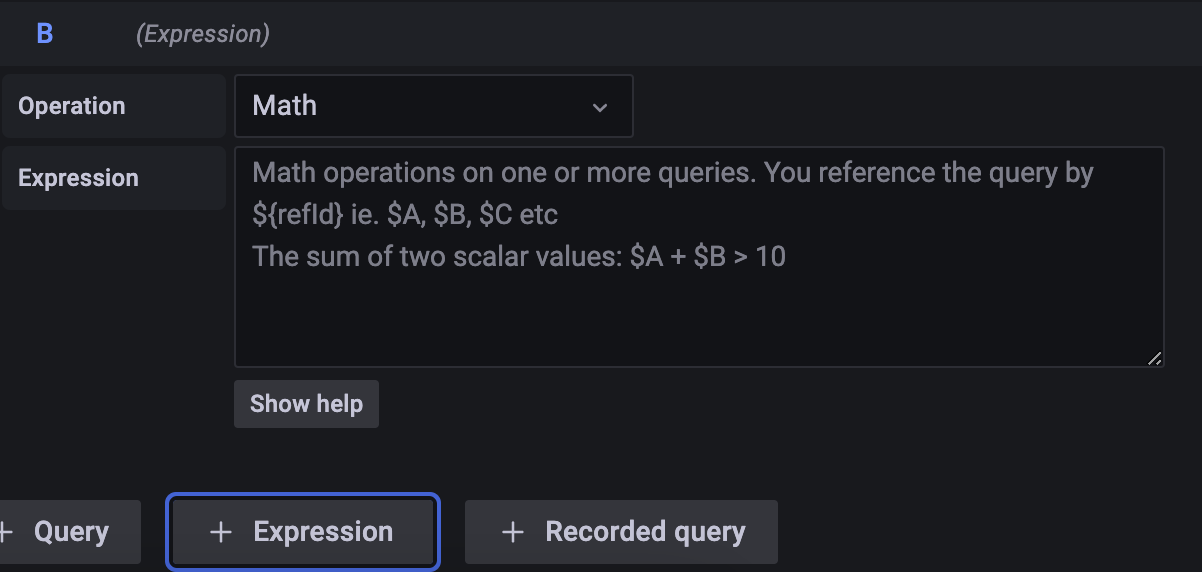
Expression support
We have added the ability to use expressions for your public dashboards.
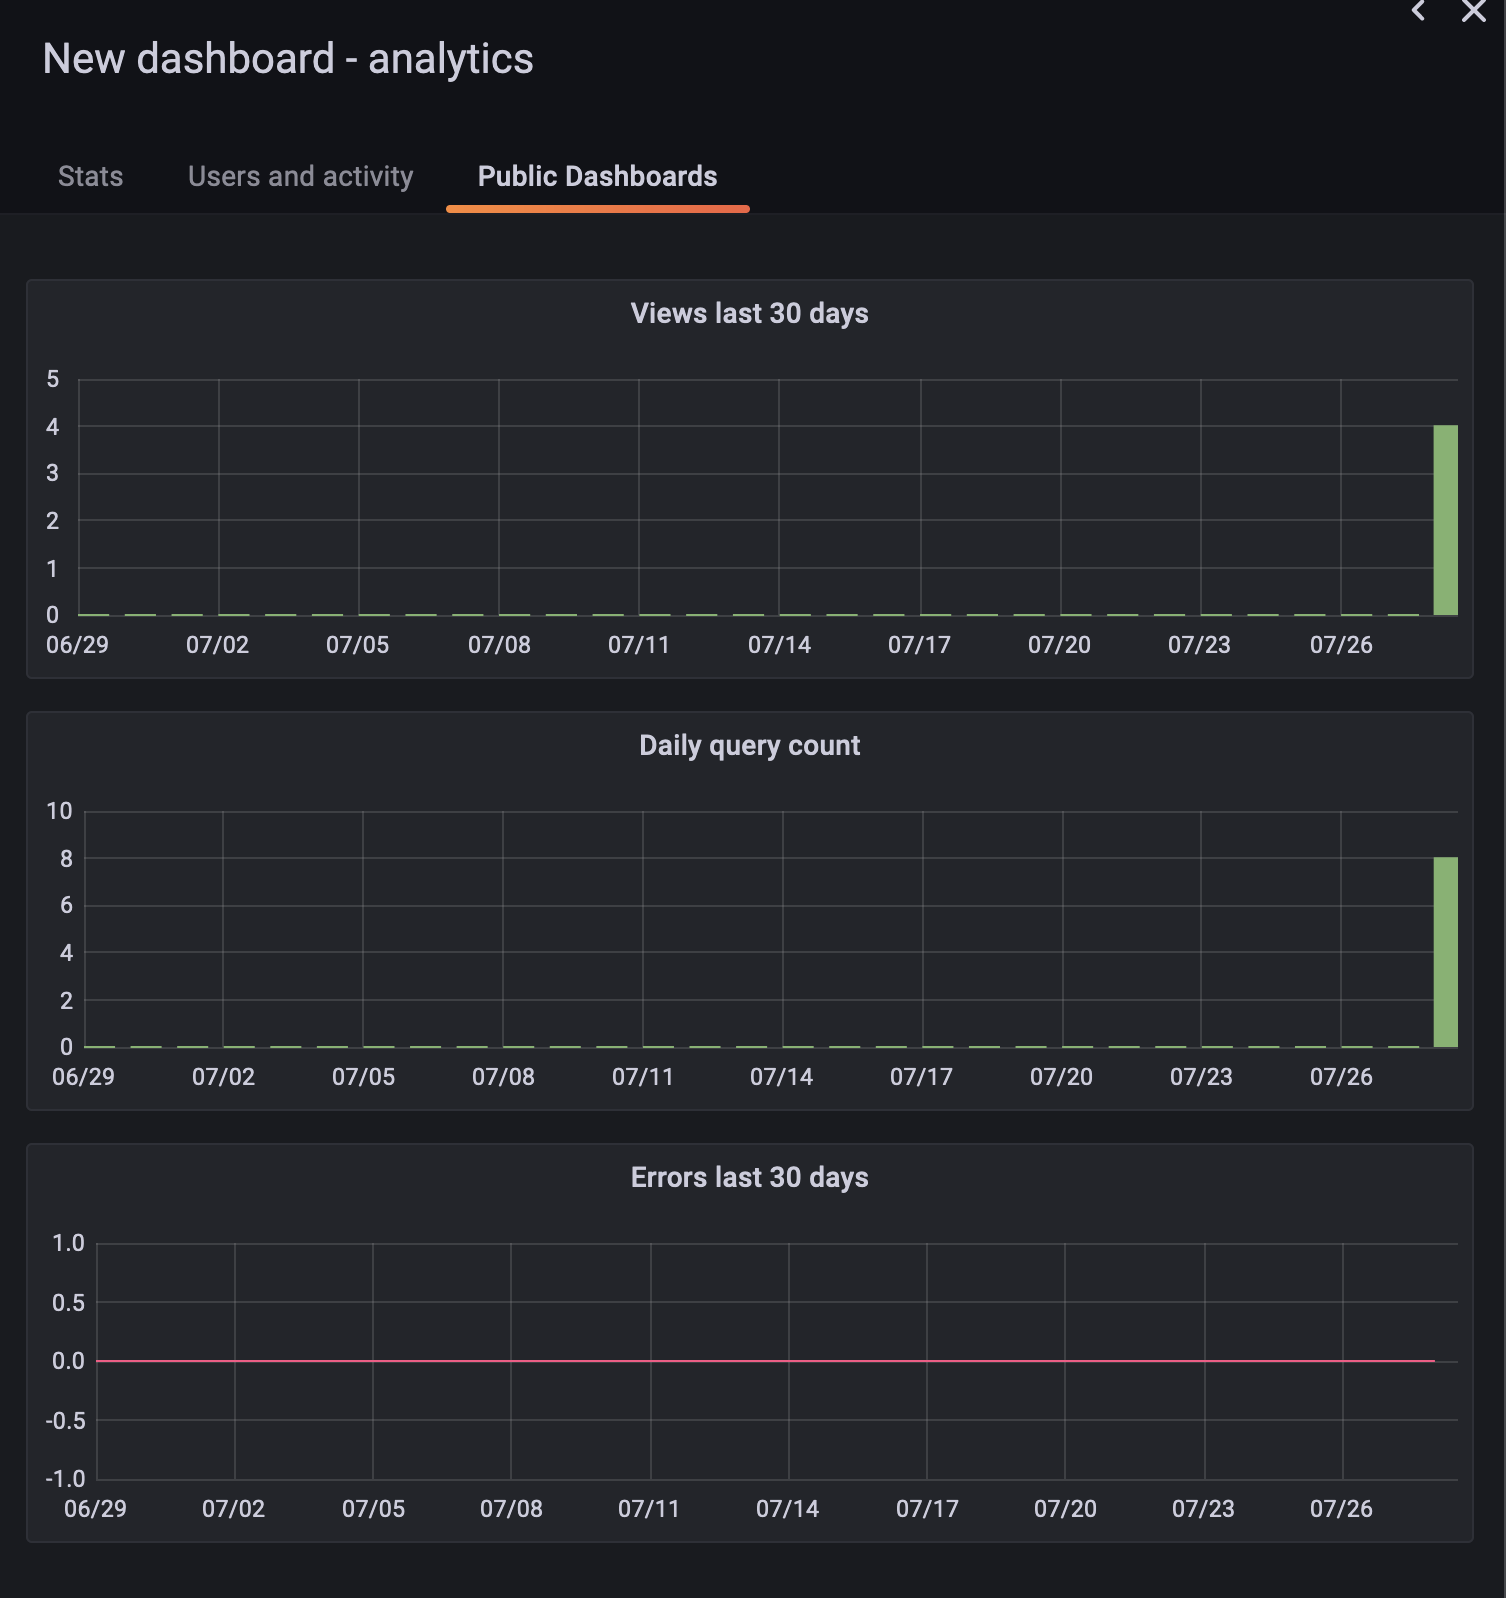
Public dashboard usage insights
Available in Experimental in Grafana Enterprise.
Usage Insights now has a “Public Dashboards” tab, which tracks how many people are viewing your public dashboard and how many queries have ran, and counts errors.
Use RBAC to allow any user to share dashboards publicly
RBAC is available in Grafana Enterprise and Cloud.
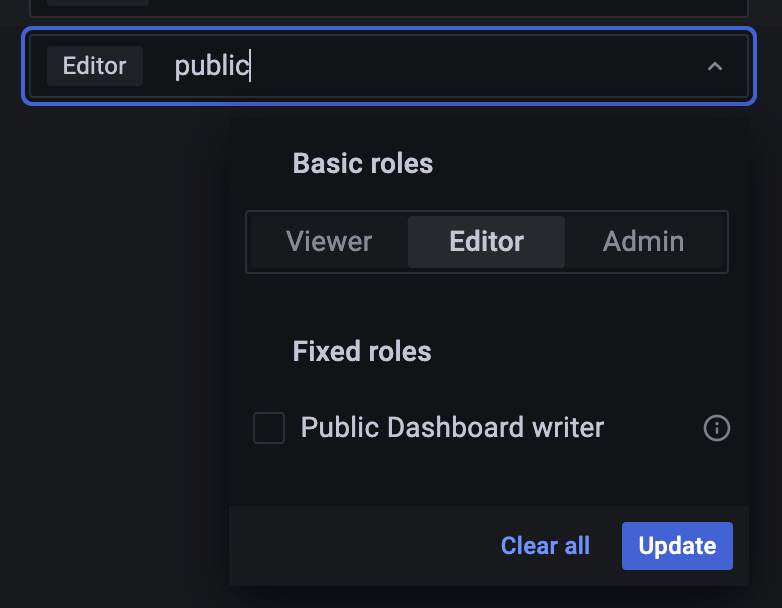
We have introduced a new role called “Public Dashboard writer” that grants access to publish new public dashboards to additional roles and users. By default, only admins can share dashboards publicly.
Revamped UI for Google Cloud monitoring
Generally available in Grafana Open Source and Grafana Cloud Free, Pro, and Advanced.
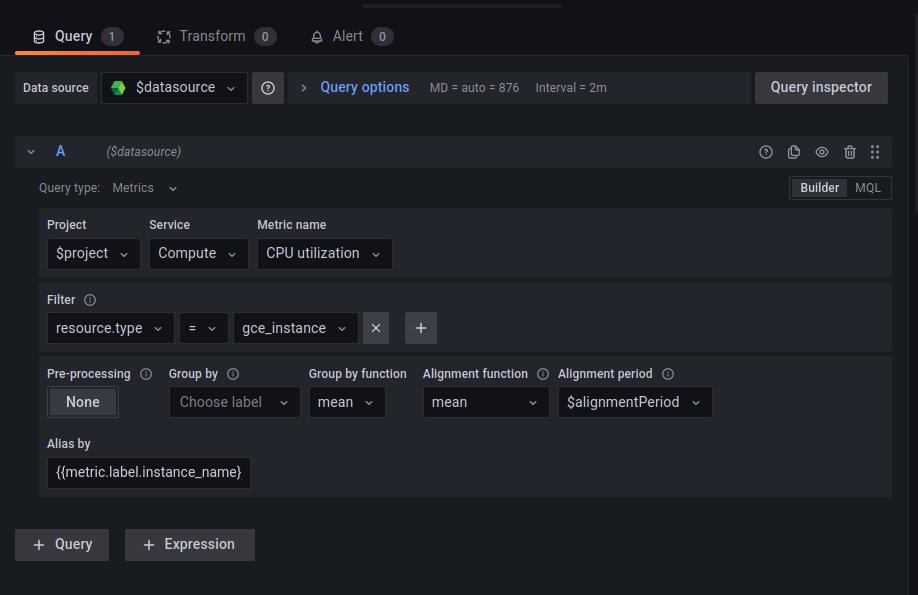
The Google Cloud monitoring data source UI has been brought up to date with the latest Grafana UI design. This new interface provides a more consistent experience as you switch between different data sources. It also groups query builder items together more logically, so it’s easier to write queries. In the case of Cloud monitoring, the query builder’s groupings should more closely match the groupings in Google’s Cloud console.
App Plugins: better handling for secure fields
Plugin developers can mark certain fields as secure to encrypt those fields in Grafana’s database. This is important for sensitive fields like data source passwords or API keys. Previously, plugin developers needed to manually track which fields were labeled secure. We have extended our plugins platform to simplify this, which means one less thing for developers to worry about and better security for all users’ data. For details on using this functionality, see GitHub pull request #55313 and our plugin examples repository.
Transformations: INNER JOINs
Transformations allow you to shape raw data from data sources, like metrics series or GitHub issues, into a format that’s appropriate for the chosen visualization. We have extended the Join transformation to support INNER JOINs in addition to OUTER JOINs. These work similarly to SQL JOINs.
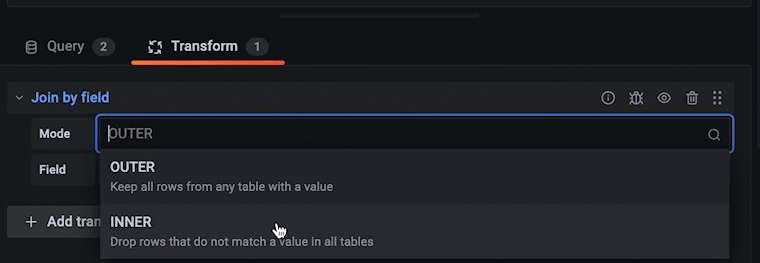
Also, you can now click on the x to clear values in the select fields for the OUTER JOIN and Grouping to Matrix transformations as expected.
Simplified UI to create template variable queries for Loki data source
Generally available in Grafana Open Source.
We have significantly simplified and improved the way you can create template variable queries for Loki data sources in dashboards. Use drop-downs to choose query type, label, and stream selector, without needing to worry about templating query syntax. For more information, refer to Loki data source documentation.

Authentication and authorization
Teams can be empty or without any Admin user
Generally available in all editions.
You can now leave a team empty without any users, or have only Members in a team. This helps you sync teams and users from a single sign-on provider like Active Directory or Okta, or if you use teams as collections of permissions. Previously, teams required at least one Admin user to be in a team.

Role-based access control is easier to use
Generally available in Grafana Enterprise and Grafana Cloud.
Role picker when creating and editing teams
You can now choose a team’s roles and permissions when creating a new team or editing an existing team, which helps you grant permissions to teams more efficiently. Previously, you could assign roles only when looking at a list of all teams.

RBAC: Organize custom roles into groups
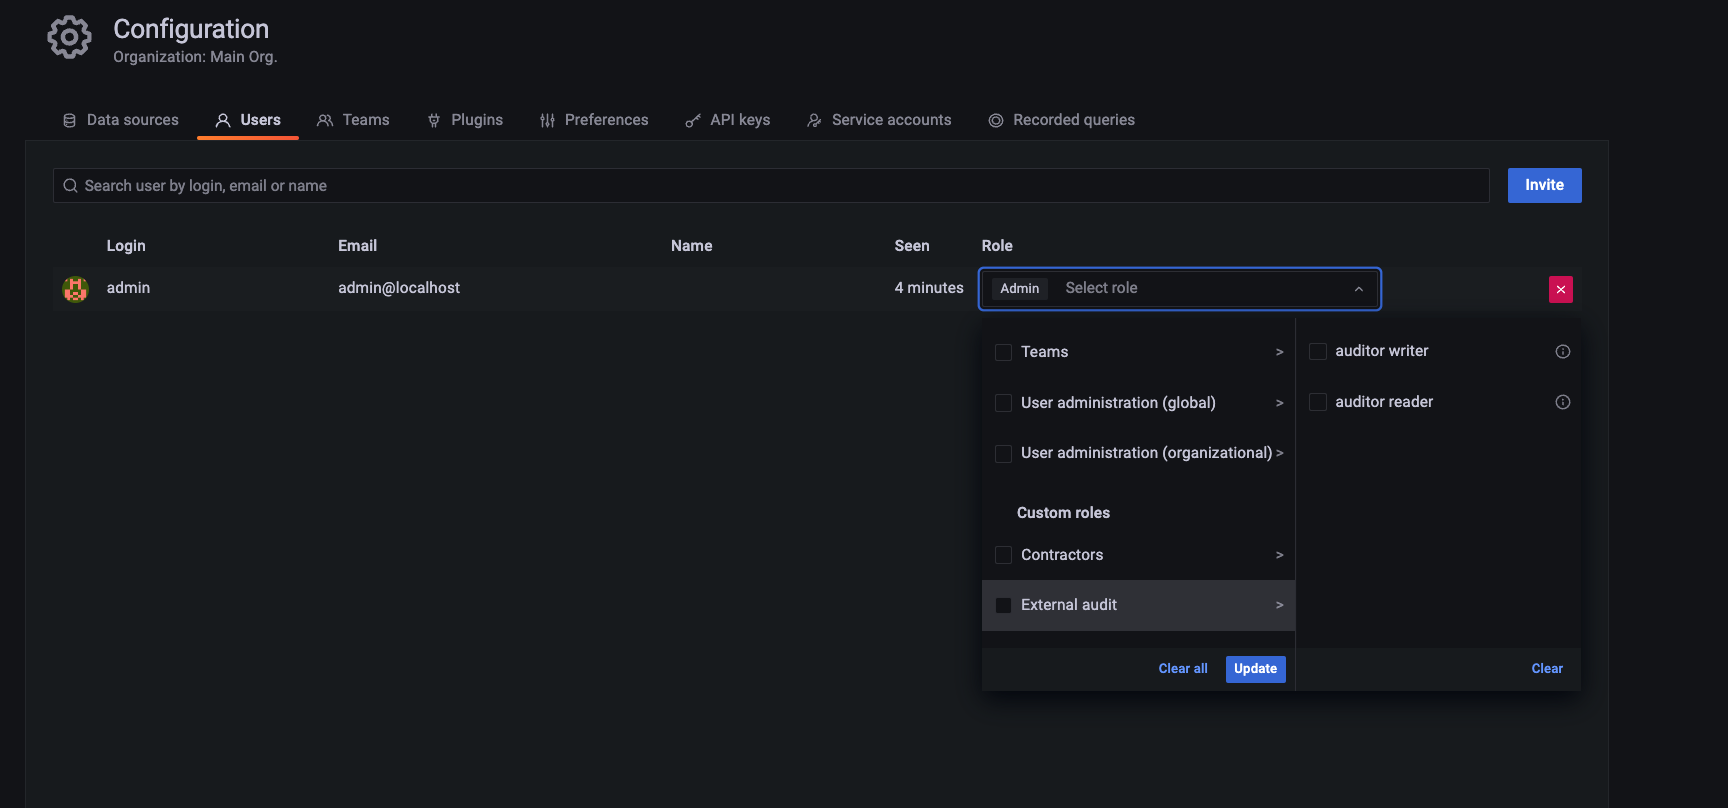
If you create many custom roles in Grafana – for example, different roles for editing specific dashboards or folders, or specific roles for certain teams in your company – you can now organize them into groups for more efficient navigation, browsing, and custom role assignment. For more information on custom roles, see the documentation.
RBAC: Terraform resource for assigning fixed and custom roles to users, teams, and service accounts
You can now assign fixed and custom roles to users, teams, and service accounts with the Grafana role_assignment resource in Terraform. This allows you to provision user permissions in a version-able, repeatable way if you use Terraform. Learn more in the documentation for Grafana’s Terraform provider.
SAML role mapping improvements
Generally available in Grafana Enterprise, Grafana Cloud Pro, and Advanced.
Map a user to all organizations in Grafana
You can now use * as the Grafana organization in the mapping to add all users from a given SAML Organization to all existing Grafana organizations.
For more information, see “Configure SAML authentication” in the documentation.
Skip organization role sync
Generally available in Grafana Enterprise, Grafana Cloud Pro, and Advanced.
If you use a SAML identity provider to manage your users but prefer to assign roles and permissions in the Grafana UI or via API, you can now enable a configuration option to skip user organization and roles synchronization with your SAML provider.
Use the skip_org_role_sync configuration option when configuring SAML to prevent synchronization with SAML roles and make user roles editable from within Grafana.
For more information, see the SAML configuration documentation.
Assign Server Admin permissions from Oauth
You can now map OAuth groups and roles to Server Admin for the GitLab, GitHub, AzureAD, Okta, and Generic OAuth integrations.
To enable this functionality, set the allow_assign_grafana_admin configuration option to true in the desired OAuth integration section.
For more information, see the authentication configuration documentation for each OAuth client.
Match parameter support in prometheus labels API
Prometheus users running Prometheus v2.24 and higher can use the labels endpoint instead of the series endpoint for the label_values function.
This decreases load times for templated high-cardinality Prometheus instances.
If you want to benefit from this endpoint you must first configure the Prometheus type and version in any Prometheus data sources’ configuration.
New Prometheus streaming parser
In Grafana v9.2, you can enable the prometheusStreamingJSONParser feature toggle to use a better-performing, memory-efficient streaming JSON client for Prometheus.
We’ll make this client the default in Grafana v9.3.
When Prometheus returns NaN values, this new client doesn’t change them, neither to the value null nor to 0 as in recent Grafana versions.
If you use this new Prometheus streaming parser with Grafana Managed Alerts, this change in behavior might trigger alerts.
To avoid this, select the “Drop non-numeric values” option in the Reduce expression to drop NaN values.


