This is documentation for the next version of Grafana. For the latest stable release, go to the latest version.
Elasticsearch data source
Elasticsearch is a search and analytics engine used for a variety of use cases. You can create many types of queries to visualize logs or metrics stored in Elasticsearch, and annotate graphs with log events stored in Elasticsearch.
The following will help you get started working with Elasticsearch and Grafana:
- What is Elasticsearch?
- Configure the Elasticsearch data source
- Elasticsearch query editor
- Elasticsearch template variables
Supported Elasticsearch versions
This data source supports these versions of Elasticsearch:
- v7.17+
- v8.x
Our maintenance policy for Elasticsearch data source is aligned with the Elastic Product End of Life Dates and we ensure proper functionality for supported versions. If you are using an Elasticsearch with version that is past its end-of-life (EOL), you can still execute queries, but you will receive a notification in the query builder indicating that the version of Elasticsearch you are using is no longer supported. It’s important to note that in such cases, we do not guarantee the correctness of the functionality, and we will not be addressing any related issues.
Provision the data source
You can define and configure the data source in YAML files as part of Grafana’s provisioning system. For more information about provisioning, and for available configuration options, refer to Provisioning Grafana.
Note
The previously used
databasefield has now been deprecated. You should now use theindexfield injsonDatato store the index name. Please see the examples below.
Provisioning examples
Basic provisioning
apiVersion: 1

datasources:
  - name: Elastic
    type: elasticsearch
    access: proxy
    url: http://localhost:9200
    jsonData:
      index: '[metrics-]YYYY.MM.DD'
      interval: Daily
      timeField: '@timestamp'
Provision for logs
apiVersion: 1

datasources:
  - name: elasticsearch-v7-filebeat
    type: elasticsearch
    access: proxy
    url: http://localhost:9200
    jsonData:
      index: '[filebeat-]YYYY.MM.DD'
      interval: Daily
      timeField: '@timestamp'
      logMessageField: message
      logLevelField: fields.level
      dataLinks:
        - datasourceUid: my_jaeger_uid # Target UID needs to be known
          field: traceID
          url: '$${__value.raw}' # Careful about the double "$$" because of env var expansion
Configure Amazon Elasticsearch Service
If you use Amazon Elasticsearch Service, you can use Grafana’s Elasticsearch data source to visualize data from it.
If you use an AWS Identity and Access Management (IAM) policy to control access to your Amazon Elasticsearch Service domain, you must use AWS Signature Version 4 (AWS SigV4) to sign all requests to that domain.
For details on AWS SigV4, refer to the AWS documentation.
AWS Signature Version 4 authentication
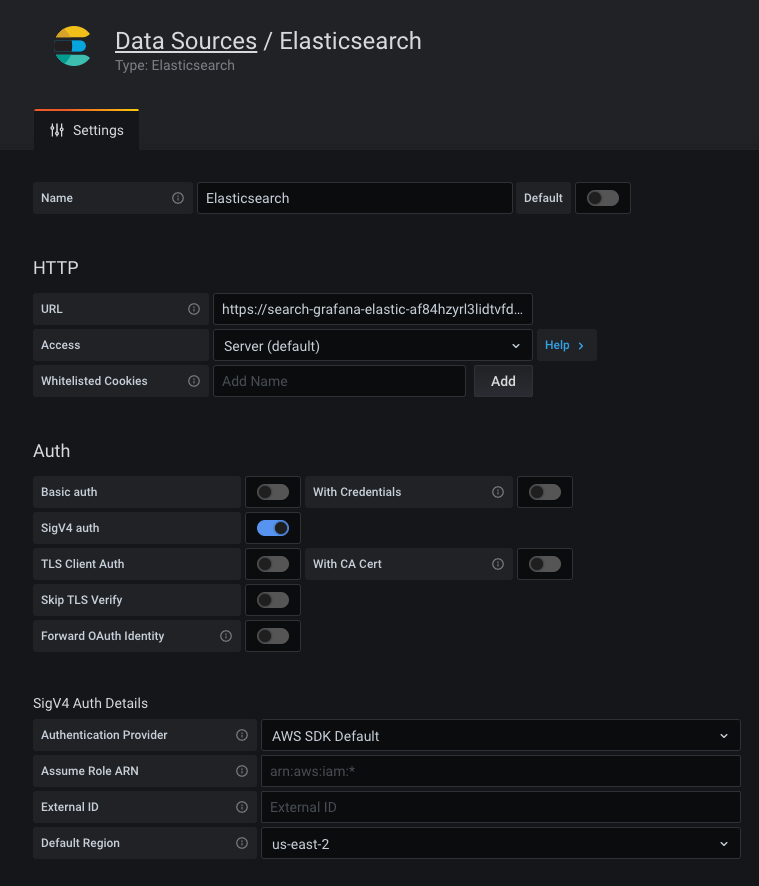
To sign requests to your Amazon Elasticsearch Service domain, you can enable SigV4 in Grafana’s configuration.
Once AWS SigV4 is enabled, you can configure it on the Elasticsearch data source configuration page. For more information about AWS authentication options, refer to AWS authentication.

Query the data source
You can select multiple metrics and group by multiple terms or filters when using the Elasticsearch query editor.
For details, see the query editor documentation.
Use template variables
Instead of hard-coding details such as server, application, and sensor names in metric queries, you can use variables. Grafana lists these variables in dropdown select boxes at the top of the dashboard to help you change the data displayed in your dashboard. Grafana refers to such variables as template variables.
For details, see the template variables documentation.


