This is documentation for the next version of Grafana. For the latest stable release, go to the latest version.
Azure Monitor query editor
This topic explains querying specific to the Azure Monitor data source. For general documentation on querying data sources in Grafana, see Query and transform data.
Choose a query editing mode
The Azure Monitor data source’s query editor has three modes depending on which Azure service you want to query:
- Metrics for Azure Monitor Metrics
- Logs for Azure Monitor Logs
- Azure Resource Graph
- Traces for Application Insights Traces
Query Azure Monitor Metrics
Azure Monitor Metrics collects numeric data from supported resources, and you can query them to investigate your resources’ health and usage and maximise availability and performance.
Monitor Metrics use a lightweight format that stores only numeric data in a specific structure and supports near real-time scenarios, making it useful for fast detection of issues. In contrast, Azure Monitor Logs can store a variety of data types, each with their own structure.

Create a Metrics query
To create a Metrics query:
In a Grafana panel, select the Azure Monitor data source.
Select the Metrics service.
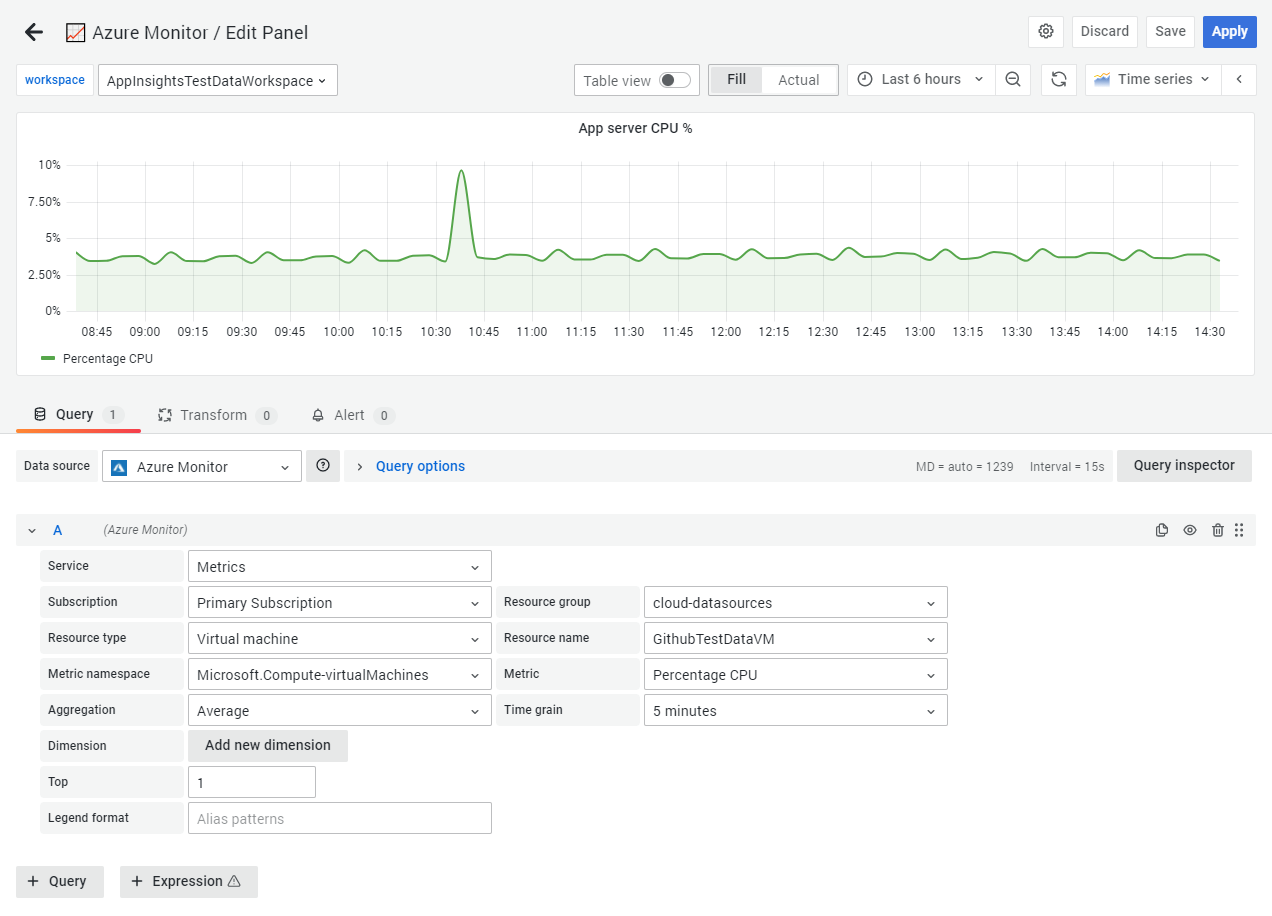
Select a resource from which to query metrics by using the subscription, resource group, resource type, and resource fields. Multiple resources can also be selected as long as they belong to the same subscription, region and resource type. Note that only a limited amount of resource types support this feature.
To select a different namespace than the default—for instance, to select resources like storage accounts that are organized under multiple namespaces—use the Namespace option.
Note
Not all metrics returned by the Azure Monitor Metrics API have values.The data source retrieves lists of supported metrics for each subscription and ignores metrics that never have values.
Select a metric from the Metric field.
Optionally, you can apply further aggregations or filter by dimensions.
- Change the aggregation from the default average to show minimum, maximum, or total values.
- Specify a custom time grain. By default, Grafana selects a time grain interval for you based on your selected time range.
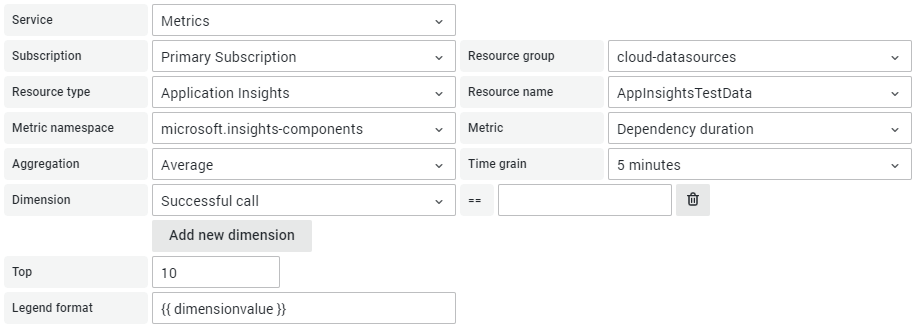
- For metrics with multiple dimensions, you can split and filter the returned metrics. For example, the Application Insights dependency calls metric supports returning multiple time series for successful and unsuccessful calls.

The available options change depending on what is relevant to the selected metric.
You can also augment queries by using template variables.
Format legend aliases
You can change the legend label for Metrics by using aliases. In the Legend Format field, you can combine aliases defined below any way you want.
For example:
Blob Type: {{ blobtype }}becomesBlob Type: PageBlob,Blob Type: BlockBlob{{ resourcegroup }} - {{ resourcename }}becomesproduction - web_server
| Alias pattern | Description |
|---|---|
{{ subscriptionid }} | Replaced with the subscription ID. |
{{ subscription }} | Replaced with the subscription name. |
{{ resourcegroup }} | Replaced with the resource group. |
{{ namespace }} | Replaced with the resource type or namespace, such as Microsoft.Compute/virtualMachines. |
{{ resourcename }} | Replaced with the resource name. |
{{ metric }} | Replaced with the metric name, such as “Percentage CPU”. |
{{ arbitraryDimensionID }} | Replaced with the value of the specified dimension. For example, {{ blobtype }} becomes BlockBlob. |
{{ dimensionname }} | (Legacy for backward compatibility) Replaced with the name of the first dimension. |
{{ dimensionvalue }} | (Legacy for backward compatibility) Replaced with the value of the first dimension. |
Filter using dimensions
Some metrics also have dimensions, which associate additional metadata. Dimensions are represented as key-value pairs assigned to each value of a metric. Grafana can display and filter metrics based on dimension values.
The data source supports the equals, not equals, and starts with operators as detailed in the Monitor Metrics API documentation.
For more information on multi-dimensional metrics, refer to the Azure Monitor data platform metrics documentation and Azure Monitor filtering documentation.
Query Azure Monitor Logs
Azure Monitor Logs collects and organises log and performance data from supported resources, and makes many sources of data available to query together with the Kusto Query Language (KQL).
While Azure Monitor Metrics stores only simplified numerical data, Logs can store different data types, each with their own structure. You can also perform complex analysis of Logs data by using KQL.

Create a Logs query
To create a Logs query:
In a Grafana panel, select the Azure Monitor data source.
Select the Logs service.
Select a resource to query. Multiple resources can be selected as long as they are of the same type.
Alternatively, you can dynamically query all resources under a single resource group or subscription.
Note
If a timespan is specified in the query, the overlap of the timespan between the query and the dashboard will be used as the query timespan. See the API documentation for details.Enter your KQL query.
You can also augment queries by using template variables.
Logs query examples
Azure Monitor Logs queries are written using the Kusto Query Language (KQL), a rich language similar to SQL.
The Azure documentation includes resources to help you learn KQL:
- Log queries in Azure Monitor
- Getting started with Kusto
- Tutorial: Use Kusto queries in Azure Monitor
- SQL to Kusto cheat sheet
Time-range: The time-range that will be used for the query can be modified via the time-range switch. Selecting
Querywill only make use of time-ranges specified within the query. SpecifyingDashboardwill only make use of the Grafana time-range. If there are no time-ranges specified within the query, the default Log Analytics time-range will apply. For more details on this change, refer to the Azure Monitor Logs API documentation. If theIntersectionoption was previously chosen it will be migrated by default toDashboard.
This example query returns a virtual machine’s CPU performance, averaged over 5ms time grains:
Perf
# $__timeFilter is a special Grafana macro that filters the results to the time span of the dashboard
| where $__timeFilter(TimeGenerated)
| where CounterName == "% Processor Time"
| summarize avg(CounterValue) by bin(TimeGenerated, 5m), Computer
| order by TimeGenerated asc
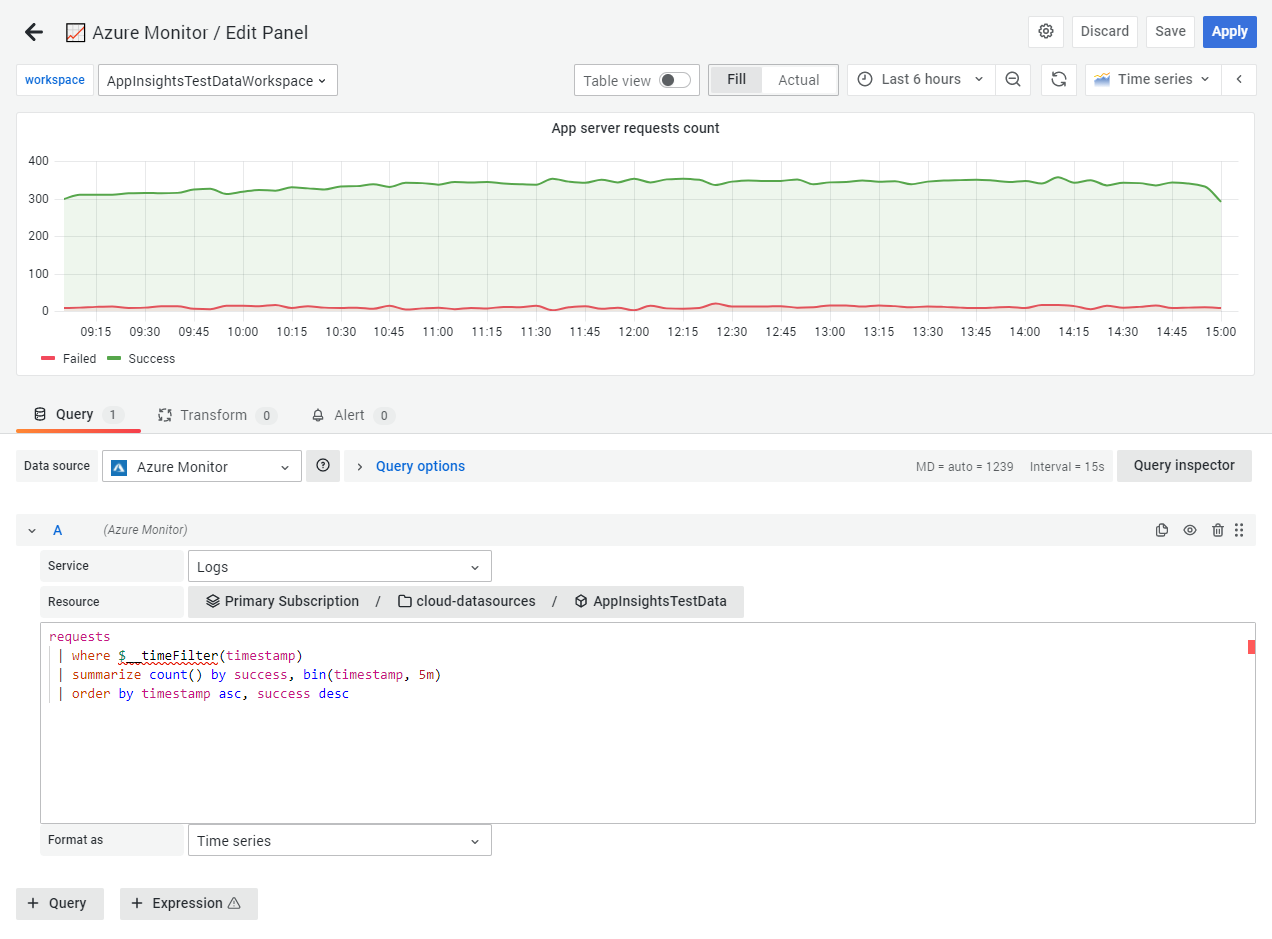
Use time series queries for values that change over time, usually for graph visualisations such as the Time series panel. Each query should return at least a datetime column and numeric value column. The result must also be sorted in ascending order by the datetime column.
You can also create a query with at least one non-numeric, non-datetime column. Azure Monitor considers those columns to be dimensions, and they become labels in the response.
For example, this query returns the aggregated count grouped by hour, Computer, and the CounterName:
Perf
| where $__timeFilter(TimeGenerated)
| summarize count() by bin(TimeGenerated, 1h), Computer, CounterName
| order by TimeGenerated asc
You can also select additional number value columns, with or without multiple dimensions. For example, this query returns a count and average value by hour, Computer, CounterName, and InstanceName:
Perf
| where $__timeFilter(TimeGenerated)
| summarize Samples=count(), ["Avg Value"]=avg(CounterValue)
    by bin(TimeGenerated, $__interval), Computer, CounterName, InstanceName
| order by TimeGenerated asc
Use table queries with the Table panel to produce a list of columns and rows. This query returns rows with the six specified columns:
AzureActivity
| where $__timeFilter()
| project TimeGenerated, ResourceGroup, Category, OperationName, ActivityStatus, Caller
| order by TimeGenerated desc
Use macros in Logs queries
To help you write queries, you can use several Grafana macros in the where clause:
| Macro | Description |
|---|---|
$__timeFilter() | Filters the results to the time range of the dashboard. Example: TimeGenerated >= datetime(2018-06-05T18:09:58.907Z) and TimeGenerated <= datetime(2018-06-05T20:09:58.907Z). |
$__timeFilter(datetimeColumn) | Like $__timeFilter(), but specifies a custom field to filter on. |
$__timeFrom() | Expands to the start of the dashboard time range. Example: datetime(2018-06-05T18:09:58.907Z). |
$__timeTo() | Expands to the end of the dashboard time range. Example: datetime(2018-06-05T20:09:58.907Z). |
$__escapeMulti($myVar) | Escapes illegal characters in multi-value template variables. If $myVar has the values '\\grafana-vm\Network(eth0)\Total','\\hello!' as a string, use this to expand it to @'\\grafana-vm\Network(eth0)\Total', @'\\hello!'.If using single-value variables, escape the variable inline instead: @'\$myVar'. |
$__contains(colName, $myVar) | Expands multi-value template variables. If $myVar has the value 'value1','value2', use this to expand it to colName in ('value1','value2').If using the All option, check the Include All Option checkbox, and type the value all in the Custom all value field. If $myVar has the value all, the macro instead expands to 1 == 1.For template variables with many options, this avoids building a large “where..in” clause, which improves performance. |
Additionally, Grafana has the built-in $__interval macro, which calculates an interval in seconds.
Query Azure Resource Graph
Azure Resource Graph (ARG) is an Azure service designed to extend Azure Resource Management with efficient resource exploration and the ability to query at scale across a set of subscriptions, so that you can more effectively govern an environment. By querying ARG, you can query resources with complex filtering, iteratively explore resources based on governance requirements, and assess the impact of applying policies in a vast cloud environment.

Create a Resource Graph query
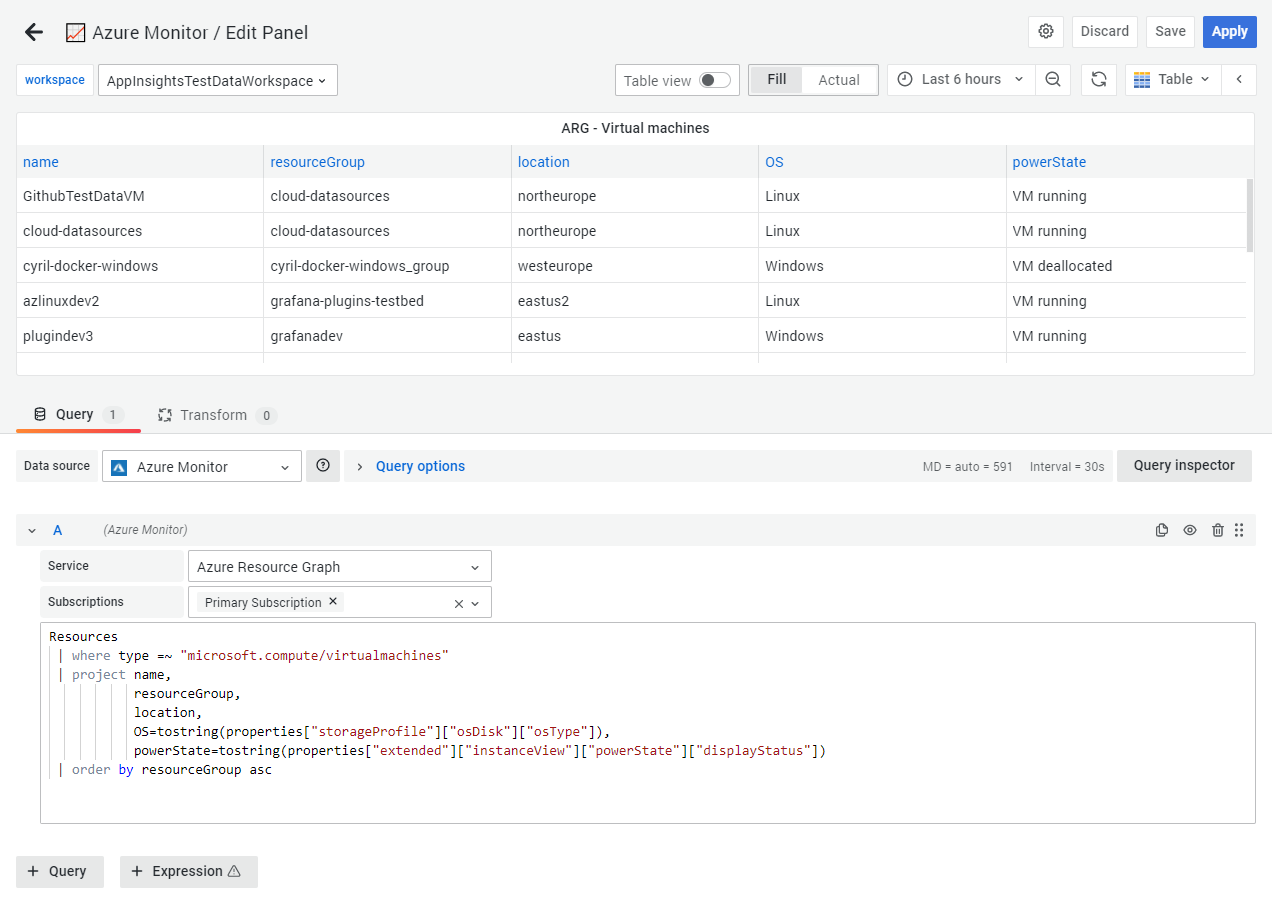
ARG queries are written in a variant of the Kusto Query Language (KQL), but not all Kusto language features are available in ARG. An Azure Resource Graph query is formatted as table data.
If your Azure credentials grant you access to multiple subscriptions, you can choose multiple subscriptions before entering queries.
Resource Graph query examples
The Azure documentation also includes sample queries to help you get started.
Sort results by resource properties:
This query returns all resources in the selected subscriptions, but only the name, type, and location properties:
Resources
| project name, type, location
| order by name asc
This query uses order by to sort the properties by the name property in ascending (asc) order.
You can change which property to sort by and the order (asc or desc).
This query uses project to show only the listed properties in the results.
You can use this to add or remove properties in your queries.
Query resources with complex filtering:
You can filter for Azure resources with a tag name and value.
For example, this query returns a list of resources with an environment tag value of Internal:
Resources
| where tags.environment=~'internal'
| project name
This query uses =~ in the type match to make the query case-insensitive.
You can also use project with other properties, or add or remove more.
Group and aggregate the values by property:
You can use summarize and count to define how to group and aggregate values by property.
For example, this query returns counts of healthy, unhealthy, and not applicable resources per recommendation:
securityresources
| where type == 'microsoft.security/assessments'
| extend resourceId=id,
    recommendationId=name,
    resourceType=type,
    recommendationName=properties.displayName,
    source=properties.resourceDetails.Source,
    recommendationState=properties.status.code,
    description=properties.metadata.description,
    assessmentType=properties.metadata.assessmentType,
    remediationDescription=properties.metadata.remediationDescription,
    policyDefinitionId=properties.metadata.policyDefinitionId,
    implementationEffort=properties.metadata.implementationEffort,
    recommendationSeverity=properties.metadata.severity,
    category=properties.metadata.categories,
    userImpact=properties.metadata.userImpact,
    threats=properties.metadata.threats,
    portalLink=properties.links.azurePortal
| summarize numberOfResources=count(resourceId) by tostring(recommendationName), tostring(recommendationState)
In ARG, many nested properties (properties.displayName) are of a dynamic type and should be cast to a string with tostring() in order to operate on them.
Use macros in Resource Graph queries
To help you write queries, you can use several Grafana macros in the where clause:
| Macro | Description |
|---|---|
$__timeFilter() | Expands to timestamp ≥ datetime(2018-06-05T18:09:58.907Z) and timestamp ≤ datetime(2018-06-05T20:09:58.907Z), where the from and to datetimes are from the Grafana time picker. |
$__timeFilter(datetimeColumn) | Expands to datetimeColumn ≥ datetime(2018-06-05T18:09:58.907Z) and datetimeColumn ≤ datetime(2018-06-05T20:09:58.907Z), where the from and to datetimes are from the Grafana time picker. |
$__timeFrom() | Returns the From datetime from the Grafana picker. Example: datetime(2018-06-05T18:09:58.907Z). |
$__timeTo() | Returns the To datetime from the Grafana picker. Example: datetime(2018-06-05T20:09:58.907Z). |
$__escapeMulti($myVar) | Escapes illegal characters from multi-value template variables. If $myVar has the values '\\grafana-vm\Network(eth0)\Total','\\hello!' as a string, this expands it to @'\\grafana-vm\Network(eth0)\Total', @'\\hello!'.If you use single-value variables, escape the variable inline instead: @'\$myVar'. |
$__contains(colName, $myVar) | Expands multi-value template variables. If $myVar has the value 'value1','value2', this expands it to colName in ('value1','value2').If using the All option, then check the Include All Option checkbox and in the Custom all value field type in the following value: all.If $myVar has value all, this instead expands to 1 == 1.For template variables with many options, this avoids building a large “where..in” clause, which improves performance. |
Query Application Insights Traces
Azure Application Insights is a service that provides application performance monitoring (APM) features. Application insights can be used to collect metrics, telemetry, and trace logging data.
Application Insights stores trace data in an underlying Log Analytics workspace and traces can be extended to provide additional supporting information as required by the application developer.
Create a Traces query
To create a Traces query:
In a Grafana panel, select the Azure Monitor data source.
Select the Traces service.
Select a resource to query. Multiple resources can be selected as long as they are of the same type.
Note
This query type only supports Application Insights resources.
Running a query of this kind will return all trace data within the timespan specified by the panel/dashboard.
Optionally, you can apply further filtering or select a specific Operation ID to query. The result format can also be switched between a tabular format or the trace format which will return the data in a format that can be used with the Trace visualization.
Note
Selecting the trace format will filter events with thetracetype.
- Specify an Operation ID value.
- Specify event types to filter by.
- Specify event properties to filter by.
You can also augment queries by using template variables.
Working with large Azure resource data sets
If a request exceeds the maximum allowed value of records, the result is paginated and only the first page of results are returned. You can use filters to reduce the amount of records returned under that value.


