This is documentation for the next version of Grafana. For the latest stable release, go to the latest version.
View alert state history
View a history of all alert events generated by your Grafana-managed alert rules from one centralized page. This helps you see patterns in your alerts over time, observe trends, make predictions, and even debug alerts that might be firing too often.
An alert event is displayed each time an alert instance changes its state over a period of time. All alert events are displayed regardless of whether silences or mute timings are set, so you’ll see a complete set of your data history even if you’re not necessarily being notified.
View from the History page
Note
For Grafana Enterprise and OSS users: The feature is available starting with Grafana 11.2. To try out the new alert history page, enable the
alertingCentralAlertHistoryfeature toggle and configure Loki annotations.Users can only see the history and transitions of alert rules they have access to (RBAC).
To access the History view, complete the following steps.
Navigate to Alerts & IRM -> Alerting -> History.
![History page in Grafana Alerting]()
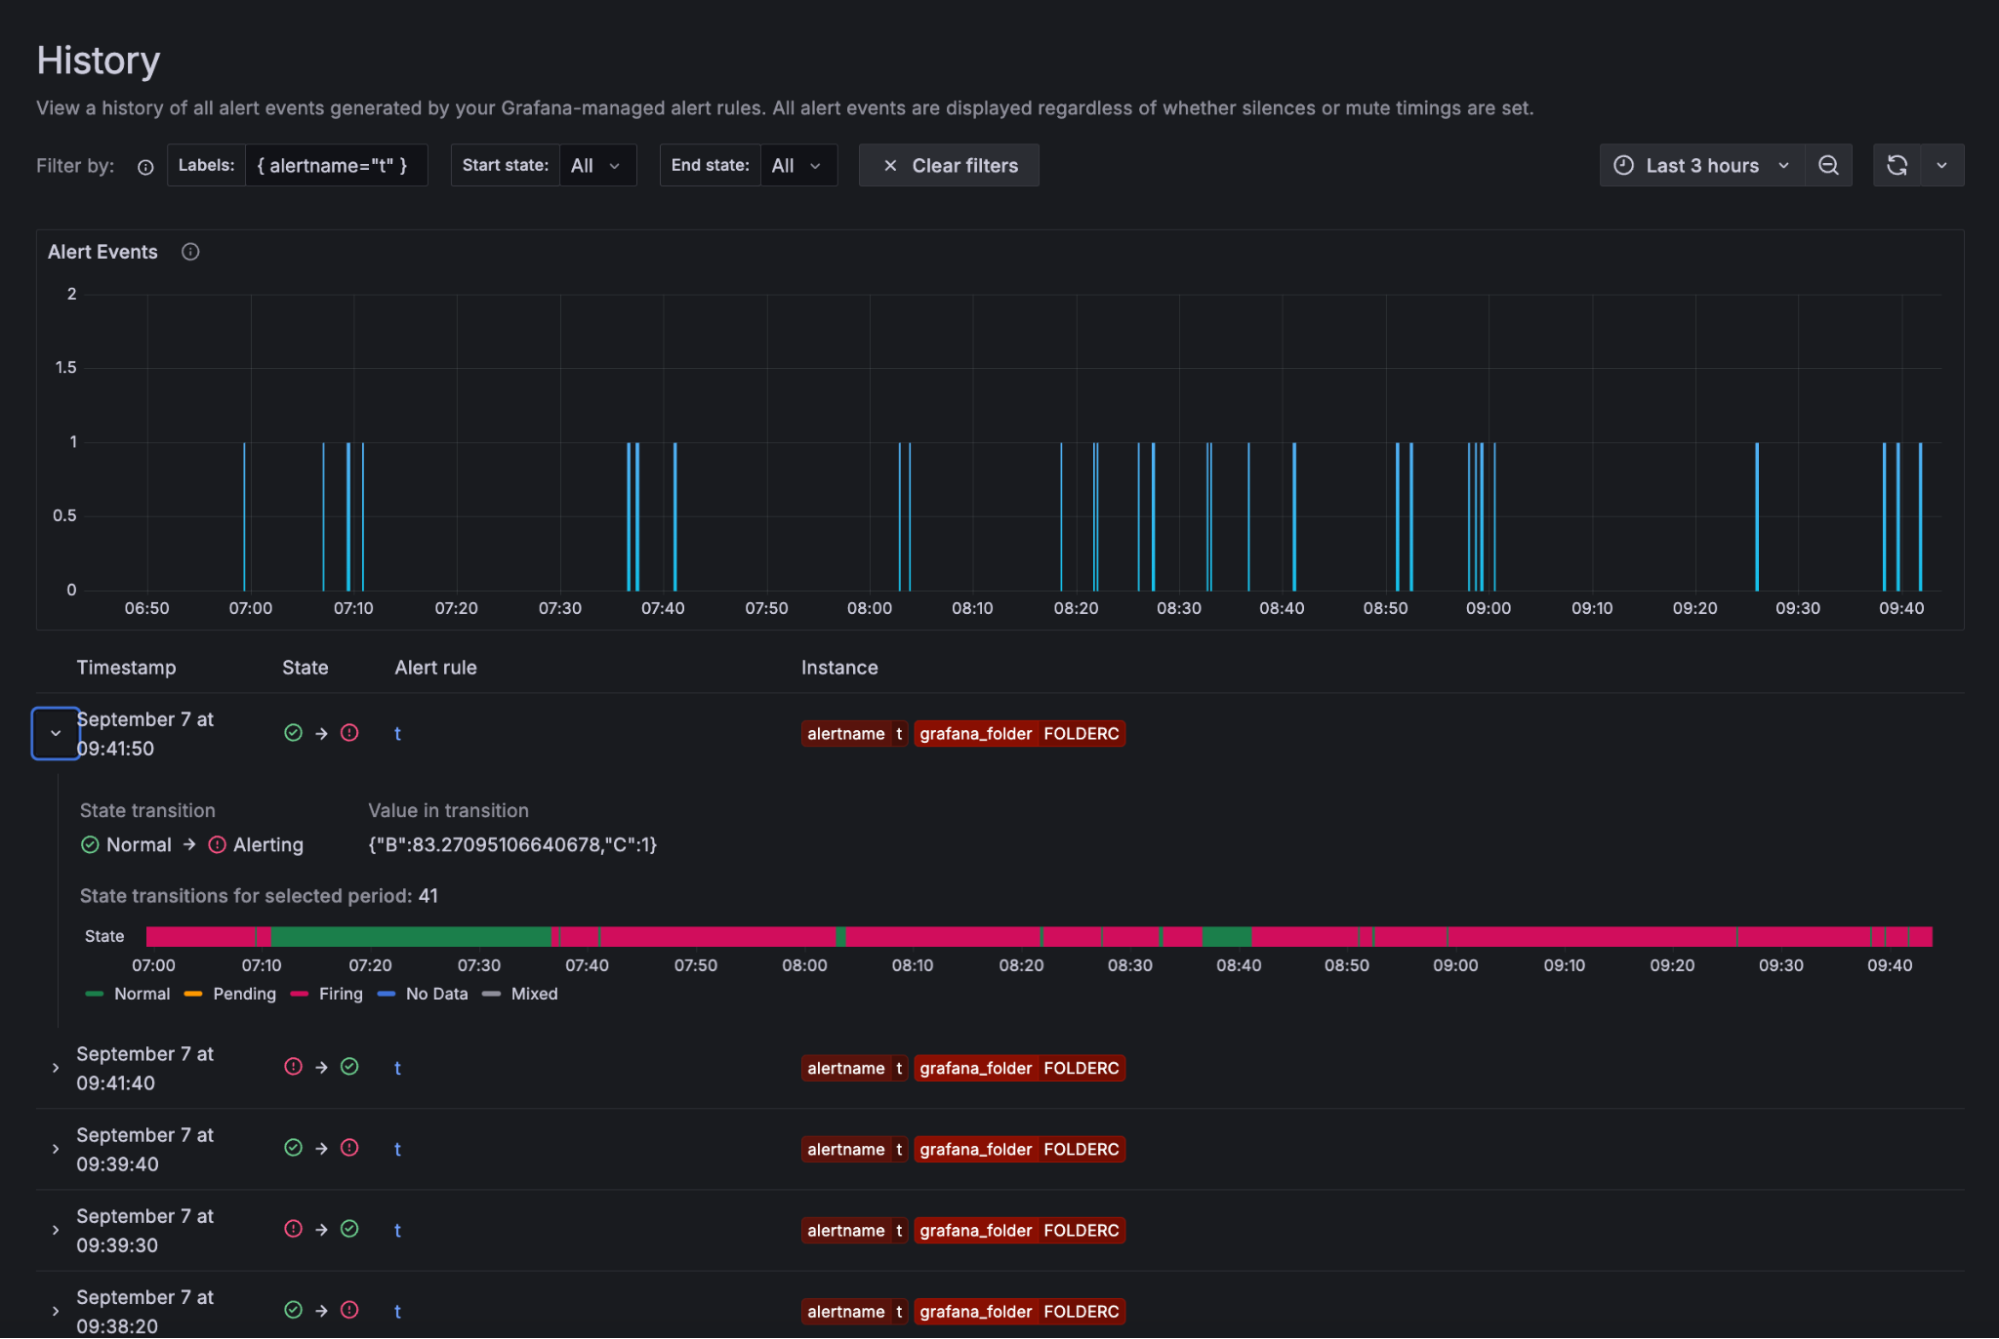
An Alert Events chart shows your alert activity within a specific time frame. Each alert event represents an alert instance that changed its state at a particular point in time. The history of the data is displayed over a period of time.
Filter by labels either by entering a label or clicking a label of an instance in the list of events.
Filter by current state and previous state by selecting a state from the drop-down or by clicking the states from the list of events. Zoom in by dragging on the chart or use the time picker.
Note
If you exceed the 5000 alerts limit, you may see data missing from the chart. To see complete results, narrow the time frame.
Under the chart, there is a list of events. Each event represents a state change on an alert instance. Expand a row to see the number of transitions for the alert instance, a state graph, and the value in the transition.
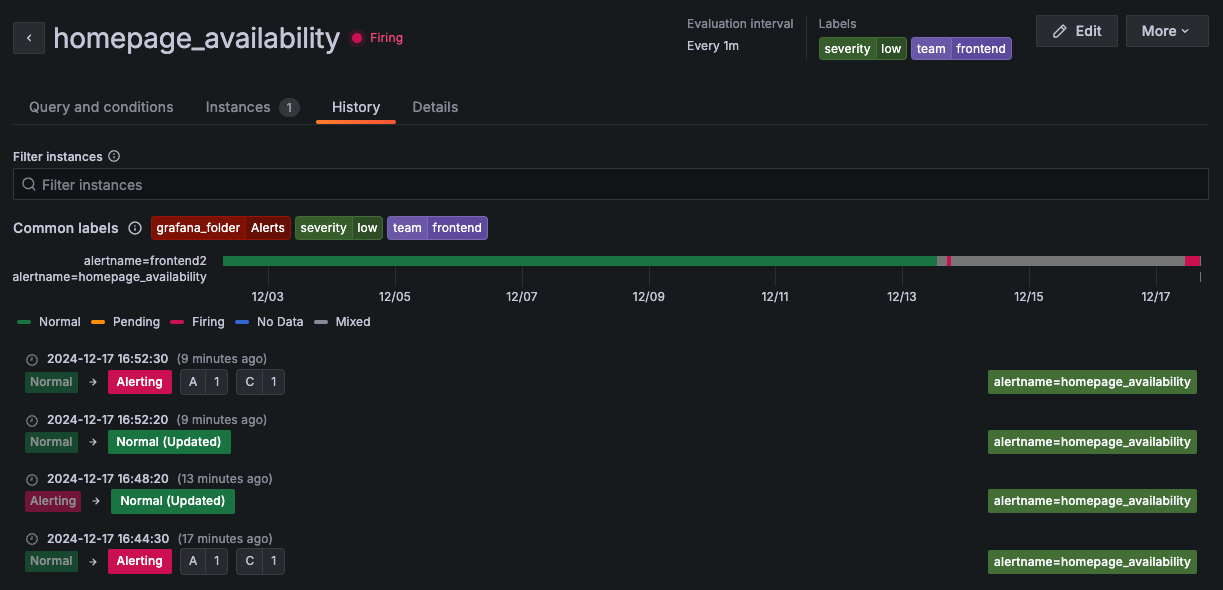
Click the alert rule name to jump to the History tab in the Alert Rule view.
![Alert History tab in Grafana Alerting]()
View from the State history view
Use the State history view to get insight into how your individual alert instances behave over time.
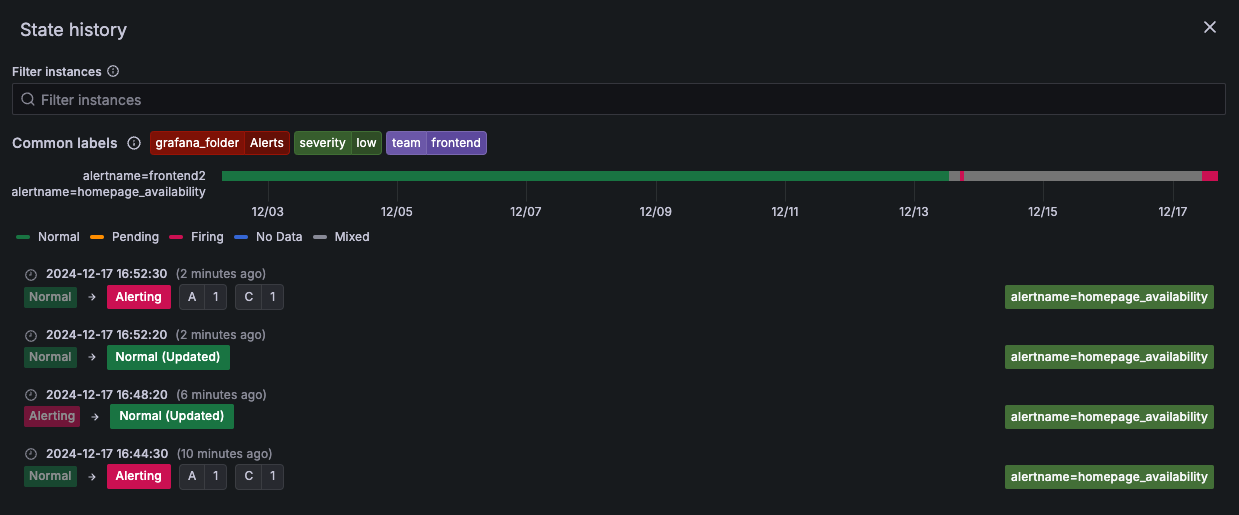
View information on when a state change occurred, what the previous state was, the current state, any other alert instances that changed their state at the same time as well as what the query value was that triggered the change.
Note
Open source users must configure alert state history in order to be able to access the view.
To access the State history view, complete the following steps.
Navigate to Alerts & IRM -> Alerting -> Alert rules.
Click an alert rule.
Select Show state history.
![State history view in Grafana Alerting]()
The timeline view at the top displays a timeline of changes for the past hour, so you can track how your alert instances are behaving over time.
The bottom part shows the alert instances, their previous and current state, the value of each part of the expression and a unique set of labels.
Common labels are displayed at the top to make it easier to identify different alert instances.
From the timeline view, hover over a time to get an automatic display of all the changes that happened at that particular moment.
These changes are displayed in real time in the timestamp view at the bottom of the page. The timestamp view is a list of all the alert instances that changed state at that point in time. The visualization only displays 12 instances by default.
The value shown for each instance is for each part of the expression that was evaluated.
Click the labels to filter and narrow down the results.


