This is documentation for the next version of Grafana. For the latest stable release, go to the latest version.
Alert rules
An alert rule is a set of evaluation criteria for when an alert rule should fire. An alert rule consists of:
- Queries that select the dataset to evaluate.
- An alert condition (the threshold) that the query must meet or exceed to trigger the alert instance.
- An interval that specifies the frequency of alert rule evaluation and a duration indicating how long the condition must be met to trigger the alert instance.
- Other customizable options, for example, setting what should happen in the absence of data, notification messages, and more.
Grafana supports two different alert rule types: Grafana-managed alert rules and data source-managed alert rules.
Grafana-managed alert rules
Grafana-managed alert rules are the most flexible alert rule type. They allow you to create alert rules that can act on data from any of the supported data sources, and use multiple data sources in a single alert rule.

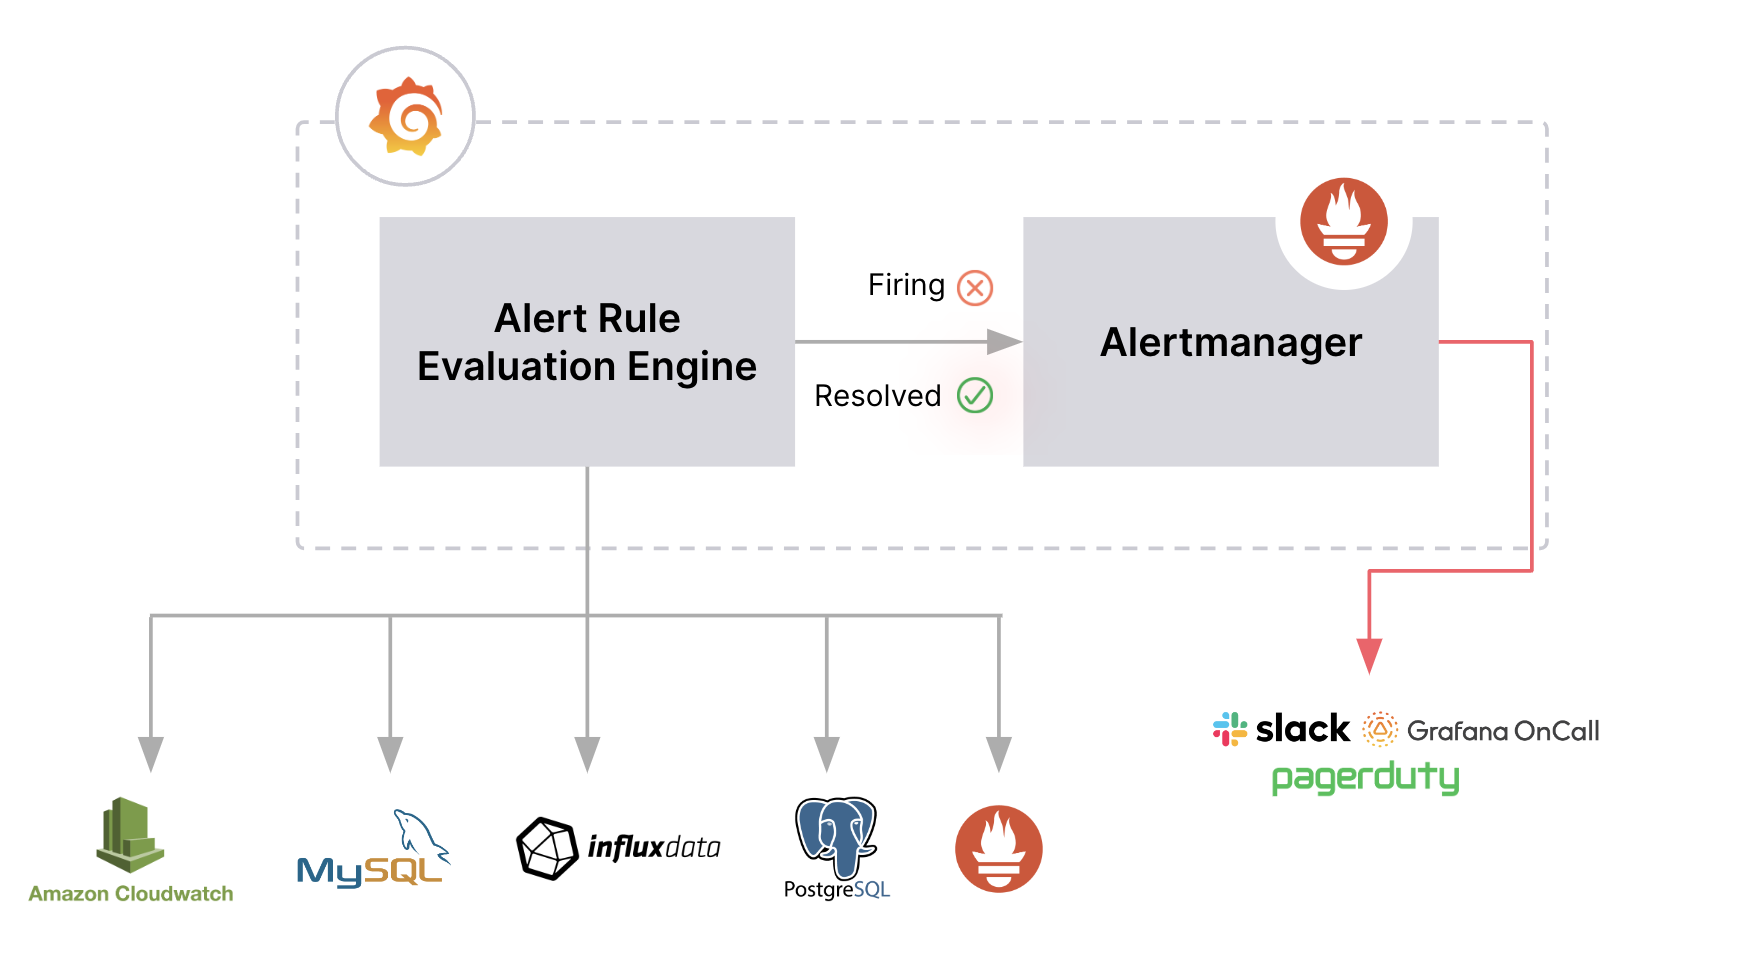
- Alert rules are created and stored within Grafana.
- Alert rules can query one or more supported data sources.
- Alert rules are evaluated by the Alert Rule Evaluation Engine within Grafana.
- Firing and resolved alert instances are forwarded to handle their notifications.
Supported data sources
Grafana-managed alert rules can query backend data sources if Grafana Alerting is enabled by specifying {"backend": true, "alerting": true} in the plugin.json file.
Find the public data sources supporting Alerting in the Grafana Plugins directory.
Data source-managed alert rules
Data source-managed alert rules can only be created using Grafana Mimir or Grafana Loki data sources. Both data source backends can provide high availability and fault tolerance, enabling you to scale your alerting setup.

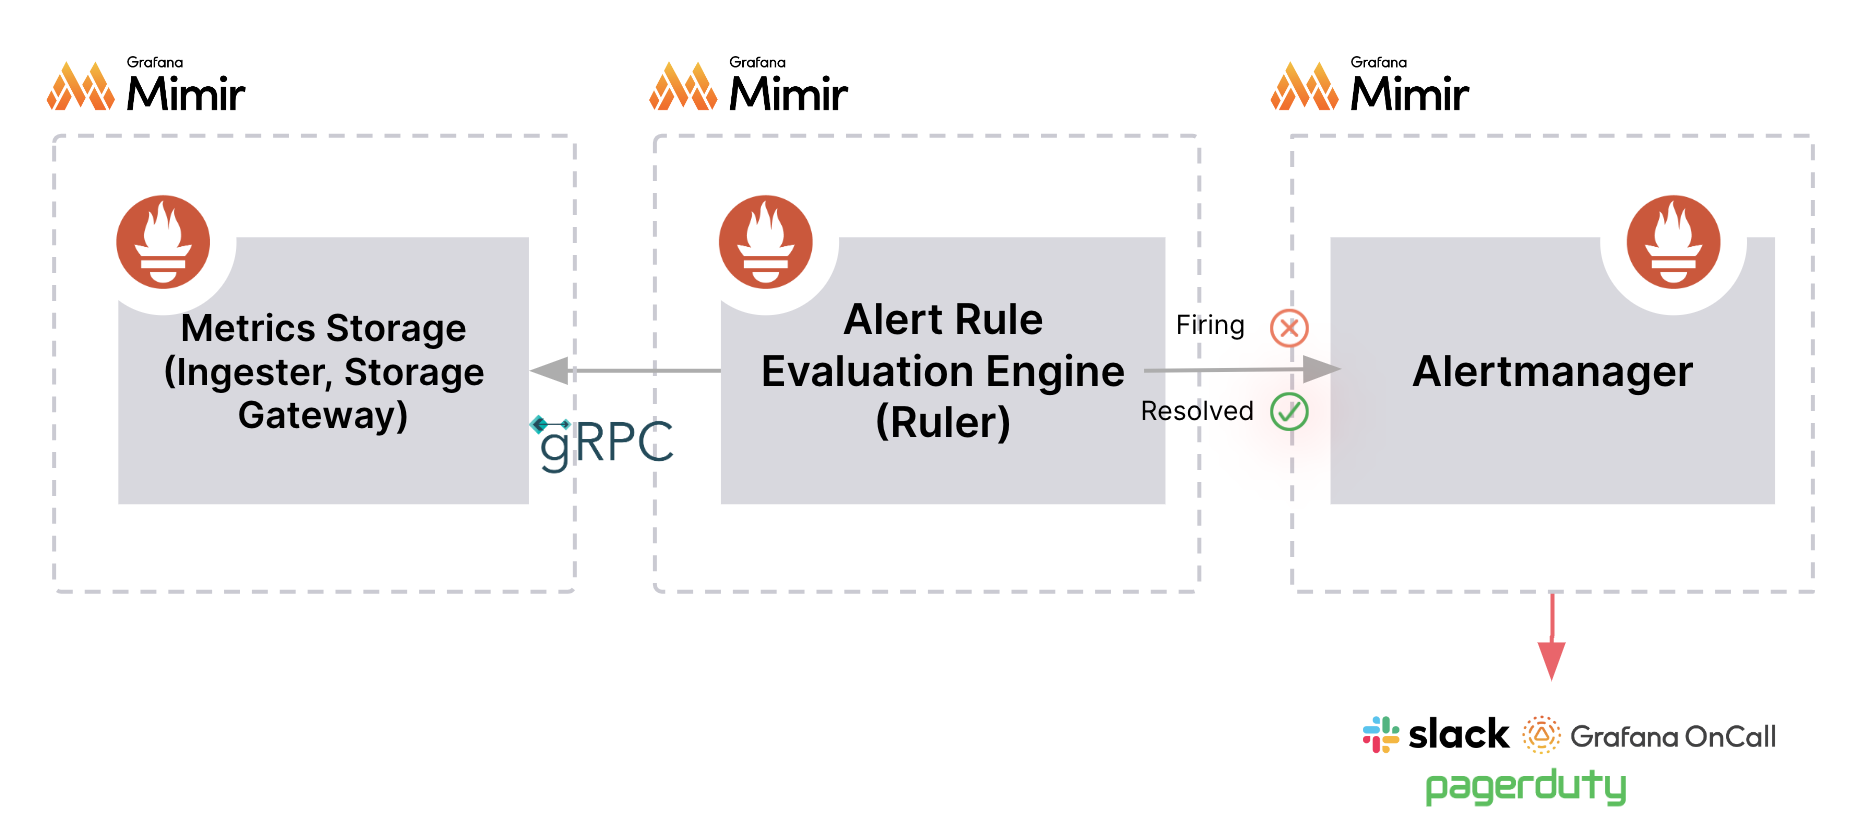
- Alert rules are stored within the Mimir or Loki data source.
- Alert rules can query only their specific data source.
- Alert rules are evaluated by the Alert Rule Evaluation Engine within the data source.
- Firing and resolved alert instances are forwarded to handle their notifications.
Rules from a Prometheus data source appear in the Data source-managed section of the Alert rules page when Manage alerts via Alerting UI is enabled.
However, Grafana can only create and edit data source-managed rules for Mimir and Loki, not for a Prometheus instance.
Comparison between alert rule types
We recommend using Grafana-managed alert rules whenever possible, and opting for data source-managed alert rules when you need to scale your alerting setup.
The table below compares Grafana-managed and data source-managed alert rules.
Feature | Grafana-managed alert rule | Data source-managed alert rule |
|---|---|---|
| Create alert rules | Yes | Only supports creating rules for Mimir and Loki. |
| Mix and match data sources | Yes | No |
| Add expressions to transform | Yes | No |
| Use images in alert notifications | Yes | No |
| Support for recording rules | Yes | Yes |
| Organization | Organize and manage access with folders | Use namespaces |
| Alert rule evaluation and delivery | Alert evaluation is done in Grafana, while delivery can be handled by Grafana or an external Alertmanager. | Alert rule evaluation and alert delivery are distributed. |
| Scaling | Alert rules are stored in the Grafana database, which may experience transient errors. It only scales vertically. | Alert rules are stored within the data source and allow for horizontal scaling. |
Recording rules
Similar to alert rules, recording rules are evaluated periodically. A recording rule pre-computes frequently used or computationally expensive queries, and saves the results as a new time series metric.
The new recording metric can then be used in alert rules and dashboards to optimize their queries.
For more details, refer to Create recording rules.


