This is documentation for the next version of Grafana. For the latest stable release, go to the latest version.
Introduction to Alerting
Whether you’re just starting out or you’re a more experienced user of Grafana Alerting, learn more about the fundamentals and available features that help you create, manage, and respond to alerts; and improve your team’s ability to resolve issues quickly.
Tip
For a hands-on introduction, refer to our tutorial to get started with Grafana Alerting.
The following diagram gives you an overview of Grafana Alerting and introduces you to some of the fundamental features that are the principles of how Grafana Alerting works.

How it works at a glance
- Grafana Alerting periodically queries data sources and evaluates the condition defined in the alert rule
- If the condition is breached, an alert instance fires
- Firing (and resolved) alert instances are sent for notifications, either directly to a contact point or through notification policies for more flexibility
Fundamentals
The following concepts are key to your understanding of how Grafana Alerting works.
Alert rules
An alert rule consists of one or more queries and expressions that select the data you want to measure. It also contains a condition, which is the threshold that an alert rule must meet or exceed to fire.
In the alert rule, choose the contact point or notification policies to determine how to receive the alert notifications.
Alert instances
Each alert rule can produce multiple alert instances (also known as alerts) - one alert instance for each time series. This is exceptionally powerful as it allows you to observe multiple series in a single expression.
sum by(cpu) (
  rate(node_cpu_seconds_total{mode!="idle"}[1m])
)
A rule using the PromQL expression above creates as many alert instances as the amount of CPUs after the first evaluation, enabling a single rule to report the status of each CPU.

Alert rules are frequently evaluated and the state of their alert instances is updated accordingly. Only alert instances that are in a firing or resolved state are sent in notifications.
Contact points
Contact points determine the notification message and where notifications are sent. For example, you might have a contact point that sends notifications to an email address, to Slack, to an incident management system (IRM) such as Grafana OnCall or Pagerduty, or to a webhook.
Notification messages
By default, notification messages include alert details, such as the number of alerts, their status, and annotations to help responders address alert issues. Notification messages can also be customized.
In the alert rule, you can choose a contact point to receive the alert notifications or use notification policies instead.
Notification policies
Notification policies is an advanced option to handle alert notifications for larger systems.
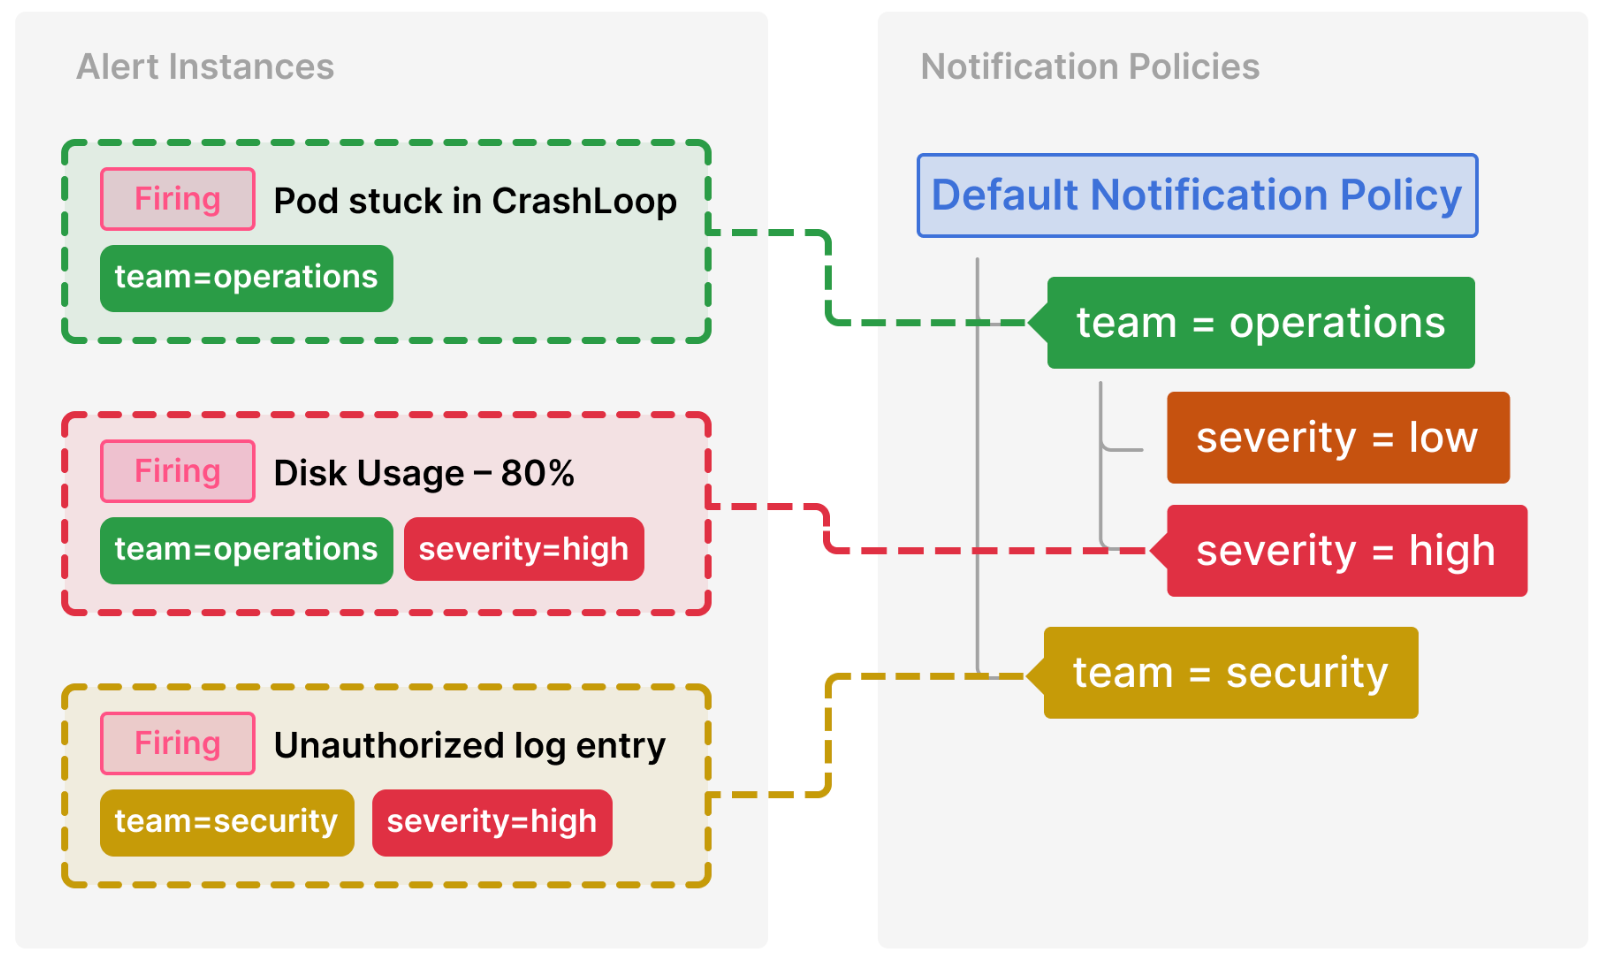
Notification policies routes alerts to contact points via label matching. Each notification policy consists of a set of label matchers (0 or more) that specify which alert instances (identified by their labels) they handle. Notification policies are defined in a tree structure, where the root of the notification policy tree is the Default notification policy, which ensures all alert instances are handled.

Each notification policy decides where to send the alert (contact point) and when to send the notification (timing options). Additionally, it can group multiple firing alert instances into a single notification to reduce alert noise.

Silences and mute timings
Silences and mute timings allow you to pause notifications for specific alerts or even entire notification policies. Use a silence to pause notifications on an ad-hoc basis, such as during a maintenance window; and use mute timings to pause notifications at regular intervals, such as evenings and weekends.
Architecture
Grafana Alerting is built on the Prometheus model of designing alerting systems. Prometheus-based alerting systems have two main components:
- An alert generator that evaluates alert rules and sends firing and resolved alerts to the alert receiver.
- An alert receiver (also known as Alertmanager) that receives the alerts and is responsible for sending their notifications.
Design your Alerting system
Monitoring complex IT systems and understanding whether everything is up and running correctly is a difficult task. Setting up an effective alert management system is therefore essential to inform you when things are going wrong before they start to impact your business outcomes.
Designing and configuring an alert management set up that works takes time.
Here are some tips on how to create an effective alert management set up for your business:
Which are the key metrics for your business that you want to monitor and alert on?
- Find events that are important to know about and not so trivial or frequent that recipients ignore them.
- Alerts should only be created for big events that require immediate attention or intervention.
- Consider quality over quantity.
How do you want to organize your alerts and notifications?
- Be selective about who you set to receive alerts. Consider sending them to the right teams, whoever is on call, and the specific channels.
- Think carefully about priority and severity levels.
- Automate as far as possible provisioning Alerting resources with the API or Terraform.
Which information should you include in notifications?
- Consider who the alert receivers and responders are.
- Share information that helps responders identify and address potential issues.
- Link alerts to dashboards to guide responders on which data to investigate.
How can you reduce alert fatigue?
- Avoid noisy, unnecessary alerts by using silences, mute timings, or pausing alert rule evaluation.
- Continually tune your alert rules to review effectiveness. Remove alert rules to avoid duplication or ineffective alerts.
- Continually review your thresholds and evaluation rules.


