What’s new in Grafana v9.1
We’re excited to announce Grafana v9.1, with a variety of improvements that focus on Grafana’s usability, performance, and security. Read on to learn about new options to share and embed dashboards, search and navigation enhancements, new panel options, and additional authentication features. You can also find out more about new single sign-on and role-based access control options in Grafana Enterprise, and more. For details, see the complete changelog.
OSS
Auth and security
Grafana service accounts are generally available
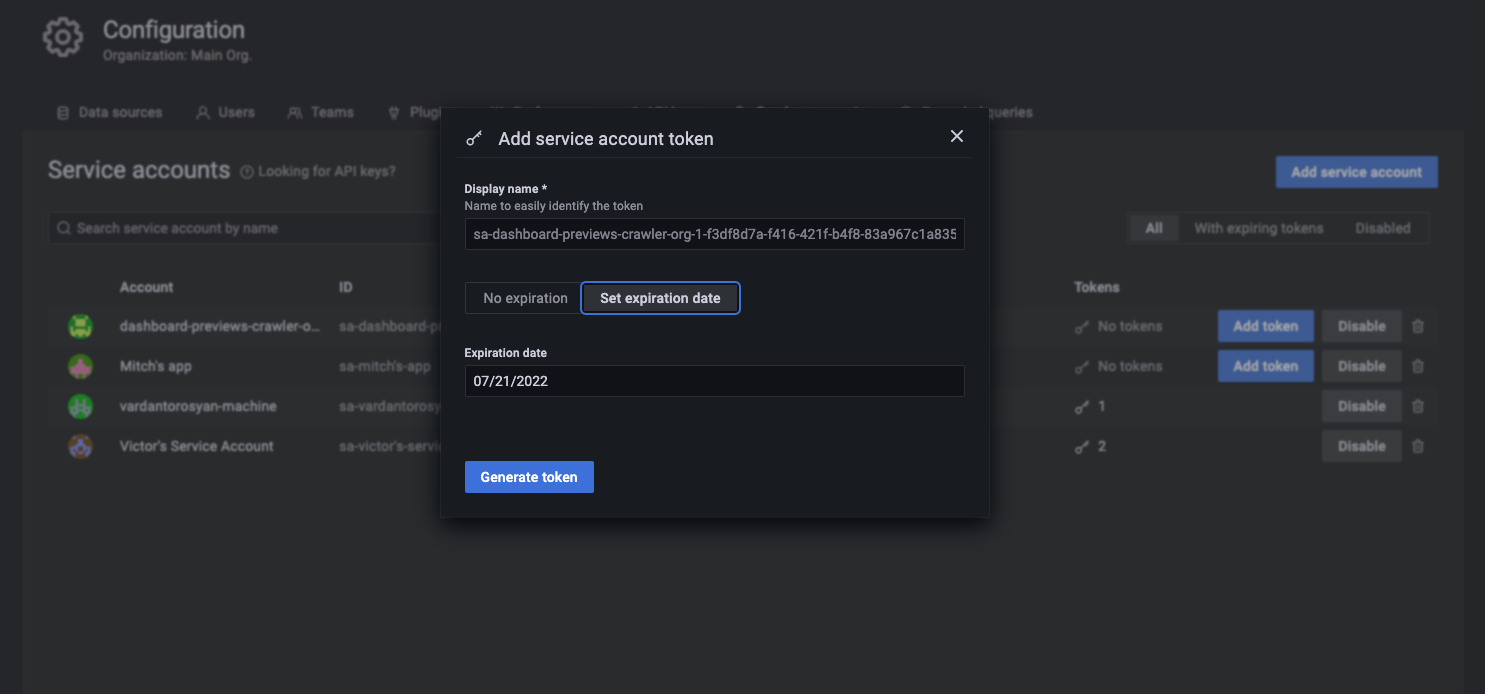
Service accounts are an evolution in machine access within Grafana. You can create multiple API tokens per service account with independent expiration dates, and temporarily disable a service account without deleting it. These benefits make service accounts a more flexible way for Terraform and other apps to authenticate with Grafana.
Service accounts also work with role-based access control in Grafana Enterprise. You can improve security by granting service accounts specific roles to limit the functions they can perform. Service accounts have been in beta since Grafana v8.5. During that time, we’ve improved the UI and migration path from API keys, made it possible to add service accounts to teams, and inherit team permissions. To learn more about service accounts, see the documentation.
JWT URL embedding
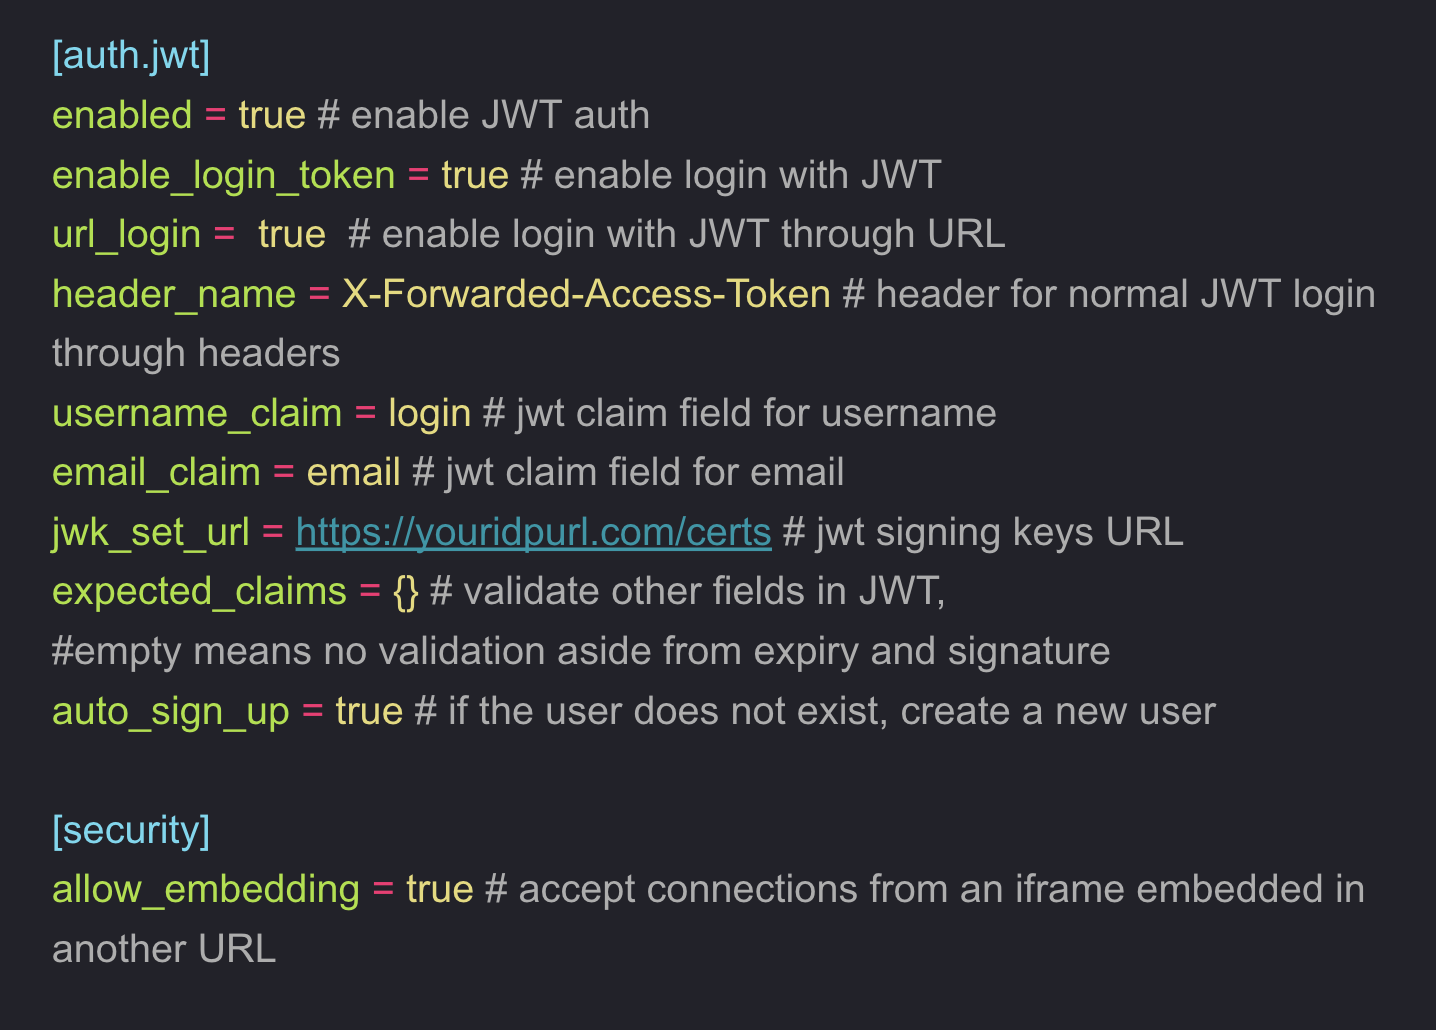
You can now easily embed Grafana in other applications by adding a JWT token directly in the Grafana’s URL, for example,https://example.grafana.net/dashboard/uuid?aut_token=<jwt_token>.
When the JWT token is passed through the request URL to Grafana, Grafana validates and authenticates the token linked to a specific user, allowing access to dashboards which that user can view.
To see JWT URL embedding in action, see the sample project.
Note: JWT URL Embedding and
allow_embeddingare not available to Grafana Cloud users. For Grafana Cloud, use public dashboards. To enable that, open a ticket with our Support team.
Organization role mapping for GitHub OAuth2 authentication
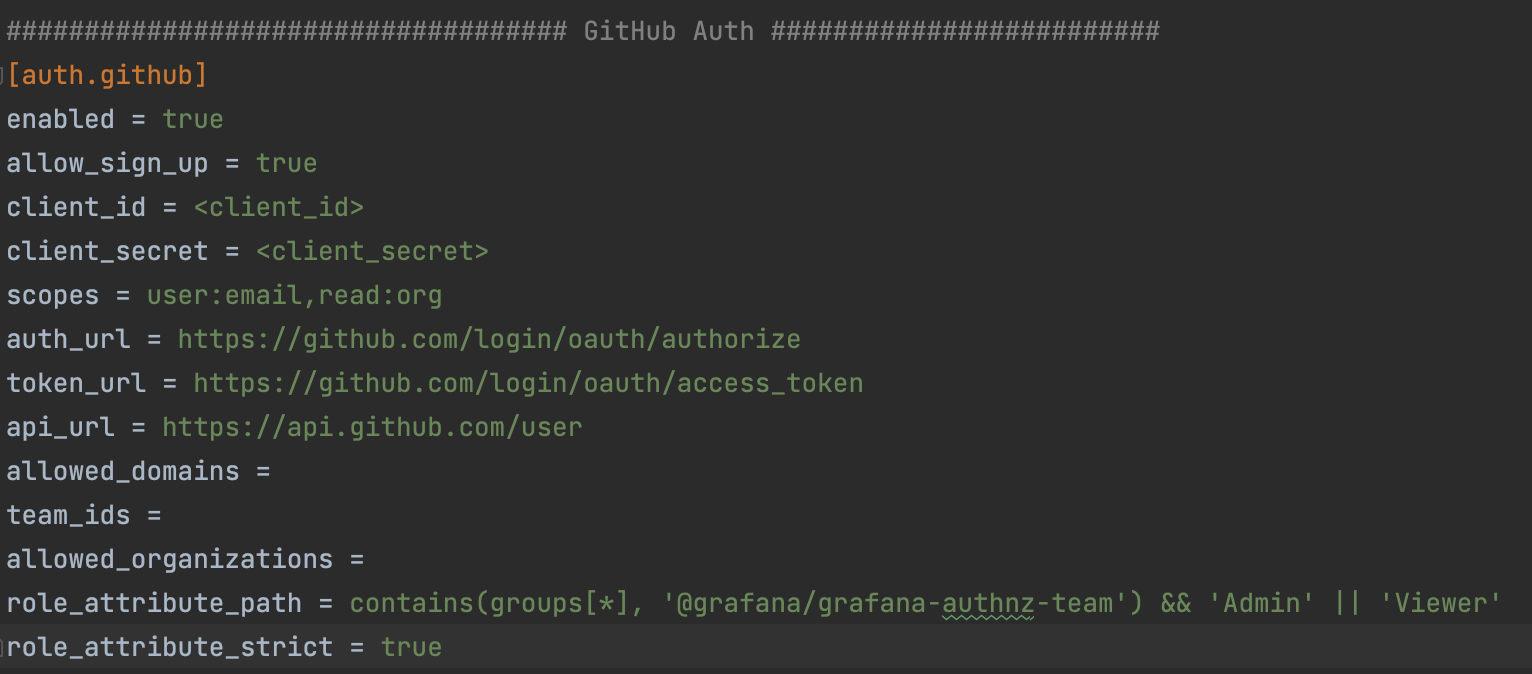
You can now use GitHub OAuth2 to map users or teams to specific Grafana organization roles by using role_attribute_path configuration option.
Grafana will use JMESPath for path lookup and role mapping.
For more information, see the documentation.
Grafana Cloud users can access this feature by opening a support ticket in the Cloud Portal.
Search and navigation
(Beta) Panel title search and search improvements
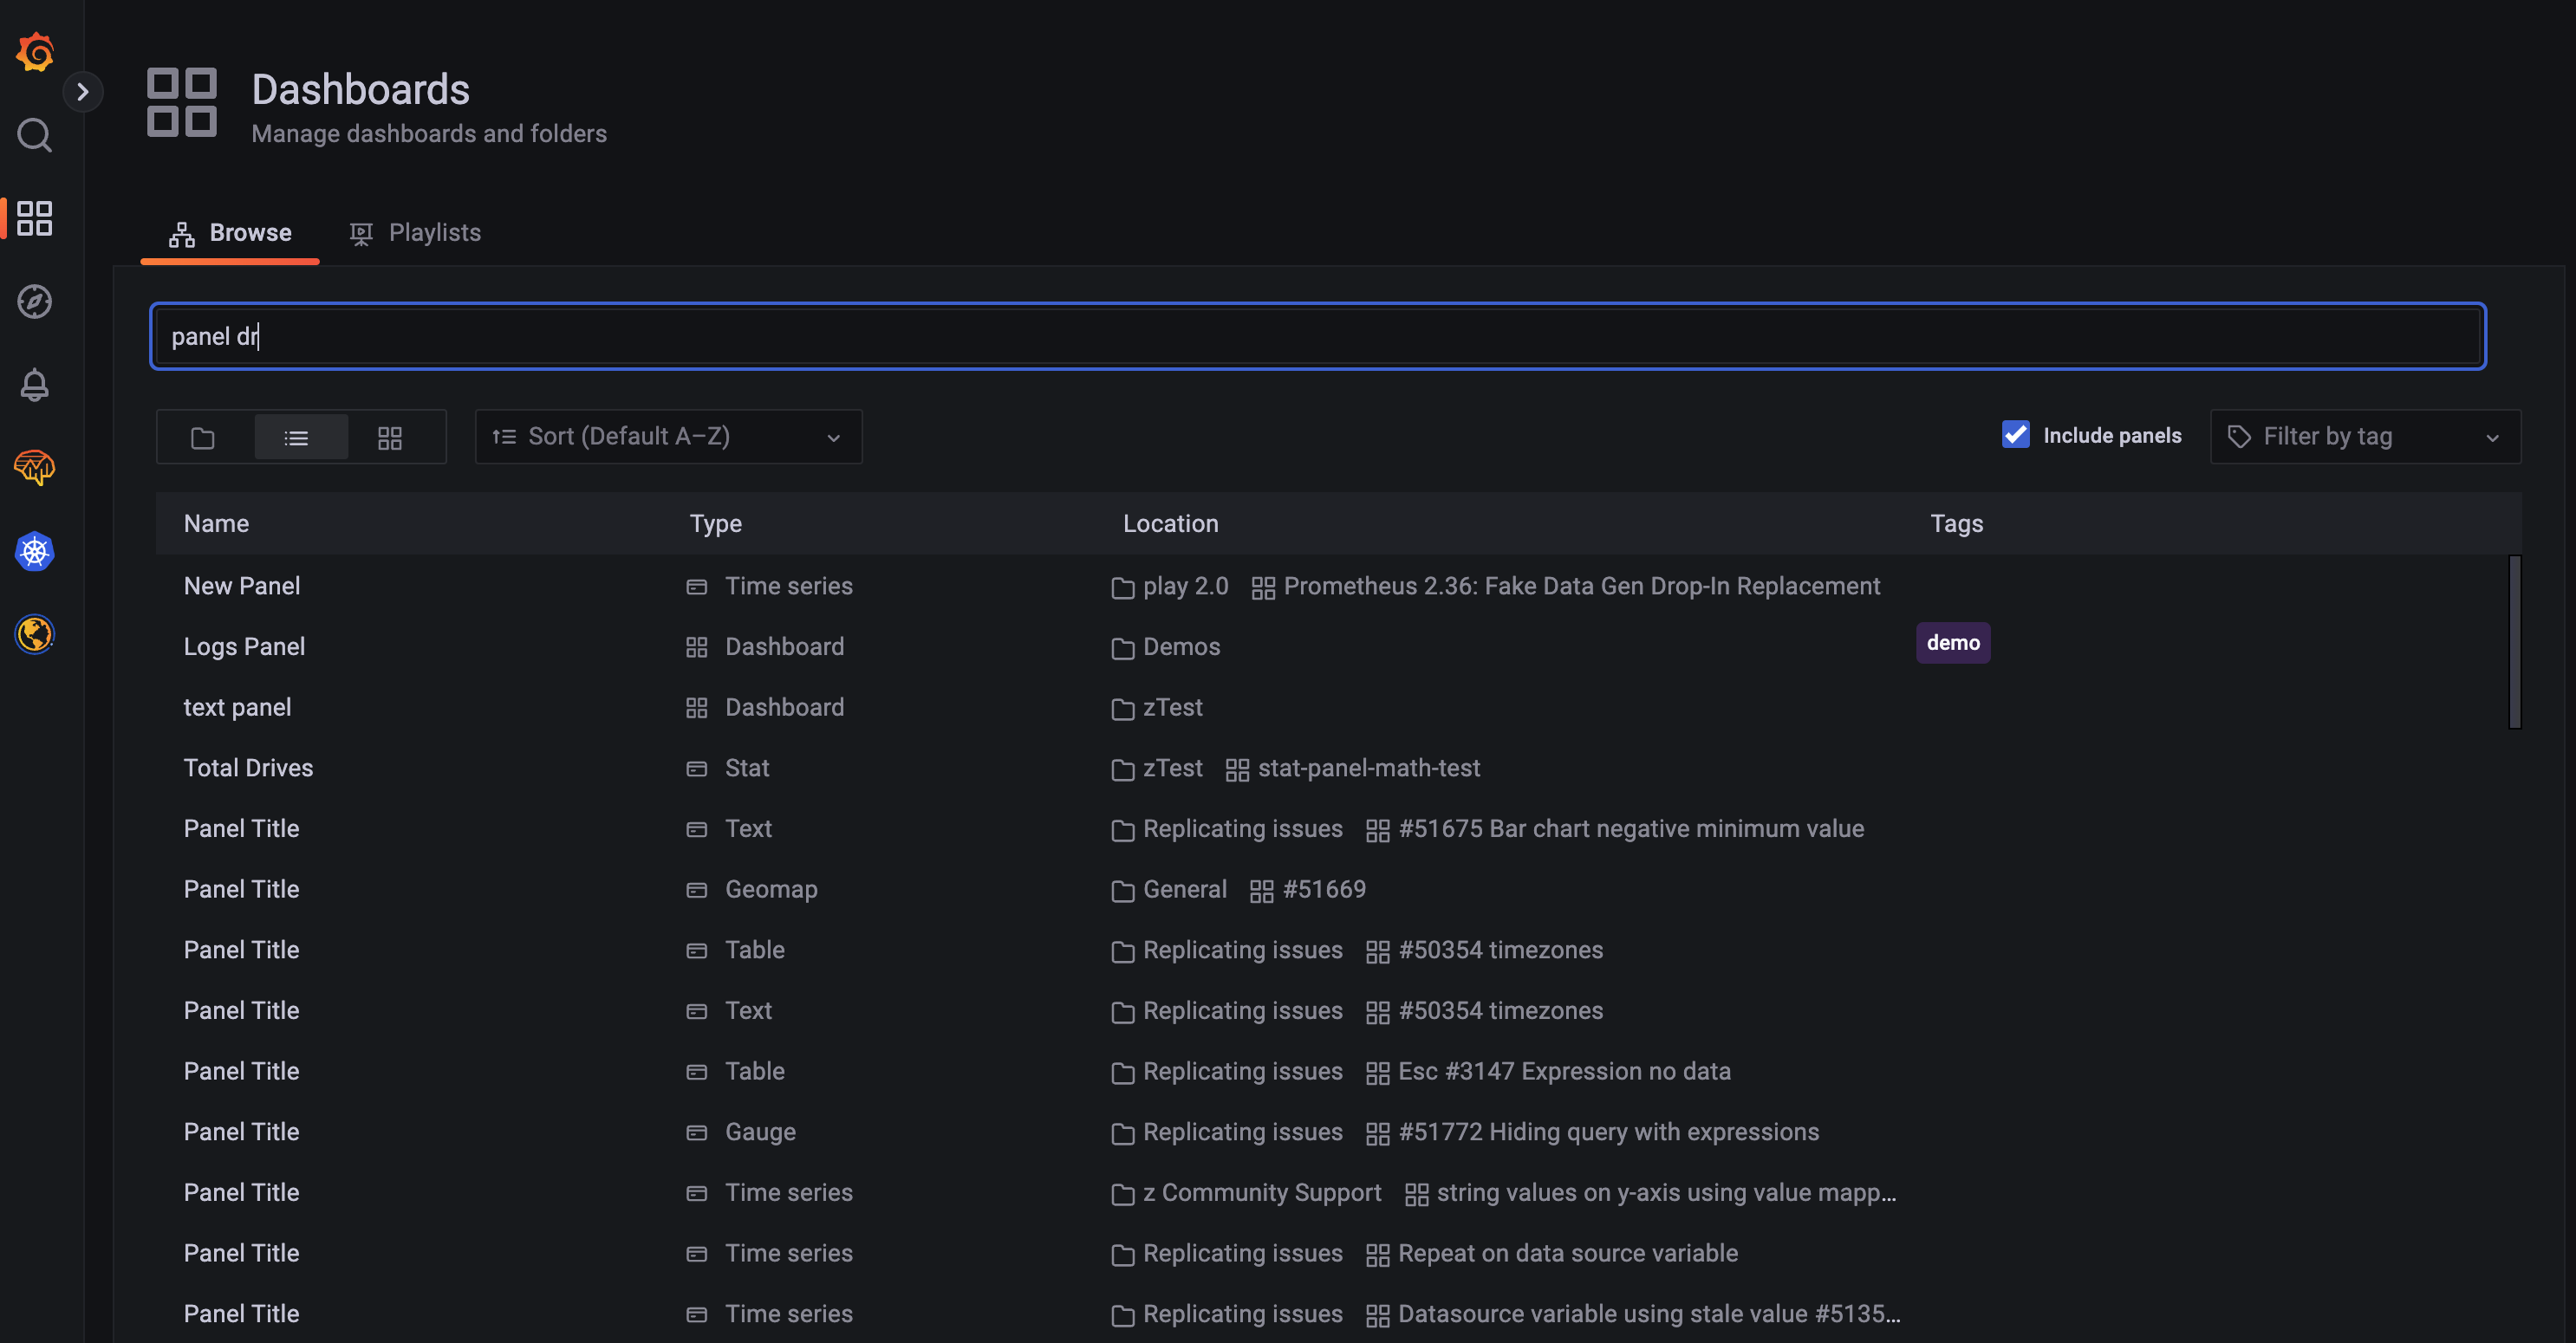
We’ve improved the performance of searching by panel title.
If a panel’s title matches your search query, it will be displayed in the search results.
This feature will be rolled out to Grafana Cloud users over the course of several weeks, or can be accessed by enabling the panelTitleSearch feature toggle.
Panel title search uses our updated dashboard search approach. Previously, Grafana used SQL database queries to find dashboards by title. With the feature toggle enabled, Grafana can build an in-memory index of all dashboards. To learn more about search in Grafana, see the documentation.
Starred dashboards in the navigation bar
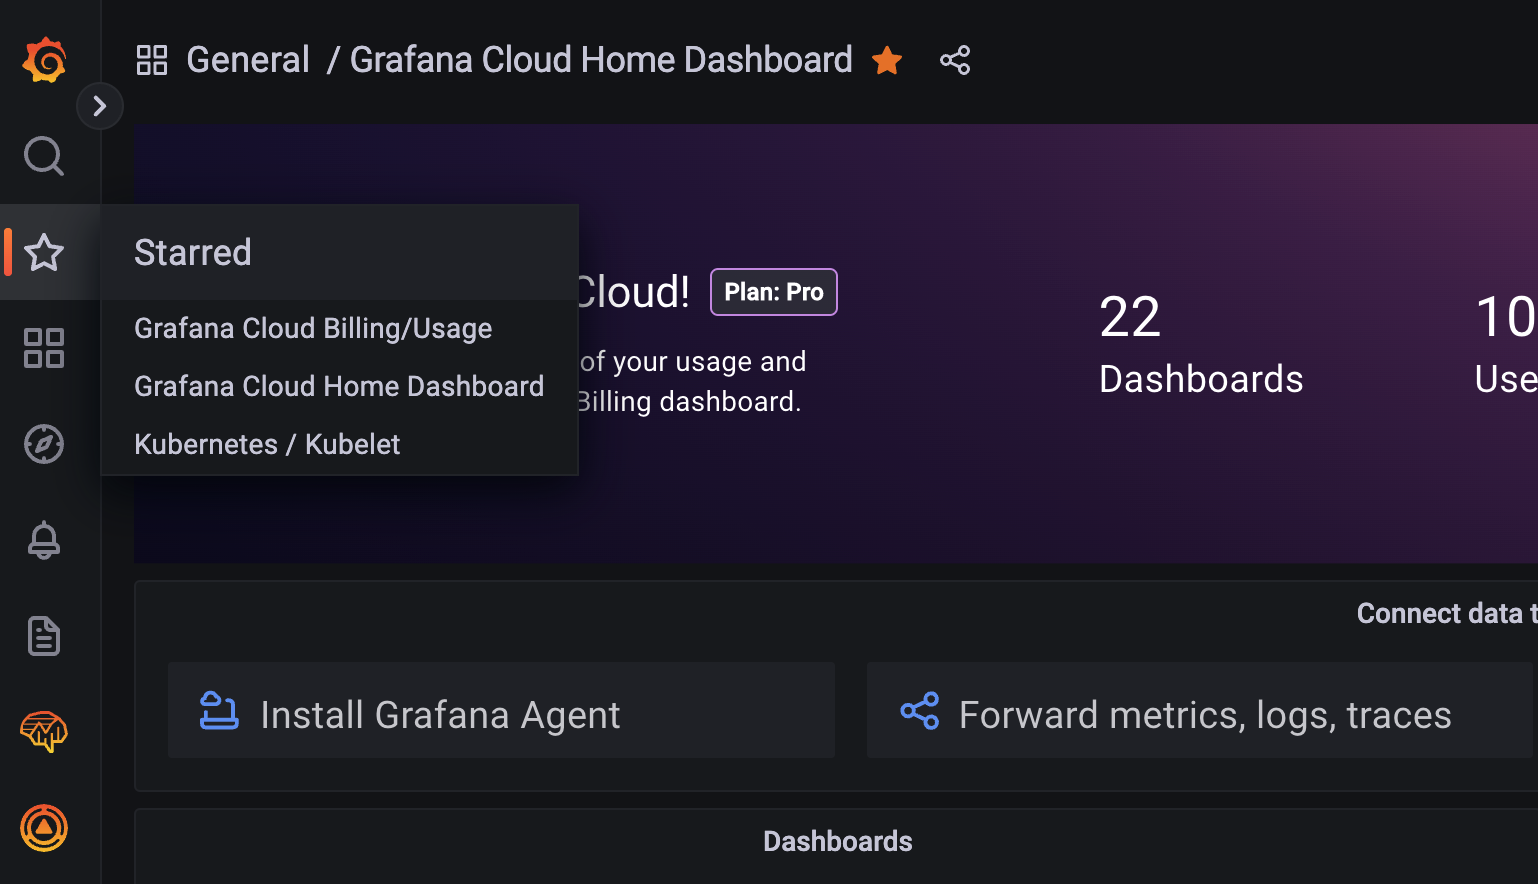
As part of the upcoming improvements to Grafana’s navigation, you can now directly access your starred dashboards from the navigation bar.
Panels
Heatmap improvements
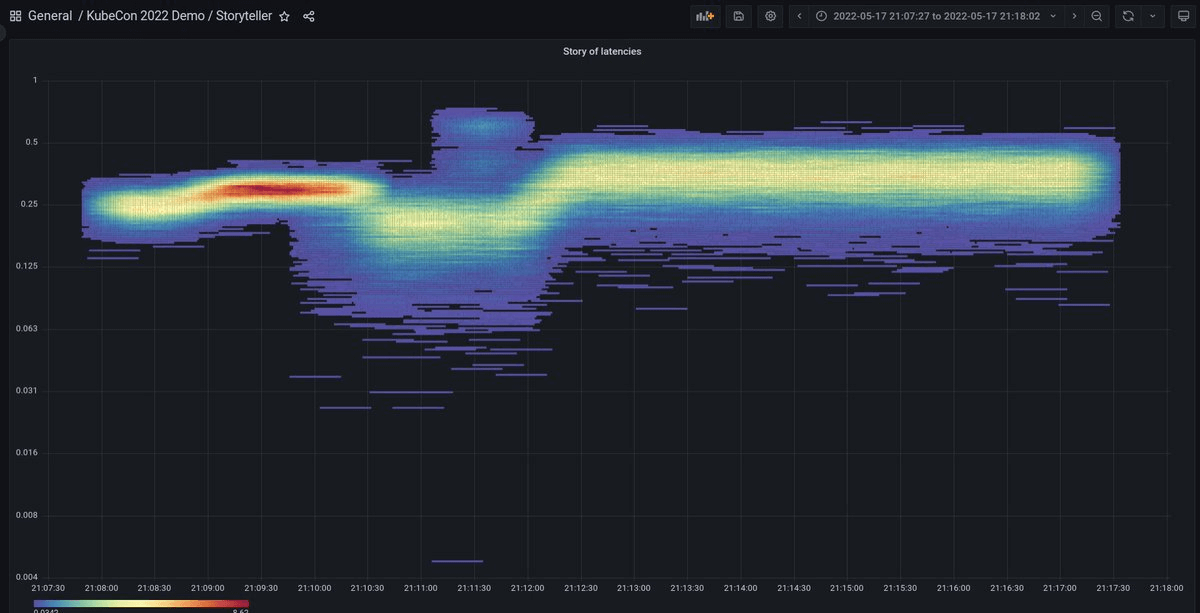
The beta heatmap announced in version 9.0 is now used throughout Grafana. Its performance is improved, and it now supports exemplars. To learn more about the heatmap panel, see the documentation.
Geomap
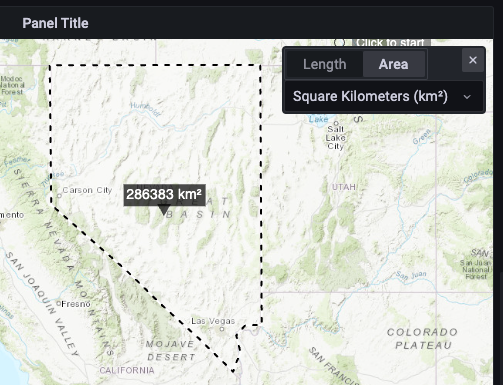
You can now measure both distances and areas on Geomap visualizations by using the panel’s new measure tools. To learn more about the Geomap panel, see the documentation.
(Beta) Trace to metrics
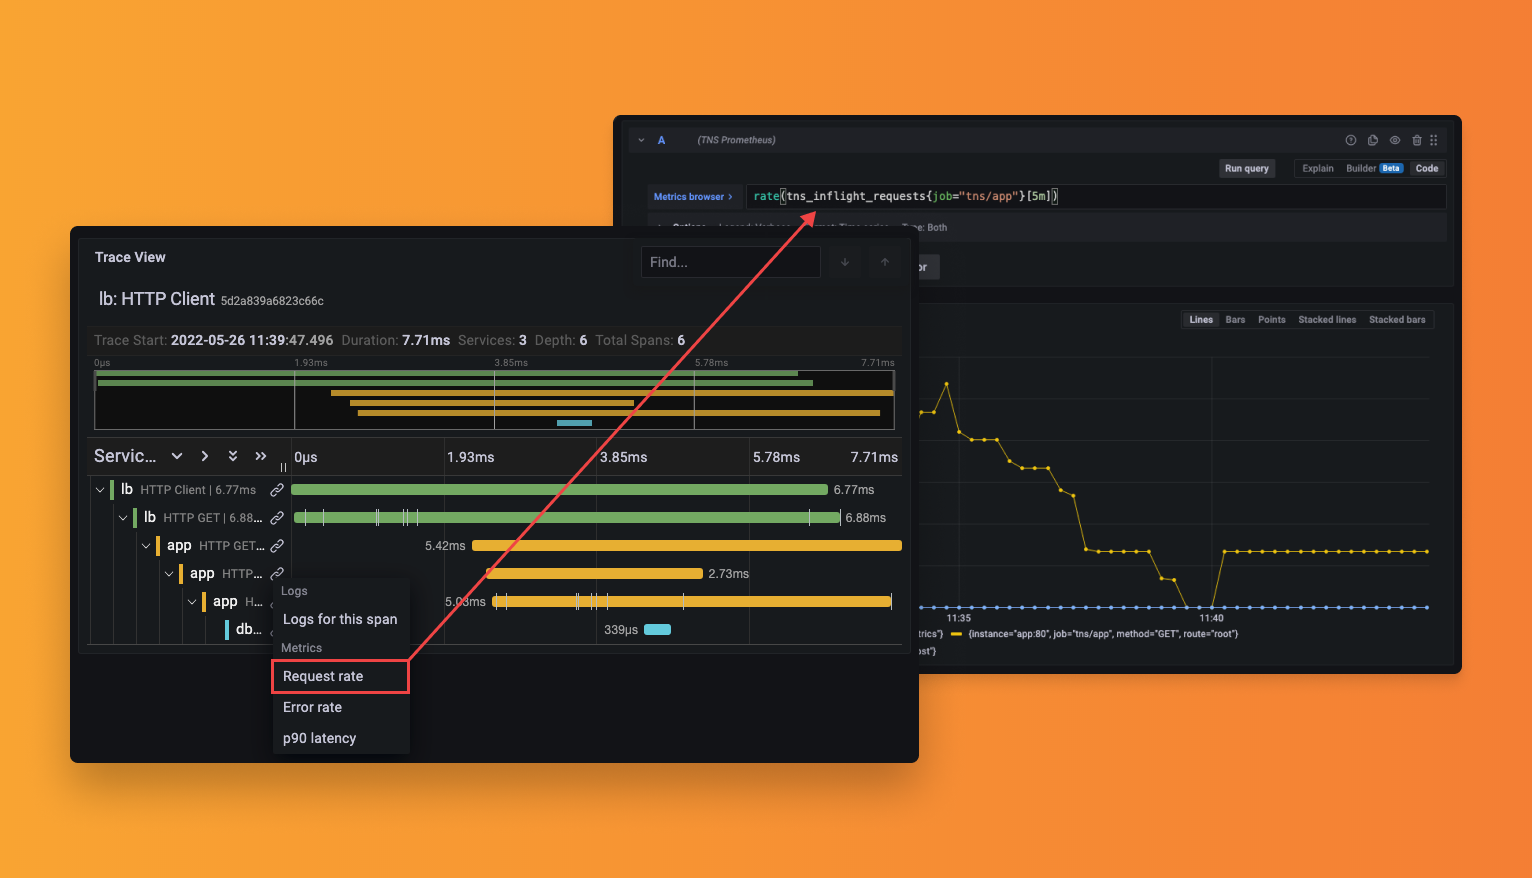
You can now link metrics queries to your traces.
This feature can be accessed by enabling the traceToMetrics feature toggle.
Grafana Cloud users can access this feature by opening a support ticket in the Cloud Portal.
In your tracing datasource configuration, select a metrics datasource, add tags, and write your queries. Each query appears as a link on each span. The configured tag values are dynamically added to your metrics queries. You can link to any metric you’d like. Metrics for span durations, counts, and errors filtered by service or span are a great starting point. The metrics generator introduced in Tempo 1.4 pairs extremely well with the trace to metrics feature. To learn more about the metrics generator, see the blog post.
(Beta) APM table
You can now get Application Performance Management (APM) data with Grafana.
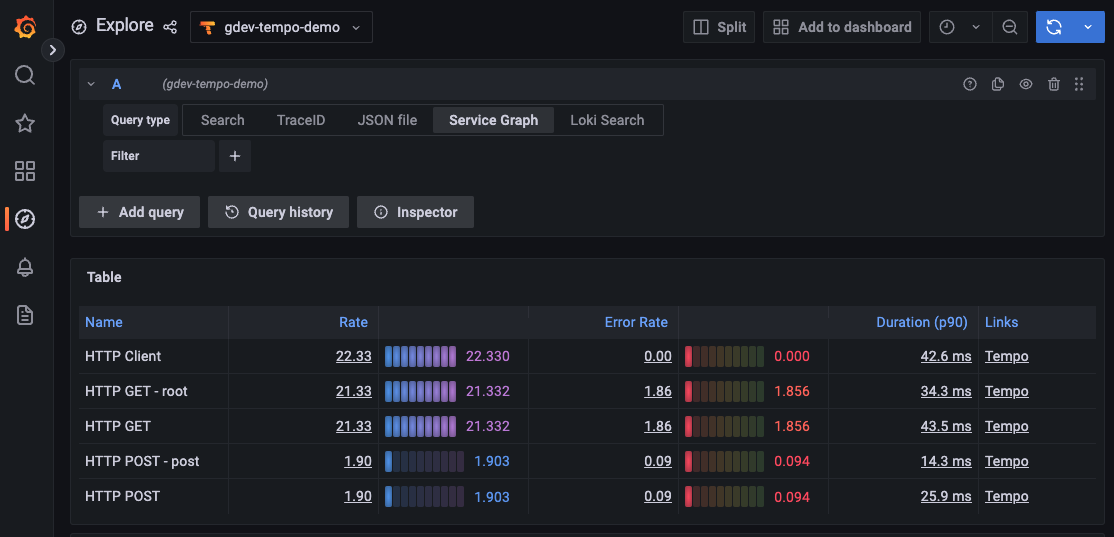
The data is shown in a table in the Tempo datasource under the Service Graph tab.
To access the feature, enable the tempoApmTable feature toggle.
To receive the data for the APM table, you must also enable the metrics generator.
Grafana Cloud users can access this feature by opening a support ticket in the Cloud Portal.
The APM table displays rate, errors, and duration (RED) metrics. To view your top five RED span metrics, use the table summary view. The span metrics are created using the Tempo metrics generator.
We also embedded several links directly into the table. These links direct you to a Prometheus query to further investigate the data. We also provide a link from the table directly to Tempo search, making it easier for you to investigate your APM metrics.
To learn more about the APM table, see the documentation.
Sharing
(Alpha) Public dashboards
Public dashboards are available as an alpha feature that can be enabled with the publicDashboards feature toggle.
Grafana Cloud users can access this feature by opening a support ticket in the Cloud Portal.
You can generate a link for dashboards that you’d like to share publicly. Anyone with the link will be able to access that dashboard, and nothing else.
The public view of a dashboard has a few restrictions:
- Arbitrary queries cannot be run against your datasources through public dashboards. Public dashboards can only execute the queries stored on the original dashboard.
- The public dashboard is displayed in a read-only kiosk view.
- The time range is fixed to the dashboard default time range.
To learn more, see the documentation.
Provisioning improvements for Grafana Alerting
You can provision your Grafana Alerting resources directly from disk, which is a process you might already follow for your dashboards or data sources. Grafana Alerting resources are provisioned once when you initially configure Grafana.
Provisioning for Grafana Alerting currently supports these resources:
- Alert rules
- Contact points
- Notification policies
- Mute timings
- Text templates
For more information, see the provisioning documentation.
Grafana Enterprise
Sharing and customization
Reporting improvements
Reporting is better in a few specific ways in Grafana version 9.1:
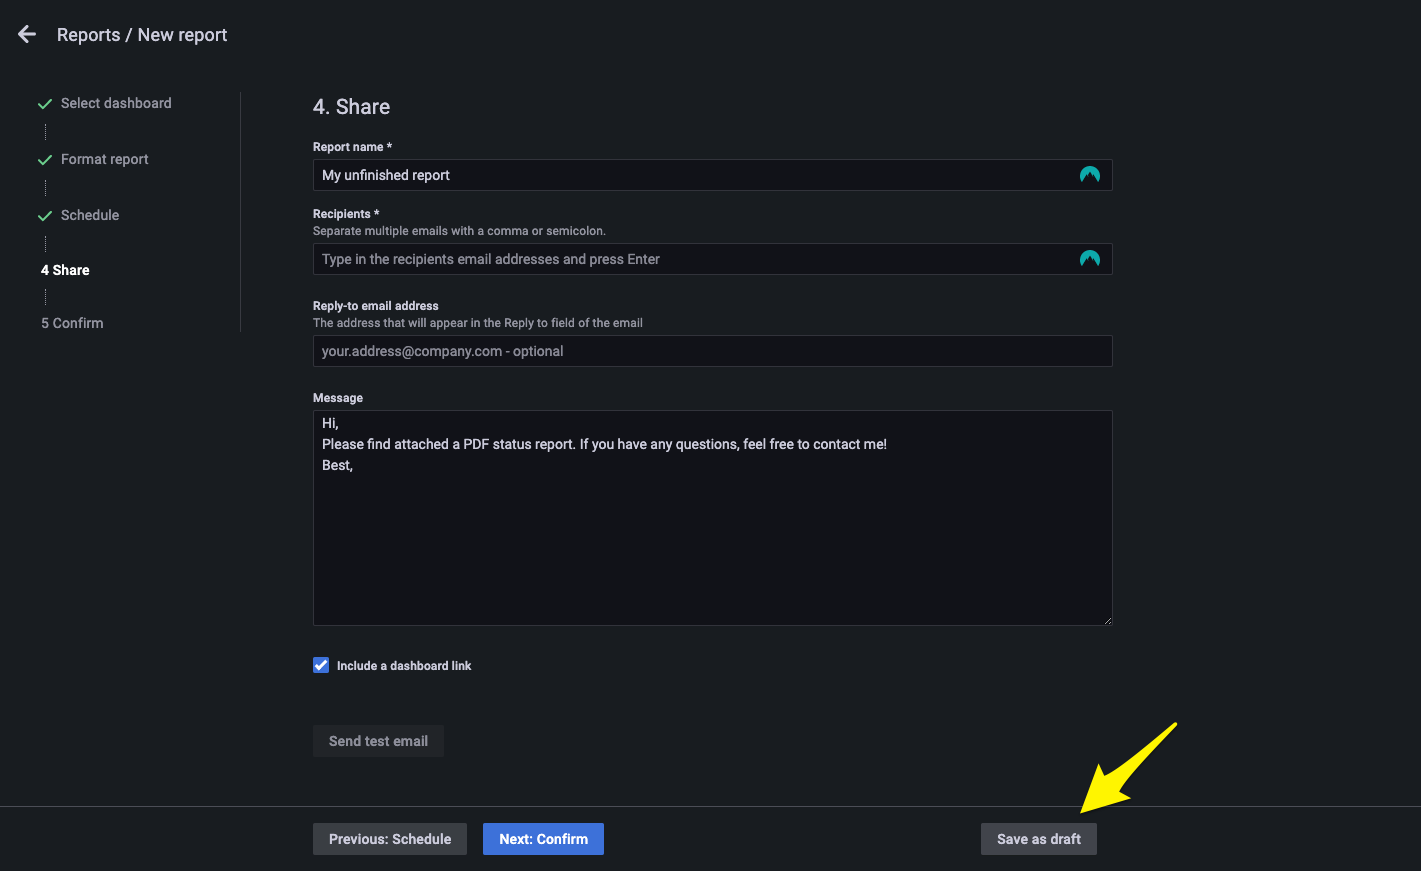
- You can save a draft of a report, in case you need to make a quick update to a dashboard or make other changes before publishing the report.
- Each page of a report PDF includes the dashboard’s name, which is useful for multi-page reports.
- You can send the same dashboard in a report multiple times with different time ranges. For example, you can share last month’s numbers as compared to the numbers for this month. The dashboard uses the same template variables if you attach the dashboard to a report twice.
To learn more about reporting, see the documentation.
(Beta) Configure custom branding in Grafana’s UI
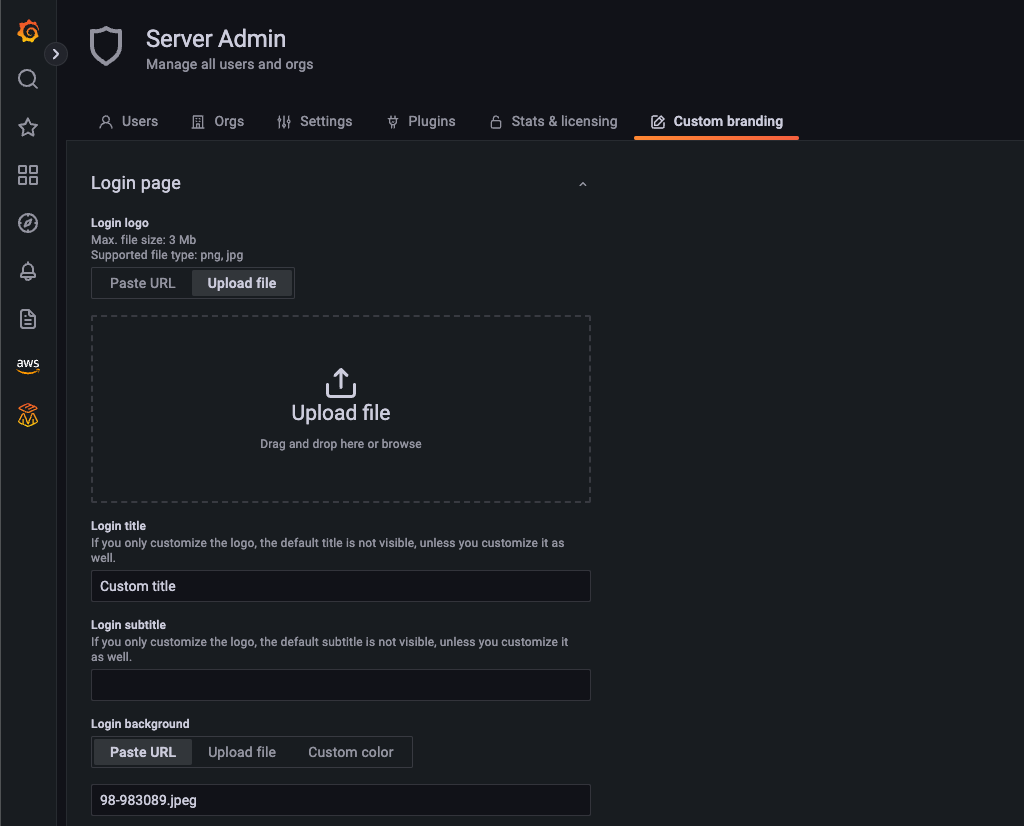
Custom branding (previously referred to as whitelabeling) lets you customize parts of Grafana’s UI. You can add links to the footer to your internal documentation, guides, or support, and you can update Grafana’s sign-in page, logo, and other graphic elements to reflect your team or company identity.
Previously, you could only configure custom branding in Grafana’s configuration files. Now, you can experiment with customization in Grafana’s Admin section in the UI, or customize branding and links using the API. This is an early-access feature available only to self-managed customers.
Authentication and security
RBAC for app plugins, usage insights, and query caching
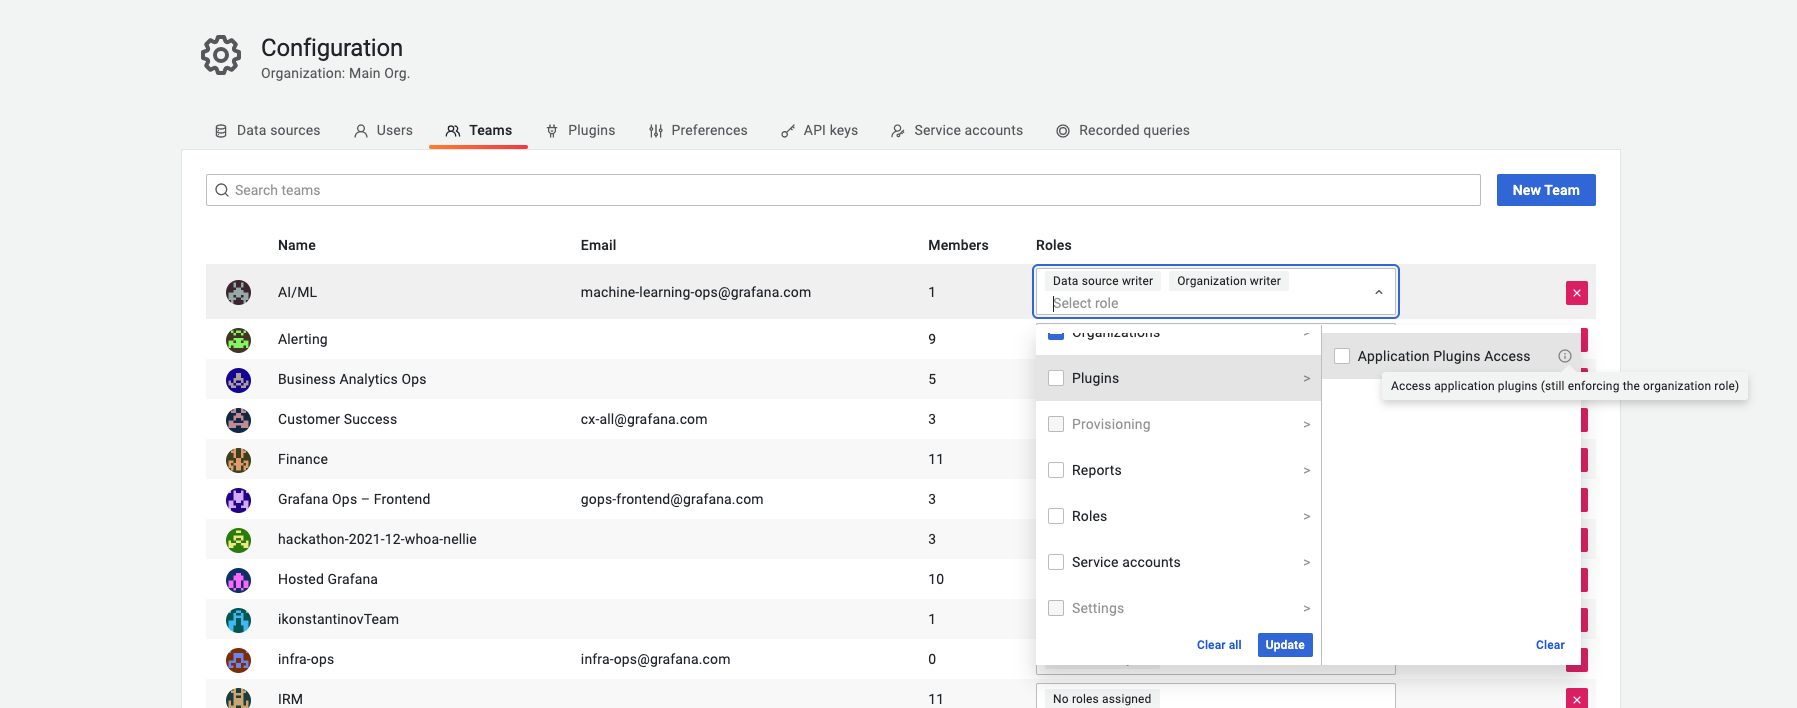
As part of our continued improvements to role-based access control (RBAC), we are rolling out RBAC across all of Grafana’s features. In v9.1, you can determine which users, teams, and roles can access app plugins like OnCall and Synthetics.
Note: You can’t yet define view or edit roles for app plugins. For example, you cannot yet grant a user view-only access to OnCall. This definition is planned for a future release.
You can also control who can view, edit, or administer dashboard and data source usage insights, as well as data source query caching configuration. For more details, see the RBAC documentation.
Rotate your database encryption keys using Grafana’s API
In Grafana version 9.0, we revamped the method Grafana uses to encrypt secrets, like data source credentials, so that you can rotate encryption keys and integrate with a key management system like Hashicorp Vault, AWS Key Management Service, or Azure Key Vault.
Now, you can rotate keys and re-encrypt secrets via API. This makes it easier to configure Grafana to be secure while deploying it. To learn more, see our guide to configuring database encryption.
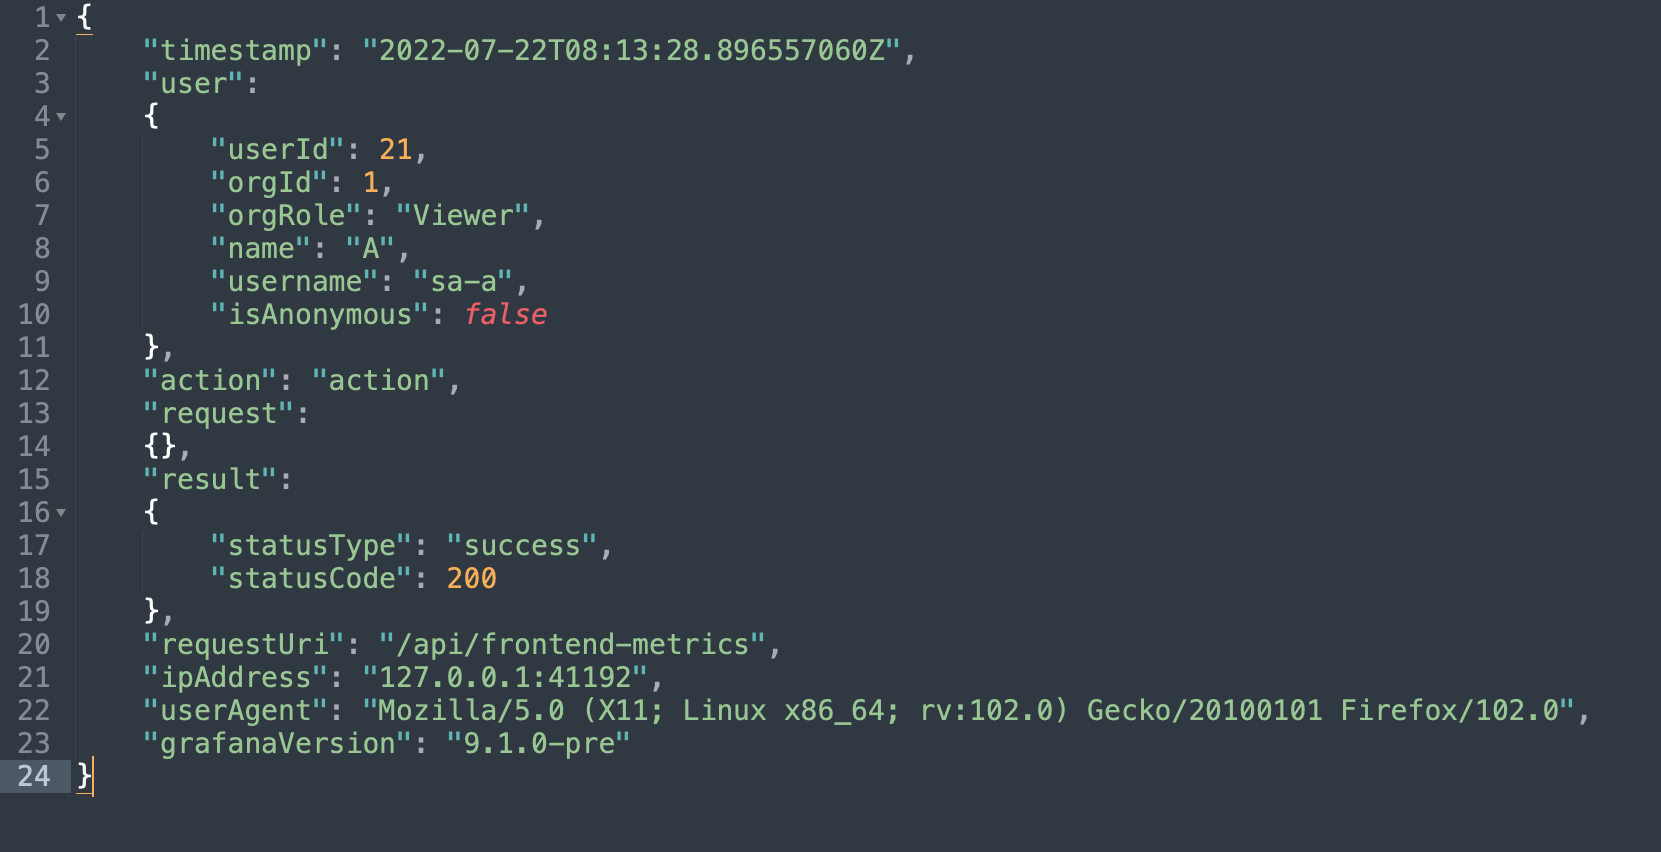
Audit all actions in Grafana using verbose logging
Auditing logs helps you manage and mitigate activity and meet compliance requirements.
By default, Grafana emits an audit log with every action that changes something (like a user creating or updating a dashboard or updating another user’s permissions).
If you want to record all actions on the Grafana server, including GETs and page views, you can now turn on verbose mode.
This results in more logs, but it can be useful to debug specific issues or make sure you catch everything happening in Grafana for security or compliance reasons.
To learn more, see the configuration documentation.
See (and don’t edit) users synced from SAML, LDAP, and OAuth identity providers
When you synchronize users from a SAML, LDAP, or OAuth provider, some user settings, such as name and email address, are synchronized from your identity provider. Previously, you could edit those settings in the Grafana UI, but they would revert back. To make user management clearer, you can now see which settings are synchronized from your identity provider, but you cannot edit those settings. To learn more about authentication, see the documentation.

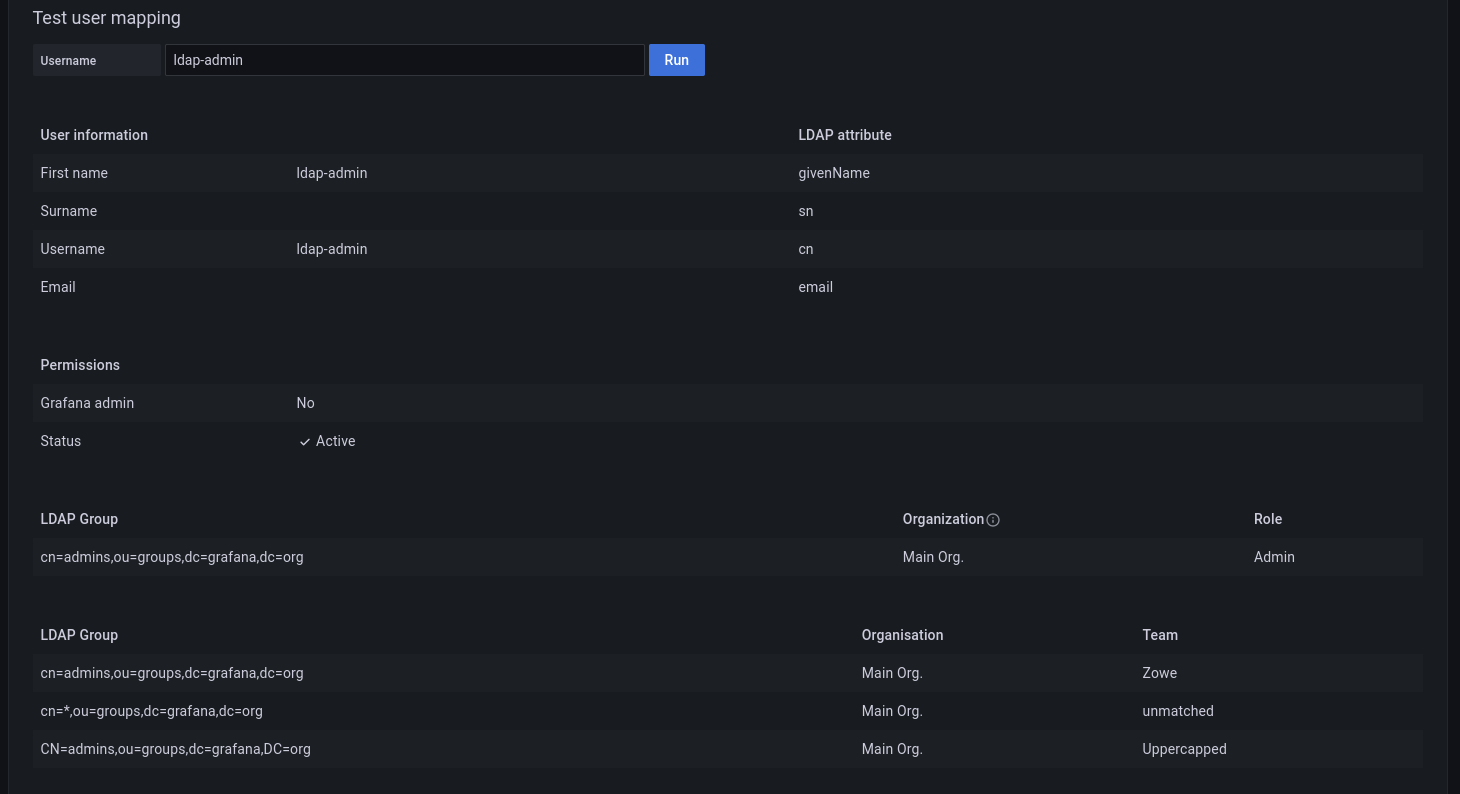
Support wildcards for LDAP groups in team sync
Team sync lets you set up synchronization between your authentication provider’s teams and Grafana teams. To leverage your existing Active Directory in an efficient way without having to create multiple teams, you can now use wildcards when configuring LDAP groups, so that multiple Active Directory groups can be added at once to a single team.
Redirect binding support for AzureAD SAML Single Logout
SAML Single Logout allows users to log out from all applications associated with the current IdP (Identity Provider) session established via SAML Single Sign-On (SSO). To enable integration of more use cases, we have added support for an HTTP-Redirect binding for a Single Logout.


