Get started with Grafana and Prometheus
Prometheus is an open source monitoring system for which Grafana provides out-of-the-box support. This topic walks you through the steps to create a series of dashboards in Grafana to display system metrics for a server monitored by Prometheus.
Grafana and Prometheus:
- Download Prometheus and node_exporter
- Install Prometheus node_exporter
- Install and configure Prometheus
- Configure Prometheus for Grafana
- Check Prometheus metrics in Grafana Explore view
- Start building dashboards
Download Prometheus and node_exporter
Download the following components:
Like Grafana, you can install Prometheus on many different operating systems. Refer to the Prometheus download page to see a list of stable versions of Prometheus components.
Install Prometheus node_exporter
Install node_exporter on all hosts you want to monitor. This guide shows you how to install it locally.
Prometheus node_exporter is a widely used tool that exposes system metrics. For instructions on installing node_exporter, refer to the Installing and running the node_exporter section in the Prometheus documentation.
When you run node_exporter locally, navigate to http://localhost:9100/metrics to check that it is exporting metrics.
Note
The instructions in the referenced topic are intended for Linux users. You may have to alter the instructions slightly depending on your operating system. For example, if you are on Windows, use the windows_exporter instead.
Install and configure Prometheus
After downloading Prometheus, extract it and navigate to the directory.
tar xvfz prometheus-*.tar.gz
cd prometheus-*
Locate the
prometheus.ymlfile in the directory.Modify Prometheus’s configuration file to monitor the hosts where you installed node_exporter.
By default, Prometheus looks for the file prometheus.yml in the current working directory. This behavior can be changed via the --config.file command line flag. For example, some Prometheus installers use it to set the configuration file to /etc/prometheus/prometheus.yml.
The following example shows you the code you should add. Notice that static configs targets are set to ['localhost:9100'] to target node-explorer when running it locally.
 # A scrape configuration containing exactly one endpoint to scrape from node_exporter running on a host:
 scrape_configs:
     # The job name is added as a label `job=<job_name>` to any timeseries scraped from this config.
     - job_name: 'node'

     # metrics_path defaults to '/metrics'
     # scheme defaults to 'http'.

       static_configs:
       - targets: ['localhost:9100']
Start the Prometheus service:
./prometheus --config.file=./prometheus.ymlConfirm that Prometheus is running by navigating to
http://localhost:9090.
You can see that the node_exporter metrics have been delivered to Prometheus. Next, the metrics will be sent to Grafana.
Configure Prometheus for Grafana
When running Prometheus locally, there are two ways to configure Prometheus for Grafana. You can use a hosted Grafana instance at Grafana Cloud or run Grafana locally.
This guide describes configuring Prometheus in a hosted Grafana instance on Grafana Cloud.
- Sign up for https://grafana.com/. Grafana gives you a Prometheus instance out of the box.

- Because you are running your own Prometheus instance locally, you must
remote_writeyour metrics to the Grafana.com Prometheus instance. Grafana provides code to add to yourprometheus.ymlconfig file. This includes a remote write endpoint, your user name and password.
Add the following code to your prometheus.yml file to begin sending metrics to your hosted Grafana instance.
remote_write:
- url: <https://your-remote-write-endpoint>
  basic_auth:
    username: <your user name>
    password: <Your Grafana.com API Key>
Note
To configure your Prometheus instance to work with Grafana locally instead of Grafana Cloud, install Grafana here and follow the configuration steps listed here.
Check Prometheus metrics in Grafana Explore view
In your Grafana instance, go to the Explore view and build queries to experiment with the metrics you want to monitor. Here you can also debug issues related to collecting metrics from Prometheus.
Start building dashboards
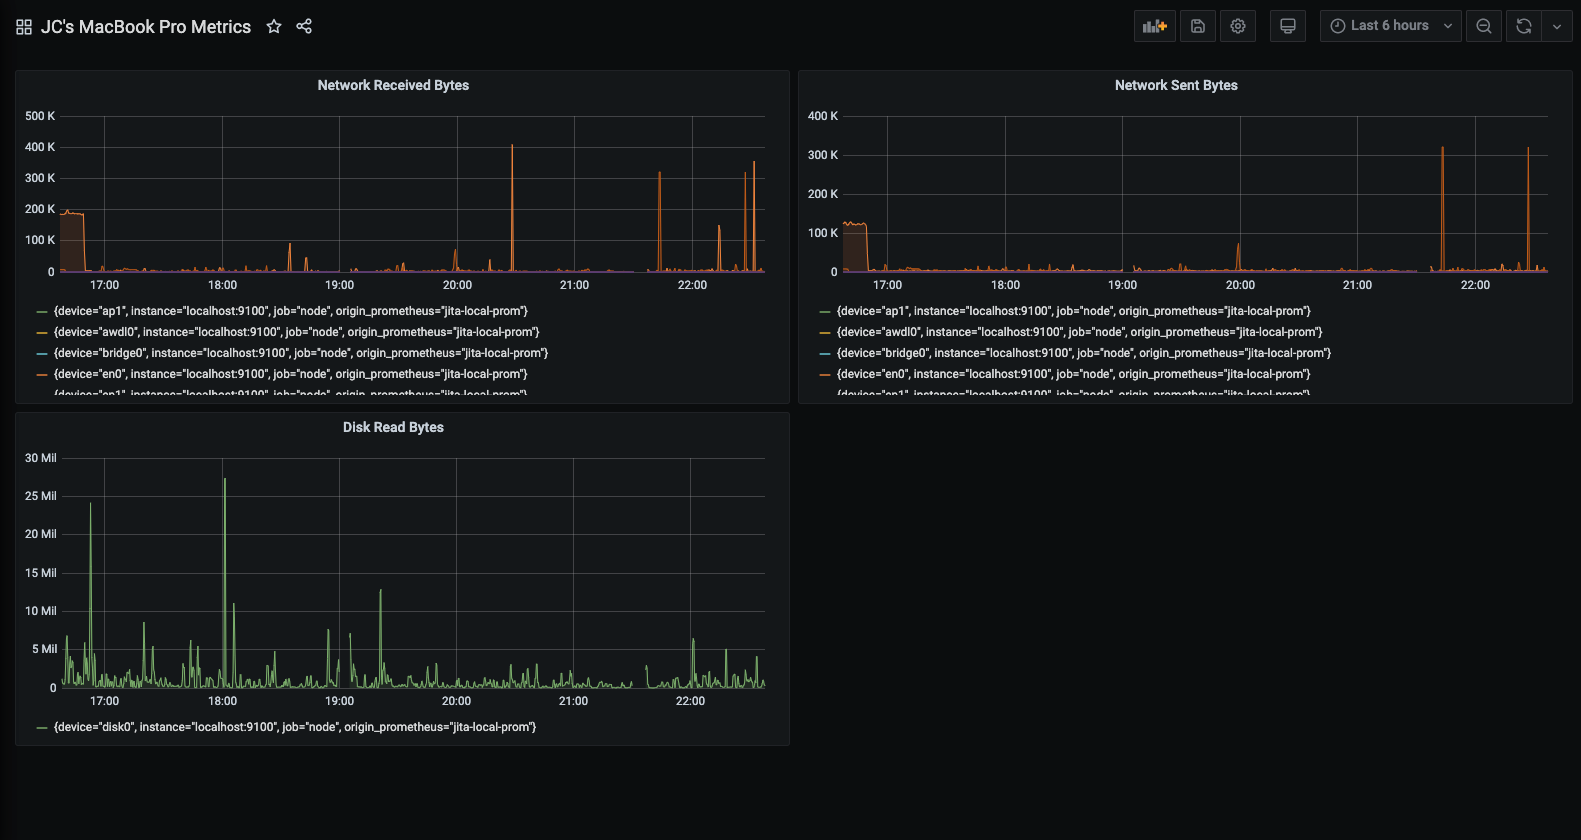
Now that you have a curated list of queries, create dashboards to render system metrics monitored by Prometheus. When you install Prometheus and node_exporter or windows_exporter, you will find recommended dashboards for use.
The following image shows a dashboard with three panels showing some system metrics.

To learn more:
- Grafana documentation: Prometheus data source
- Prometheus documentation: What is Prometheus?


