
Release date:
Menu
Grafana Cloud
RSS
What’s new in Grafana Cloud
Grafana Labs products, projects, and features can go through multiple release stages before becoming generally available. These stages in the release life cycle can present varying degrees of stability and support. For more information, refer to release life cycle for Grafana Labs.
Loading...
Area of interest:
Cloud availability:
Cloud editions:
Self-managed availability:
Self-managed editions:
No results found. Please adjust your filters or search criteria.
Page:
Recording rules for Grafana-managed alerts
Generally AvailableAlerting
Release date: 2024-09-30
Create recording rules for Grafana-managed alert rules to calculate frequently needed expressions or computationally expensive expressions in advance and save the result as a new set of time series. Querying this new time series is faster, especially for dashboards since they query the same expression every time the dashboards refresh. Previously, this was only available for data-source managed alert rules.
In Grafana OSS and Enterprise, you can create both Grafana-managed and data source-managed recording rules if you enable the grafanaManagedRecordingRules feature flag.
GitHub App authentication for the GitHub data source
Generally AvailableData sourcesPlugins
Release date: 2024-09-30
You can now authenticate the GitHub data source using a GitHub App, providing an alternative to personal access tokens (PATs). GitHub App authentication offers enhanced security by granting more granular permissions, reducing the risk of over-permissioning.
For more information, refer to the GitHub data source documentation for detailed instructions on setting up GitHub App authentication.
Actions for visualizations
ExperimentalDashboards and visualizations
Release date: 2024-09-27
We’ve updated several visualizations so that now you can add actions to them. The panel configuration now includes a Data links and actions section where you can add actions that can each be configured to call an API endpoint.
Also, we’ve also added the ability to control the order in which actions are displayed in the tooltip by dragging and dropping them.
Simplified query section for alert rule creation
Generally AvailableAlerting
Release date: 2024-09-27
Introduces a simplified version of the query and alert conditions step for creating Grafana-managed alert rules. The default options streamline rule creation with a cleaner header and a single query and condition. For more complex rules, switch to advanced options to add multiple queries and expressions.
This feature is rolling out to Grafana Cloud over the next couple of weeks.

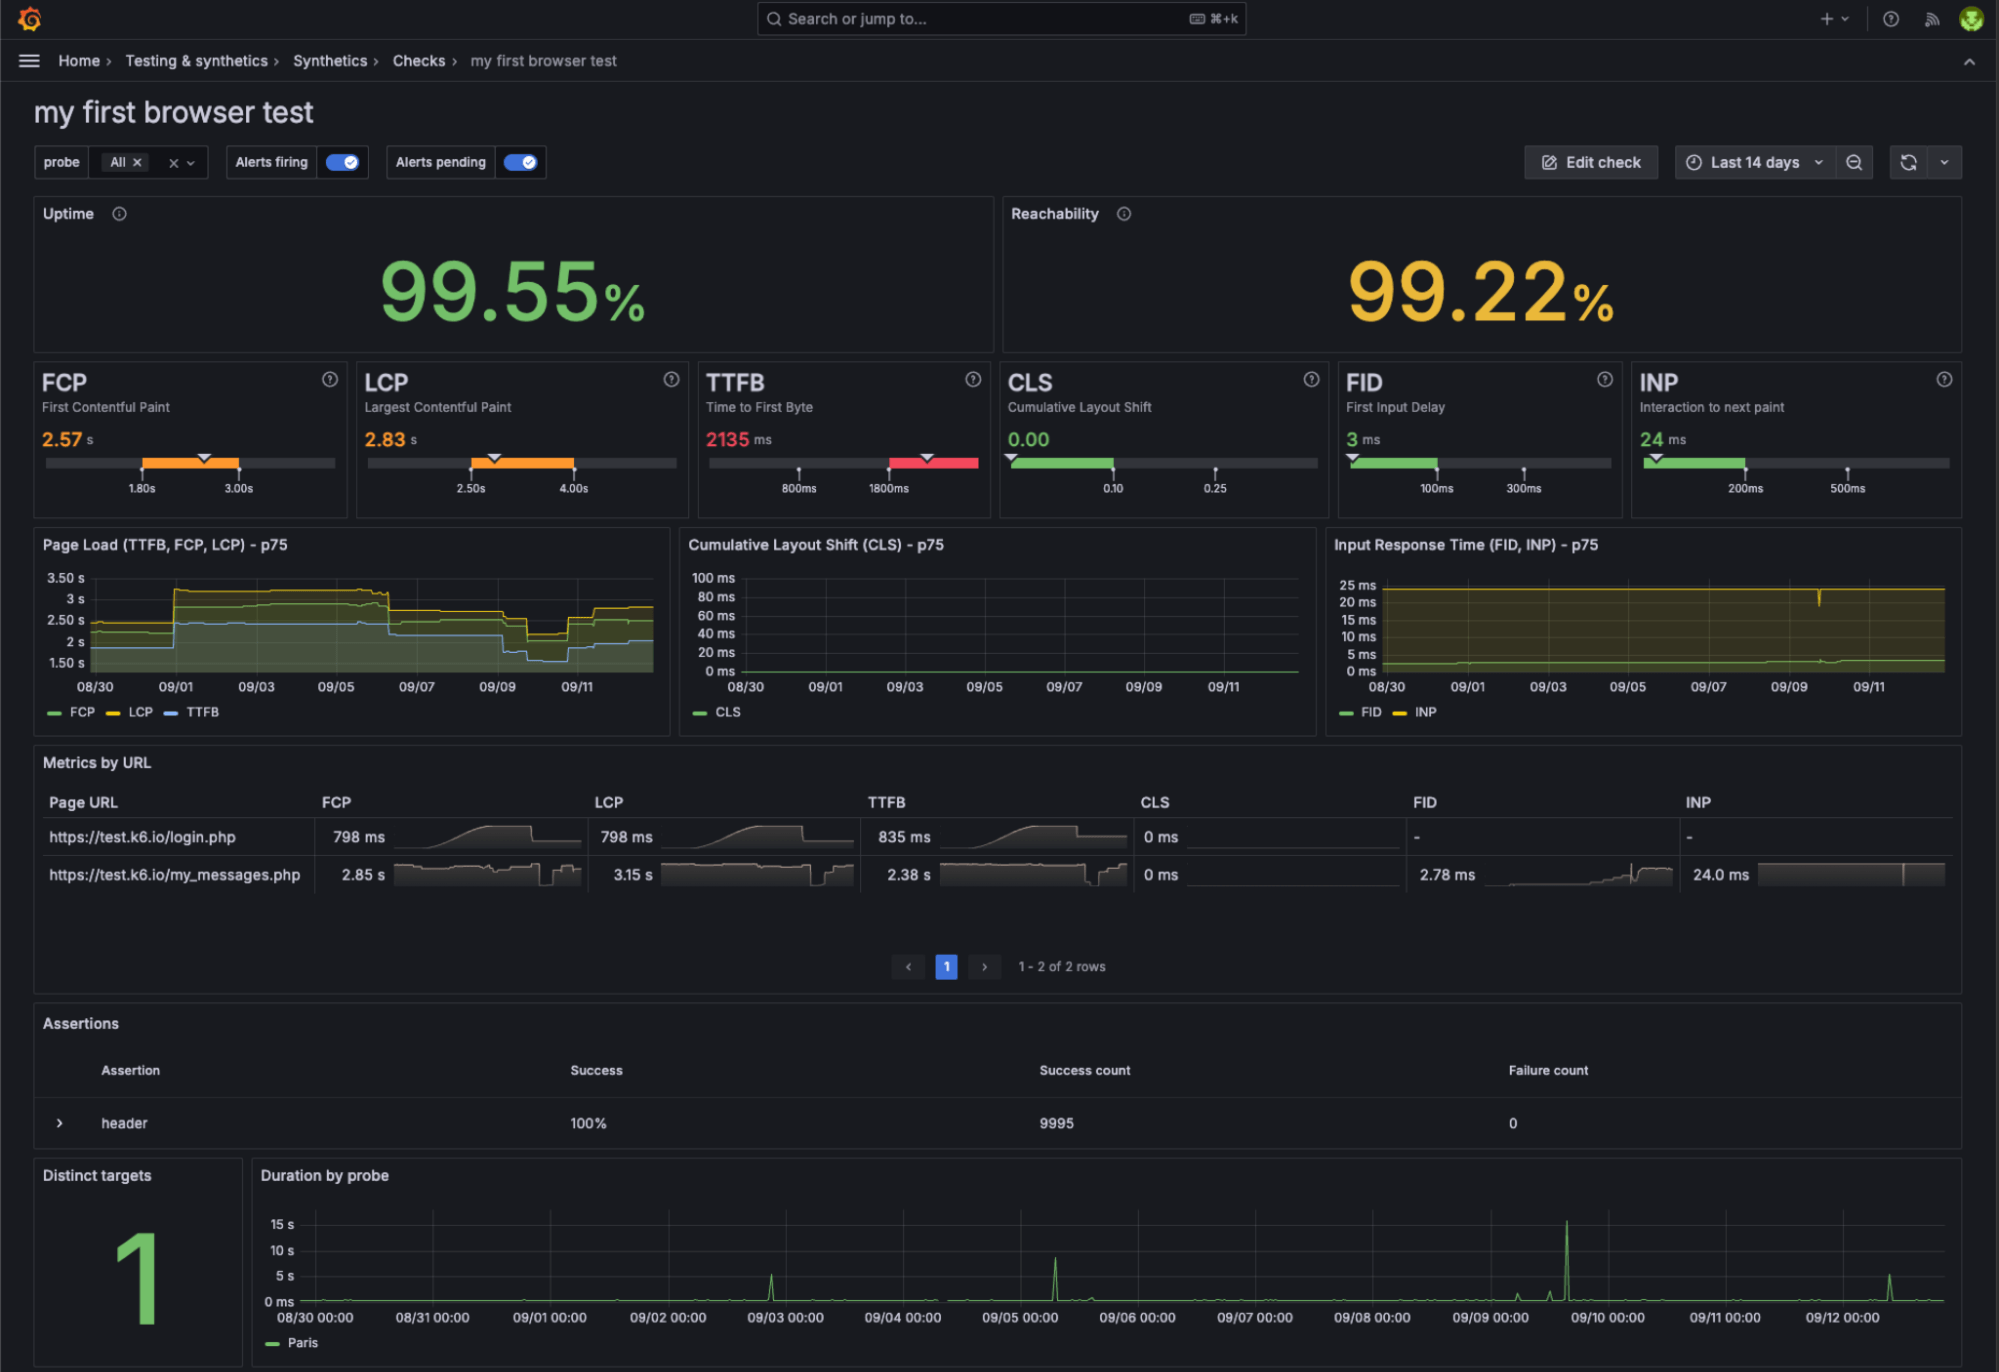
k6 browser checks in Synthetic Monitoring are now in private preview
Available in private previewSynthetic Monitoring
Release date: 2024-09-26
We’re excited to announce that k6 browser checks in Synthetic Monitoring are now in private preview.
With k6 browser checks, you can control a headless Chrome browser using a k6 script. Powered by the k6 browser module, browser checks collect frontend Web Vitals metrics, capture custom performance metrics, and simulate user actions like clicking buttons or filling forms. Any scripts you create are also portable between Synthetic Monitoring and Grafana Cloud k6, as they are backed by the same engine, allowing you to reuse your monitoring scripts for performance testing and vice versa.
Redesigned sharing experience in Dashboards
Generally AvailableDashboards and visualizations
Release date: 2024-09-25
Introducing a redesigned sharing experience in Dashboards! The redesigned sharing model is leaner, easier to navigate, and more focused on what you want to do.
Previously, the way you shared dashboards could be confusing, with various options like Link, Snapshot, Export, PDF, Report, and Public Dashboard all in one dialog box. The redesigned experience features a more visible and accessible Share button, options grouped based on common user needs, and a new Export option.

Generally Available
Release date: 2024-09-25
We’ve renamed the Public dashboards feature, Shared dashboards. This renaming is part of our overall redesign of dashboard sharing and aims to better align externally shared dashboards with other dashboard sharing options.
The feature still functions the same way, but the configuration options that were previously part of public dashboards are now found in the Share externally option in the Share drop-down list.
OpenID Connect Discovery URL for Generic OAuth
Generally AvailableAuthentication and authorization
Release date: 2024-09-24
The OpenID Connect Discovery URL is available in the Generic OAuth form. The info extracted from this URL will be used to populate the Auth URL, Token URL and API URL fields.
Generate SAML certificate and private key
Generally AvailableAuthentication and authorization
Release date: 2024-09-24
You can generate a new certificate and private key for SAML directly from the UI form. Click on the Generate key and certificate button from the Sign requests tab in the SAML form and then fill in the information you want to be embedded in your generated certificate.
Explore Logs
Generally AvailableLogs
Release date: 2024-09-24
Explore Logs offers a queryless experience for easily surfacing insights from logs stored in Grafana Loki, Grafana Cloud Logs, and Grafana Enterprise Logs.
You can spot troublesome services without running a single query, and quickly add filters with point-and-click interactions. Explore Logs generates visualizations of log volumes to let you easily detect anomalies or related changes across labels and over time. Patterns help you identify sources of signal or filter our sources of noise in your log line content, further accelerating your troubleshooting process.
Explore Metrics
Generally AvailableMetrics
Release date: 2024-09-24
Explore Metrics, generally available in Grafana OSS, Grafana Enterprise, and Grafana Cloud, offers a queryless experience to visualize time series data stored in Prometheus or any Prometheus-compatible time-series database.
Users can search and select a metric name and immediately see the optimal visualization type, whether the metric is a gauge, counter, or histogram. They can also review your selected metric broken down by each of its labels, which makes it easy to spot anomalies by namespace, cluster, or any other attribute. Additionally, they can see related metrics based on your selected metrics for a more comprehensive understanding of their environment.
Explore Profiles
Available in public previewExplore ProfilesProfiles
Release date: 2024-09-24
Explore Profiles offers a queryless experience for easily surfacing insights from profiles stored in Grafana Pyroscope and Grafana Cloud Profiles.
Profiling data helps developers identify which parts of a program consume the most resources, such as CPU time, memory, or I/O operations. Profiling, as a signal, lets you either proactively or reactively address performance issues in multiple areas areas.
Explore Traces
Available in public previewExplore TracesTraces
Release date: 2024-09-24
Explore Traces offers a queryless experience for easily surfacing insights from traces stored in Grafana Tempo, Grafana Cloud Traces, and Grafana Enterprise Traces.
Explore Traces helps you make sense of your tracing data so you can automatically visualize insights from your Tempo traces data. The app helps you understand errors and latency issues within complex distributed systems.
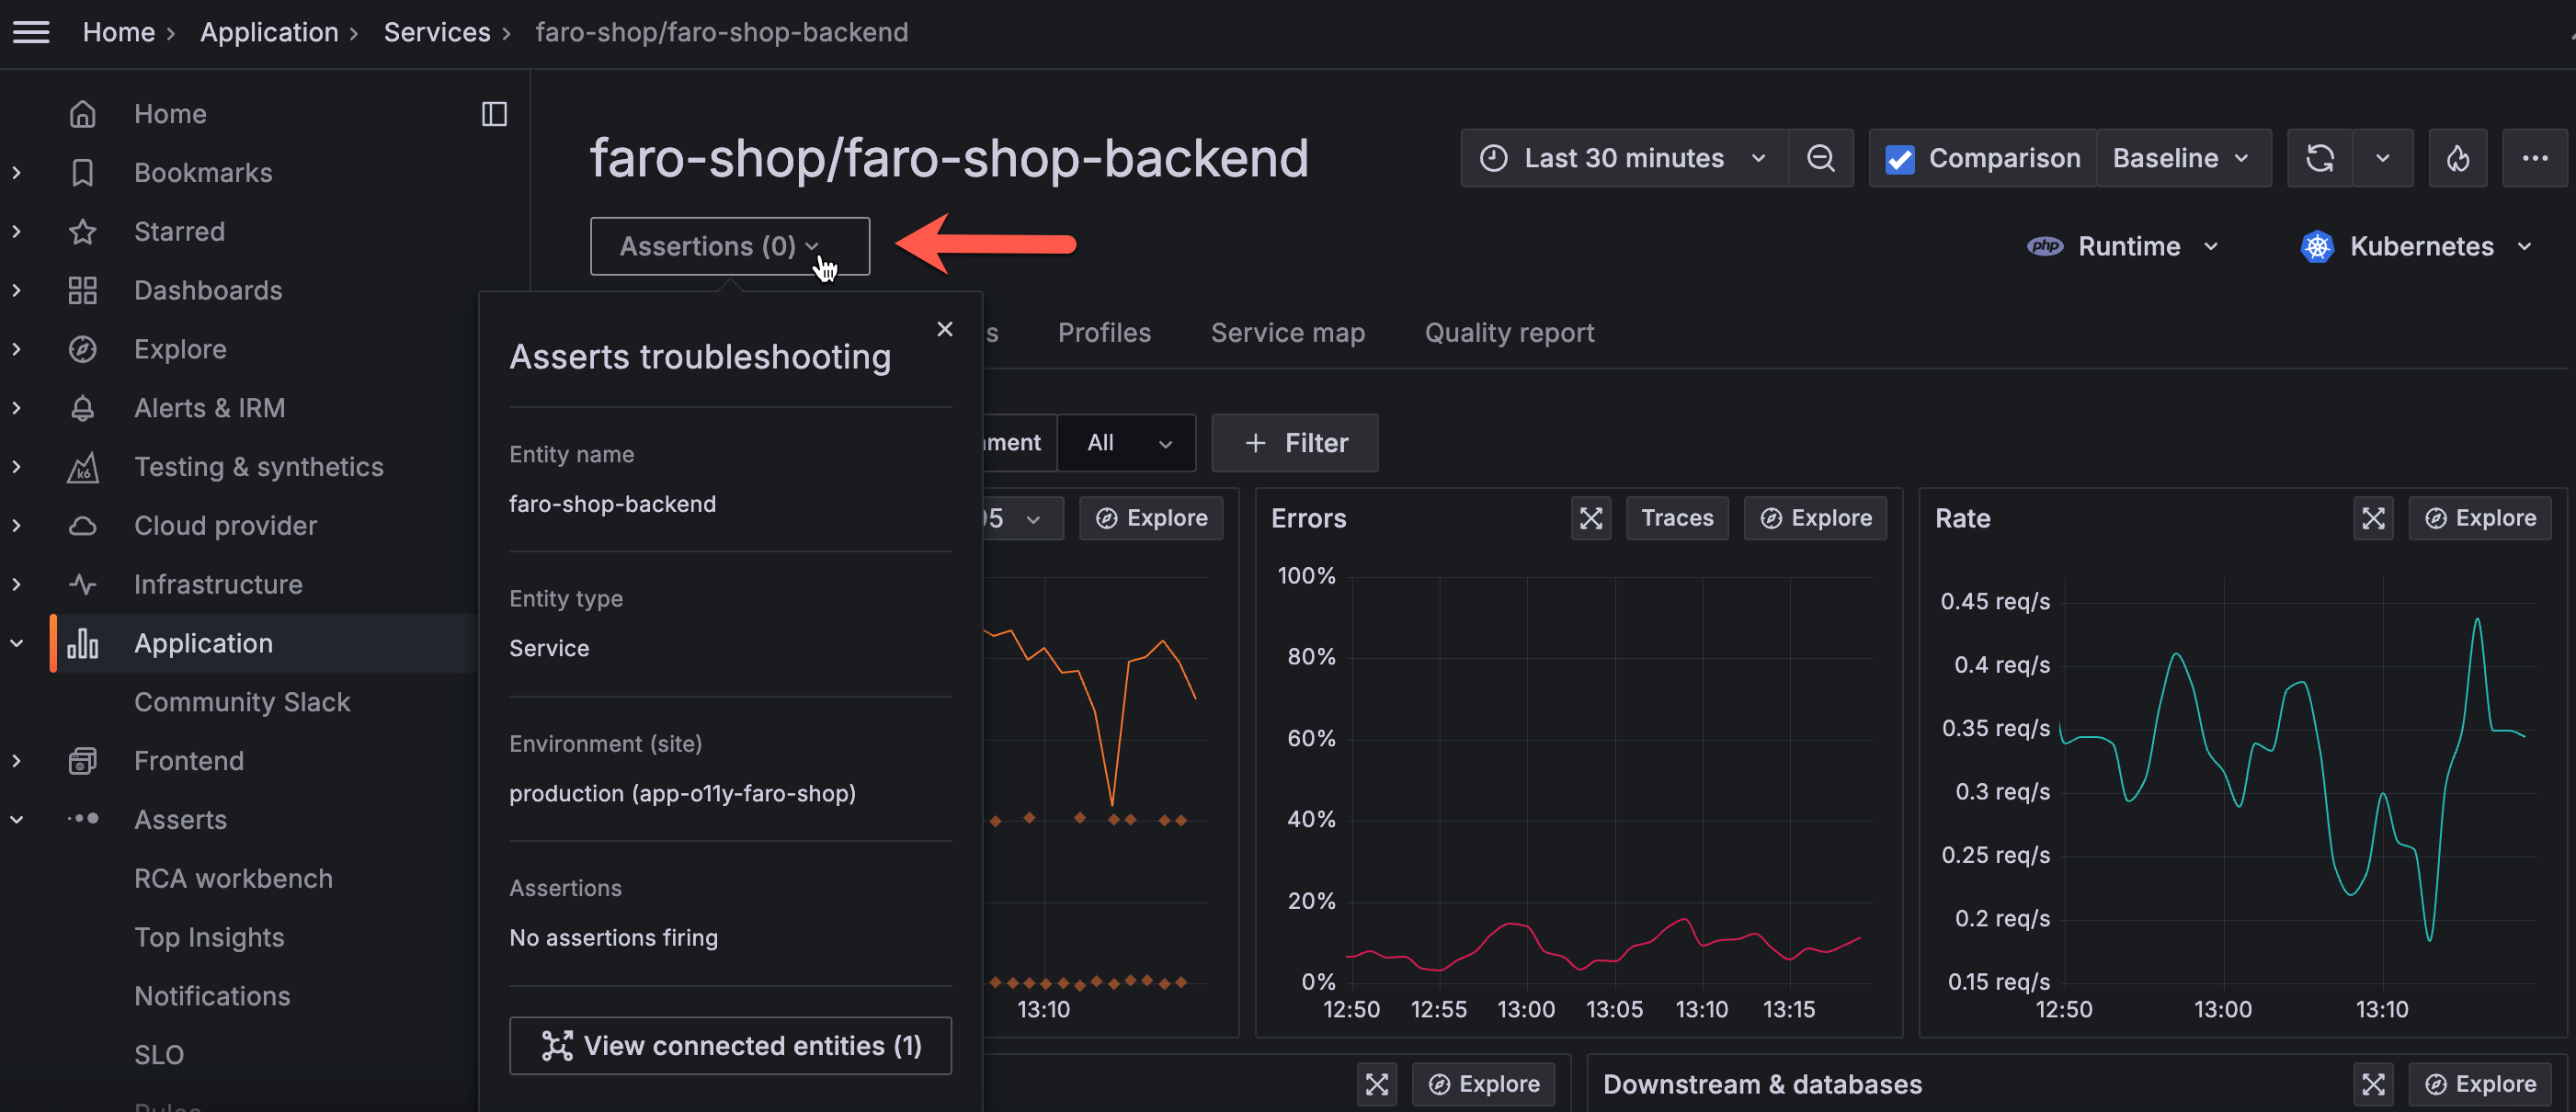
Grafana Cloud Asserts
Generally Available
Release date: 2024-09-24
Asserts now supports root cause analysis bi-directional navigation between Asserts and Grafana Application Observability and Kubernetes Monitoring. When you are in Application Observability or Kubernetes Monitoring, you can seamlessly explore Assertions in Asserts without losing context. When in Asserts, you can easily navigate to Application Observability or Kubernetes Monitoring.
Grafana Cloud Asserts infrastructure solution dashboards
Asserts now automatically surfaces KPI dashboards for popular infrastructure components. If you’ve installed any of the following Grafana Cloud integrations, these dashboards automatically appear in Asserts.
- MongoDB
- Jenkins
- Apache Tomcat
- Windows
- Docker
- MySQL
- SNMP
- PostgreSQL
- Clickhouse
- Caddy
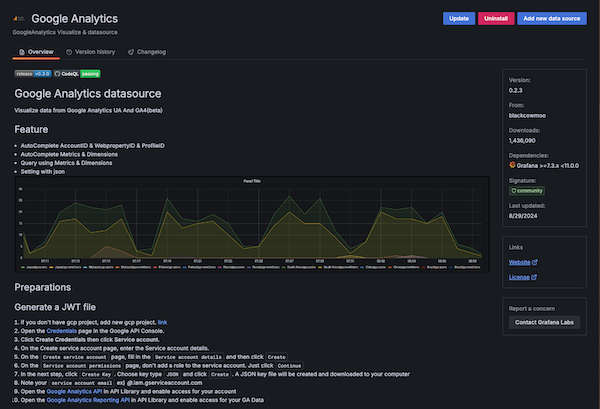
Plugin details page redesign
Available in public previewPlugins
Release date: 2024-09-23
To help make it easier for administrators to assess and interact with Grafana plugins, we are reworking the plugin details page to highlight important metadata, such as when the plugin was last updated.
We intend to further extend this new layout with consistent links for all plugins, to complement the custom links which can currently be optionally configured. This improved consistency will enable simpler interaction with a plugin’s developer - whether that is Grafana Labs, our commercial partners, or our community. These links will include actions such as raising feature requests or bug reports, as well as allowing our community developers to indicate available support and sponsorship options for those that depend on their work.
Was this page helpful?
Related resources from Grafana Labs
5 Mar

Getting started with managing your metrics, logs, and traces using Grafana
In this webinar, we’ll demo how to get started using the LGTM Stack: Loki for logs, Grafana for visualization, Tempo for traces, and Mimir for metrics.
26 Feb

Intro to Kubernetes monitoring in Grafana Cloud
In this webinar you’ll learn how Grafana offers developers and SREs a simple and quick-to-value solution for monitoring their Kubernetes infrastructure.
60 min

Building advanced Grafana dashboards
In this webinar, we’ll demo how to build and format Grafana dashboards.