
Release date:
Menu
Grafana Cloud
RSS
What’s new in Grafana Cloud
Grafana Labs products, projects, and features can go through multiple release stages before becoming generally available. These stages in the release life cycle can present varying degrees of stability and support. For more information, refer to release life cycle for Grafana Labs.
Loading...
Area of interest:
Cloud availability:
Cloud editions:
Self-managed availability:
Self-managed editions:
No results found. Please adjust your filters or search criteria.
Page:
RBAC for alerting notifications
Generally AvailableAlerting
Release date: 2025-01-22
The feature flag alertingApiServer is now enabled by default.
In the UI, administrators have more granular control over which parts of notification settings users have access to.
Tune ML forecasts with instant feedback
Generally AvailableMachine learning
Release date: 2025-01-20
The Machine Learning team is delighted to announce a new dynamic UI for Metric Forecasts!
Will the prediction algorithm see the patterns you expect in your data? If you tweak some of the parameters, will you get a better result?
Introducing new labels in Grafana Incident
Generally AvailableIncidentIRM
Release date: 2025-01-20
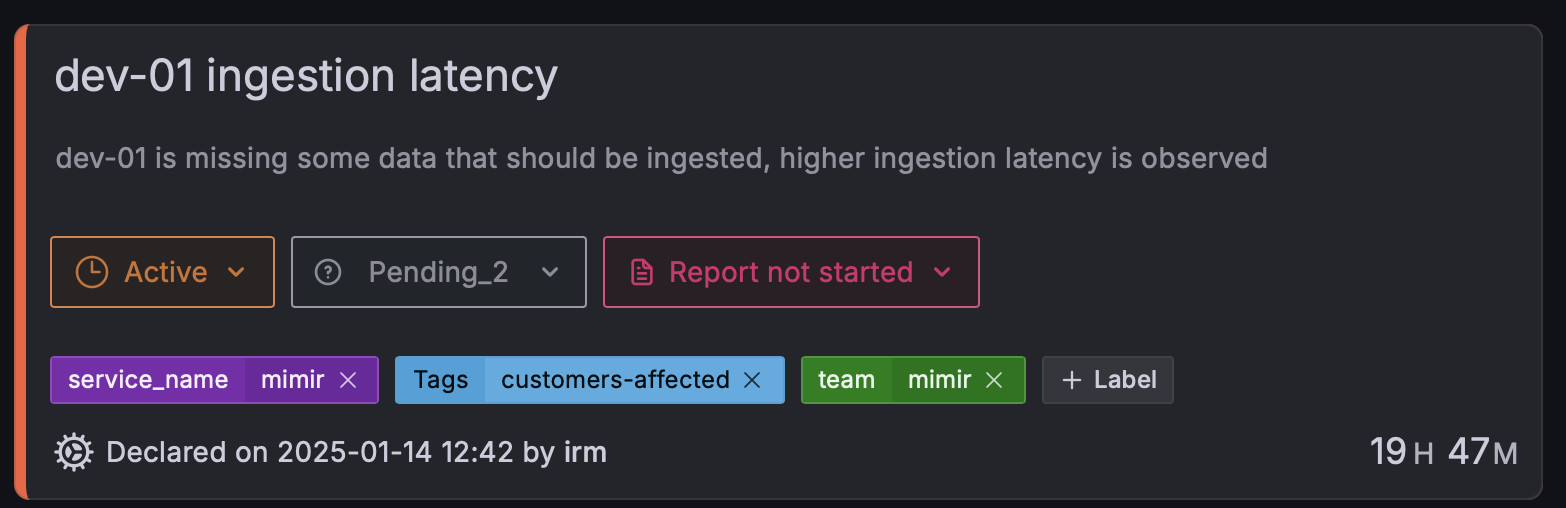
Are you tracking incidents with a few simple tags but still struggling to see the bigger picture? We’ve heard your feedback and have overhauled how you can organize and correlate incidents across your observability workflows.
What’s changing?
Our new labels feature replaces traditional tags with more flexible key-value pairs (for example, squad:incident or service_name:mimir). Beyond just describing an incident, labels are now shared across multiple Grafana products—like OnCall and SLO—tying them together for a more unified experience. We worked hard to make sure that your existing tags are migrated to labels and that existing public APIs continue to work.
Why does it matter?
- Easily annotate incidents with squad, service, or region, or define your own categories.
- With consistent labeling across Incident, OnCall, and SLO, you can query for incidents and alerts impacting the same services.
- By introducing a few restrictions on label naming, we ensure these labels can be passed into more systems without a hitch.
Example Use Cases
- Filter your Grafana SLO dashboards by incidents that share the same
service_namelabel to pinpoint recurring issues. - When an active incident is labeled with a specific squad, OnCall can loop in the right people
- Custom webhooks can use labels to begin automatic actions when an incident is declared and affects a certain cluster/namespace.
Higher reliability for Grafana Cloud Traces with new limits on attribute size
Generally AvailableTraces
Release date: 2025-01-17
Grafana Cloud Traces introduces a new safeguard to help maintain stability and prevent out-of-memory crashes when fetching traces that contain large span attributes. With this change, attributes exceeding 2KB (2048 bytes) are automatically truncated before they’re stored, striking a balance between preserving valuable trace data and maintaining overall system stability.
And if you’re using Grafana Tempo or Grafana Enterprise Traces 2.7 or newer, you can configure your custom limit to maintain a stable and reliable tracing environment.
Per-service drops for Adaptive Logs
Available in public previewAdaptive Telemetry
Release date: 2025-01-16
You can now apply Adaptive Logs recommendations per-service.
This feature is useful if multiple services are producing logs with identical patterns, and you want to treat logs from those services differently. It also makes bulk applying recommendations per service, or team, easier and more useful.
Plugin Frontend Sandbox
Available in private previewPluginsSecurity
Release date: 2025-01-14
The Plugin Frontend Sandbox is a security feature that isolates plugin frontend code from the main Grafana application. When enabled, plugins run in a separate JavaScript context, which provides several security benefits:
- Prevents plugins from modifying parts of the Grafana interface outside their designated areas
- Stops plugins from interfering with other plugins’ functionality
- Protects core Grafana features from being altered by plugins
- Prevents plugins from modifying global browser objects and behaviors
Plugins running inside the Frontend Sandbox should continue to work normally without any noticeable changes in their intended functionality.
OAuth and SAML session handling improvements
Available in public previewAuthentication and authorization
Release date: 2025-01-14
We’ve improved how Grafana manages external sessions for OAuth and SAML, enhancing compatibility with identity providers that support session management.
Grafana can now reliably manage SAML external sessions (Identity Provider sessions) by using the SessionIndex attribute in the SAML assertion and the NameID attribute in the logout request. Previously, Grafana relied on the Login attribute as the NameID and did not include the SessionIndex in the logout request, which could result in users being logged out of all their applications/IdP sessions when logging out of Grafana.
Launch and shutdown dates for synthetics probes in February 2025
Generally AvailableSynthetic Monitoring
Release date: 2025-01-14
Between January 13 - 24, we’re launching eight (8) new public probes in AWS: Calgary, Hyderabad, Indonesia, Montreal, Spain, UAE, Stockholm, and Zurich.
The new probes will replace eight (8) deprecated probes running in Linode and Digital Ocean: Atlanta, Amsterdam, Bangalore, Dallas, Newark, New York, Toronto, and San Francisco.
Migrate your dashboards, data sources, folders, plugins, and alerts to Grafana Cloud
Available in public previewDashboards and visualizationsData sourcesPluginsAlerting
Release date: 2025-01-14
Migrate your Grafana OSS/Enterprise instance to Grafana Cloud in just a few clicks.
The Grafana Cloud Migration Assistant launched in Grafana 11.2 with initial support for dashboards, data sources, and folders. We’re excited to announce support for plugins and Grafana alerts.
Elasticsearch cross-cluster search
Available in public previewData sources
Release date: 2025-01-09
The Elasticsearch data source plugin now offers support for Elasticsearch’s Cross-cluster Search feature.
If you’re a big Elasticsearch user, you might have multiple clusters set up for geographical separation, different teams or departments, compliance, or scaling reasons. Previously, you needed to set up a separate data source in Grafana for each cluster. Now with cross-cluster search, you can query data across all these clusters from a single Grafana data source. This makes it simpler and more convenient to query all of your Elasticsearch logs. You can learn more about this feature in the Elasticsearch docs.
Service account token authentication in OnCall API
Generally AvailableOnCallIRM
Release date: 2025-01-07
We’re excited to introduce service account token authentication for the OnCall API. With this change, you can now generate tokens to interact with the API so that they:
- Aren’t tied to any specific user.
- Can be enabled or disabled as needed.
- Can be set to optionally expire at a given time.
- Can be scoped to a specific set of permissions for more granular control.
In addition, this update allows us to extend the Terraform provider to support this authentication method in the OnCall client. This lets you to configure and manage your Grafana stack, including OnCall resources, all without needing to create an OnCall-specific API token, which simplifies automation and enhances security.
Recommendations in Grafana Cloud k6
Generally AvailableK6
Release date: 2025-01-07
The Grafana Cloud platform and Grafana Cloud k6 application include a broad range of features that can help you maximize the value you get for your testing strategy. But, with several features to learn, sometimes it can take time to figure out where to start.
The new Recommendations tab in the test run View of Grafana Cloud k6 is an intelligent tool that analyzes telemetry data, such as metrics, logs, and traces, to provide tailored best practices for your team. For example, it might suggest:
- Using other Grafana Cloud products such as Synthetic Monitoring
- Exploring Grafana Cloud k6 features such as Private Load Zones
- Correlating Results with Grafana Cloud Traces

Generally AvailableDashboards and visualizations
Release date: 2024-12-18
We’ve made some big changes to the panel image sharing experience. When you share a panel link, there’s a new Panel preview section where you can:
- Customize a panel image.
- See a preview of the panel image.
- Download and share the image without a URL.
You can customize the image by updating the width, height, and scale of it:

New Grafana Cloud k6 HTTP API is generally available
Generally AvailableK6
Release date: 2024-12-18
We’re excited to announce that a new version of the Grafana Cloud k6 API is now available!
The new Grafana Cloud k6 API includes endpoints that make it easier for teams to integrate k6 with their CI/CD processes. You can:
- Start and stop test runs
- Start a test run with a test ID
- Upload and download scripts
- Manage project limits
- Save and unsave test results
- Get cost estimates and execution cost for test runs
- Inspect the test run lifecycle
Grafana SLO now supports Grafana-managed alert rules
Generally AvailableSLOsAlerting
Release date: 2024-12-12
Grafana-managed alert rules are now supported in Grafana SLO!
Grafana-managed alerting rules gives you access to features like alerting annotations on SLO dashboard panels, SLO alert state history, and images in SLO alert notifications.
Your alerting system can be managed via plugin preferences, and can be set to generate either datasource-managed alert rules, or Grafana-managed alert rules. Check out the documentation for more information.
Was this page helpful?
Related resources from Grafana Labs
5 Mar

Getting started with managing your metrics, logs, and traces using Grafana
In this webinar, we’ll demo how to get started using the LGTM Stack: Loki for logs, Grafana for visualization, Tempo for traces, and Mimir for metrics.
26 Feb

Intro to Kubernetes monitoring in Grafana Cloud
In this webinar you’ll learn how Grafana offers developers and SREs a simple and quick-to-value solution for monitoring their Kubernetes infrastructure.
60 min

Building advanced Grafana dashboards
In this webinar, we’ll demo how to build and format Grafana dashboards.