
Release date:
Menu
Grafana Cloud
RSS
What’s new in Grafana Cloud
Grafana Labs products, projects, and features can go through multiple release stages before becoming generally available. These stages in the release life cycle can present varying degrees of stability and support. For more information, refer to release life cycle for Grafana Labs.
Loading...
Area of interest:
Cloud availability:
Cloud editions:
Self-managed availability:
Self-managed editions:
No results found. Please adjust your filters or search criteria.
Page:
Generally AvailableDashboards and visualizations
Release date: 2024-11-19
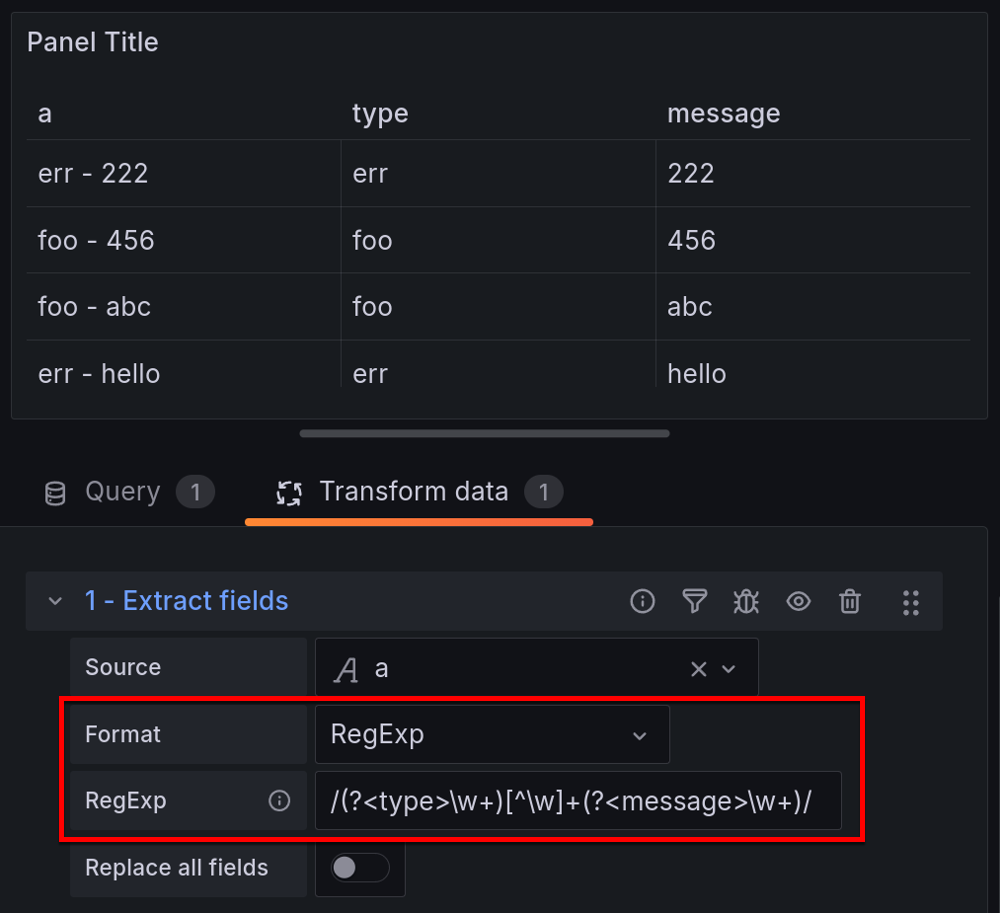
New regular expression option for Extract fields transformation
We’ve updated the Extract fields transformation with an additional RegExp format option you can use to perform more advanced parsing of the selected field, such as extracting parts of strings or splitting content into multiple fields using named capturing groups like /(?<NewField>.*)/.
Generally AvailableData sources
Release date: 2024-11-15
OpenSearch data source supports Private Data Source Connect (PDC)
Version 2.21.0 of the Grafana OpenSearch plugin introduces support for private data source connect (PDC).
PDC is a way for you to establish a private, secured connection between a Grafana Cloud instance, or stack, and data sources secured within a private network. This makes it possible to take advantage of the convenience and power of Grafana Cloud, even if your OpenSearch cluster is hosted in a Virtual Private Cloud (VPC) or another private network.
Generally Available
Release date: 2024-11-14
Reporting theme options
Introducing theme options for Reporting
Admins can now choose independent light or dark themes for the PDF attachment and embedded dashboard image in reports. Selected theme options are applied to PDFs and embedded images for all reports within the organization.

Generally AvailableOnCall
Release date: 2024-11-08
Introducing Enhanced Push Notification Settings in v2.2.0 [Android]
We’ve introduced a new section under Settings > Push Notifications to ensure reliable delivery of notifications by actively prompting users to disable battery optimization and inactivity restrictions on Android devices.
Here’s what’s new:
![Introducing Enhanced Push Notification Settings in v2.2.0 [Android]](/static/img/oncall/push0_s.png?w=1500)
Generally AvailableSynthetic Monitoring
Release date: 2024-11-07
Eight synthetics probe locations being replaced in February 2025
Starting in early 2025 we will roll out eight new public probe locations running in AWS: Stockholm, Zurich, Spain, UAE, Montreal, Calgary, Hyderabad, and Indonesia.
These eight new regions will replace the remaining eight locations running out of Linode and Digital Ocean: Atlanta, Dallas, Newark, Toronto, New York, San Francisco, Amsterdam, and Bangalore. These regions are deprecated and will be removed between January 27 and February 14, 2025. Exact dates and times will be posted as maintenance notices on our status page.
Why are we doing this?
Available in public previewDashboards and visualizations
Release date: 2024-10-28
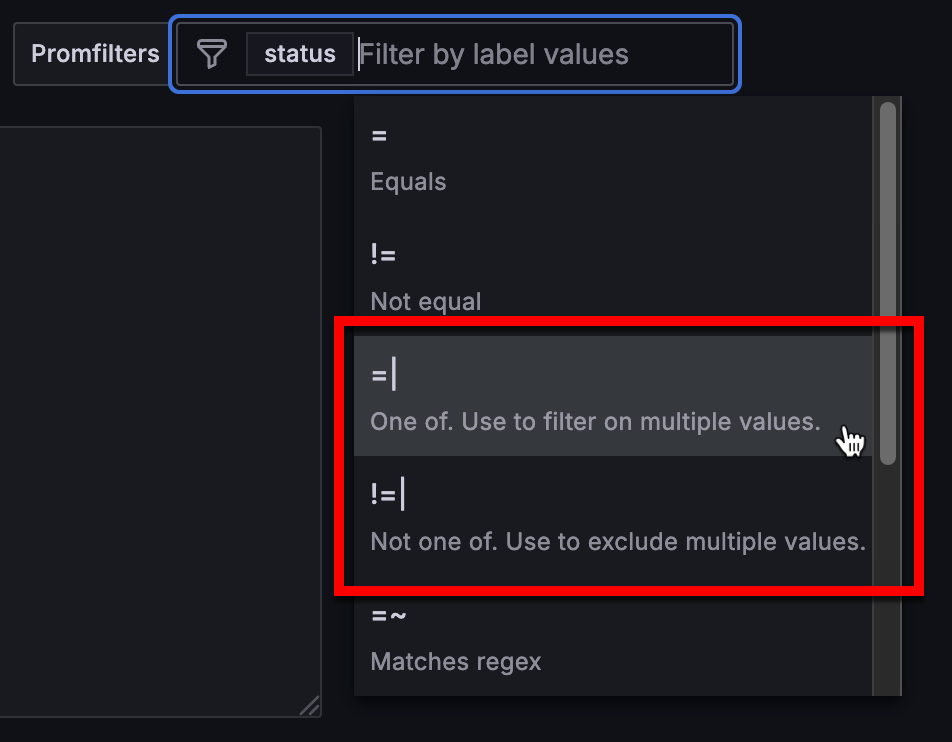
Redesigned filters for dashboards
We’ve redesigned dashboard filters for an improved filter creation experience!
The redesigned filters are more prominent in the dashboard and filters based on the same ad hoc filter variable are more clearly related. In the new design, you can click anywhere in the filter field to begin creating a one and Grafana automatically detects which part of the filter you’re setting up. It takes fewer clicks to create a filter and the creation process using keyboard strokes is smoother than previously.
Generally AvailableOnCallIncident
Release date: 2024-10-24
The Grafana IRM app: A new era for mobile Incident Response Management
We’re excited to announce the release of Grafana IRM Mobile, the next evolution of our mobile app which was previously known as Grafana OnCall. This rebrand marks a major step forward in providing teams with a seamless, comprehensive way to manage incidents—all from your mobile device.
Beyond Alerts: Embracing Incidents
While the Grafana OnCall mobile app enabled on-call engineers to never miss an alert and stay on top of their on-call schedules, we heard that you wanted even more power when on the move.
Generally AvailableDashboards and visualizations
Release date: 2024-10-22
Add correlations to external URLs in Explore
Correlations is a feature that allows Grafana users to set up links between their data sources. Previously, the link generated would only be from one query to another—meaning results from a query could only generate links to open a second Explore pane with other query results.
With this feature, users can now link to third party web-based software based on their search results. The format follows the standard Grafana format for using variables.
Generally AvailableAuthentication and authorizationPlugins
Release date: 2024-10-21
RBAC for Plugins
We’re excited to announce that plugins can now leverage Grafana’s role based access control to define their own roles and permissions in order to control access to their routes.
To define roles and their default assignments, plugin developers need to add a roles section to their plugin.json file. Grafana will automatically register these roles and assign them to the corresponding basic roles: Viewer, Editor, Admin, and Grafana Admin.
Generally AvailableOnCallIncident
Release date: 2024-10-11
New escalation step: Declare an incident automatically
A new escalation step is now available in Grafana OnCall. You can configure your escalation chains to automatically create an incident in Grafana Incident with a specified severity.
If a critical alert group is identified (outside of the default route), and earlier steps in the escalation chain don’t resolve the issue, the chain will now declare an incident as part of the response process.
Generally AvailableExplore LogsPlugins
Release date: 2024-10-10
Explore Logs plugin installed by default
Explore Logs is a plugin that lets you automatically visualize and explore your logs without having to write queries. It makes finding spikes in your log volume, filtering your logs and pinpointing problematic log lines a lot easier and more smooth.
While Explore Logs is GA in cloud and installed by default already, with Grafana v11.3.0 it will be automatically installed on your on-prem instance as well. This will let you use Explore Logs alongside Explore Metrics.
Generally AvailableMetricsExplore Metrics
Release date: 2024-10-09
Series limit in the Prometheus metrics browser
Introducing the Series limit in the Metrics browser.
On occasion, a Prometheus instance may contain a metric that has many, many series. When this happens the metrics browser can become slow or break when searching labels on a metric.

Generally AvailableSynthetic Monitoring
Release date: 2024-10-09
k6 scripted checks in Synthetic Monitoring are now generally available
We’re excited to announce that k6 scripted checks in Synthetic Monitoring are now generally available.
k6 scripted checks were released in May 2024 as a public preview, to give you the power and flexibility to define your workflow tests in JavaScript, using the k6 API to efficiently author tests.
Available in public previewSynthetic Monitoring
Release date: 2024-10-09
k6 browser checks in Synthetic Monitoring are now in public preview
We’re excited to announce that k6 browser checks in Synthetic Monitoring are now in public preview.
With k6 browser checks, you can control a headless Chrome browser using a k6 script. Powered by the k6 browser module, browser checks collect frontend Web Vitals metrics, capture custom performance metrics, and simulate user actions like clicking buttons or filling forms. Any scripts you create are also portable between Synthetic Monitoring and Grafana Cloud k6, as they are backed by the same engine, allowing you to reuse your monitoring scripts for performance testing and vice versa.
Available in public previewAlertingAuthentication and authorization
Release date: 2024-10-07
Role-based access control for notifications in Alerting
Manage contact points, mute timings, and notification templates through Role-Based Access Control (RBAC). Choose who can create, edit, and read contact points, mute timings, and notification templates using permissions or fixed roles.
For mute timings and notification templates, you can grant all users all permissions or no permissions. For contact points, you can extend or limit permissions to individual contact points.
Was this page helpful?
Related resources from Grafana Labs
60 min

Getting started with managing your metrics, logs, and traces using Grafana
In this webinar, we’ll demo how to get started using the LGTM Stack: Loki for logs, Grafana for visualization, Tempo for traces, and Mimir for metrics.
60 min

Intro to Kubernetes monitoring in Grafana Cloud
In this webinar you’ll learn how Grafana offers developers and SREs a simple and quick-to-value solution for monitoring their Kubernetes infrastructure.
60 min

Building advanced Grafana dashboards
In this webinar, we’ll demo how to build and format Grafana dashboards.