
Menu
Grafana Cloud
← Back to What's newIntroducing new labels in Grafana Incident
Generally AvailableIncidentIRM
Release date: 2025-01-20
Are you tracking incidents with a few simple tags but still struggling to see the bigger picture? We’ve heard your feedback and have overhauled how you can organize and correlate incidents across your observability workflows.
What’s changing?
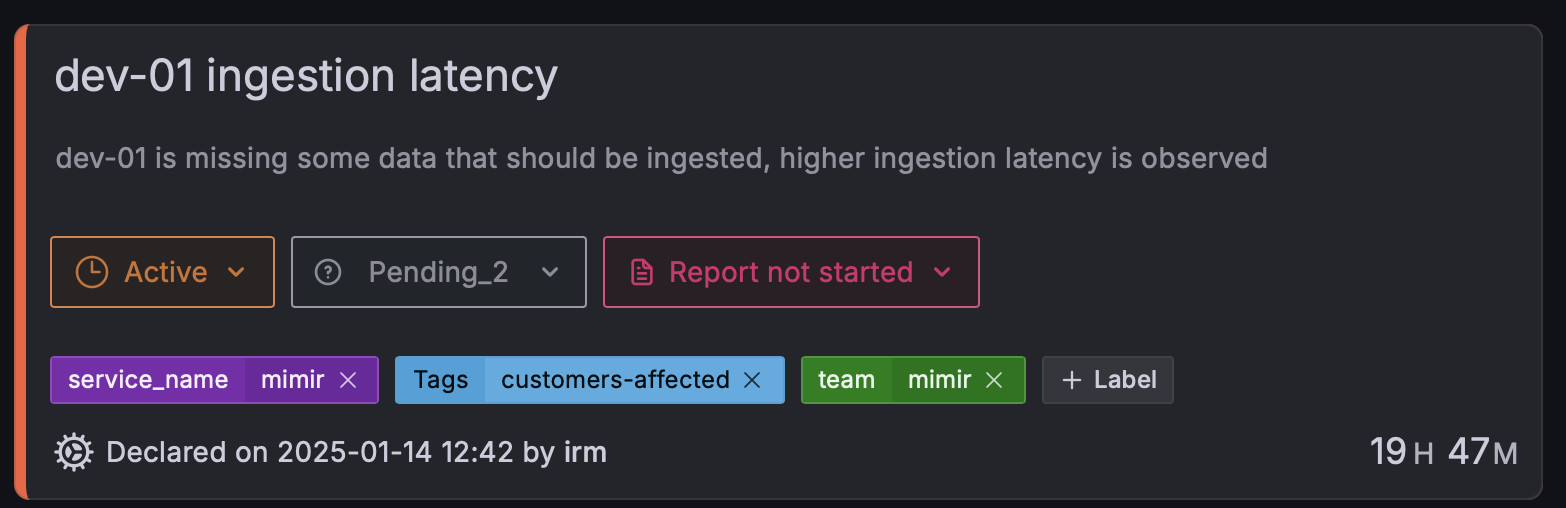
Our new labels feature replaces traditional tags with more flexible key-value pairs (for example, squad:incident or service_name:mimir). Beyond just describing an incident, labels are now shared across multiple Grafana products—like OnCall and SLO—tying them together for a more unified experience. We worked hard to make sure that your existing tags are migrated to labels and that existing public APIs continue to work.
Why does it matter?
- Easily annotate incidents with squad, service, or region, or define your own categories.
- With consistent labeling across Incident, OnCall, and SLO, you can query for incidents and alerts impacting the same services.
- By introducing a few restrictions on label naming, we ensure these labels can be passed into more systems without a hitch.
Example Use Cases
- Filter your Grafana SLO dashboards by incidents that share the same
service_namelabel to pinpoint recurring issues. - When an active incident is labeled with a specific squad, OnCall can loop in the right people
- Custom webhooks can use labels to begin automatic actions when an incident is declared and affects a certain cluster/namespace.
Was this page helpful?
Related resources from Grafana Labs
5 Mar

Getting started with managing your metrics, logs, and traces using Grafana
In this webinar, we’ll demo how to get started using the LGTM Stack: Loki for logs, Grafana for visualization, Tempo for traces, and Mimir for metrics.
26 Feb

Intro to Kubernetes monitoring in Grafana Cloud
In this webinar you’ll learn how Grafana offers developers and SREs a simple and quick-to-value solution for monitoring their Kubernetes infrastructure.
60 min

Building advanced Grafana dashboards
In this webinar, we’ll demo how to build and format Grafana dashboards.