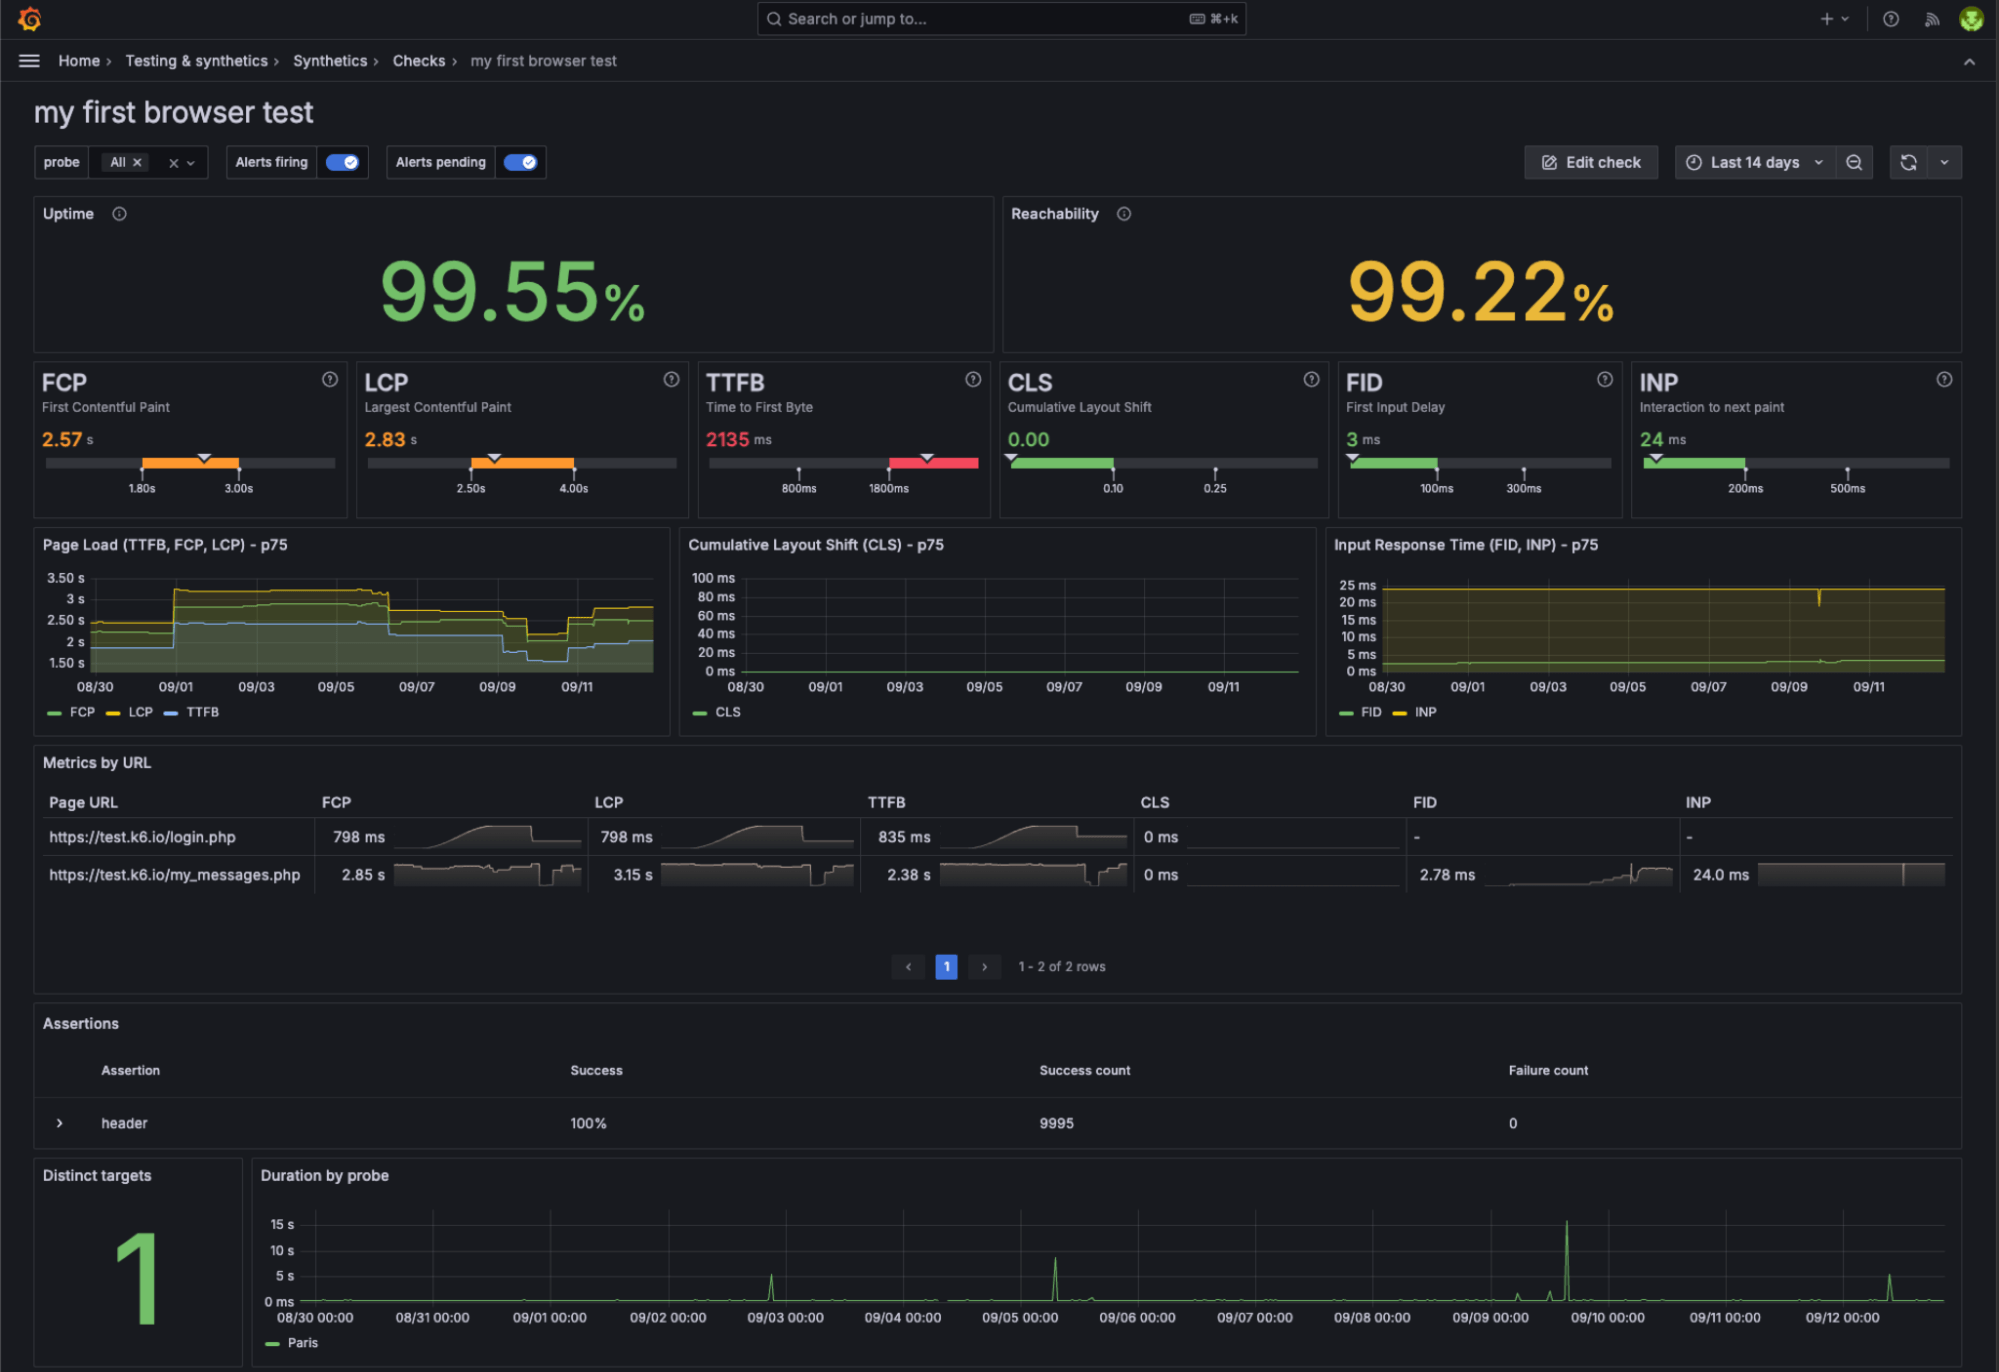
k6 browser checks in Synthetic Monitoring are now in private preview
We’re excited to announce that k6 browser checks in Synthetic Monitoring are now in private preview.
With k6 browser checks, you can control a headless Chrome browser using a k6 script. Powered by the k6 browser module, browser checks collect frontend Web Vitals metrics, capture custom performance metrics, and simulate user actions like clicking buttons or filling forms. Any scripts you create are also portable between Synthetic Monitoring and Grafana Cloud k6, as they are backed by the same engine, allowing you to reuse your monitoring scripts for performance testing and vice versa.

To learn more, refer to the Create a k6 browser check and k6 browser check docs.


