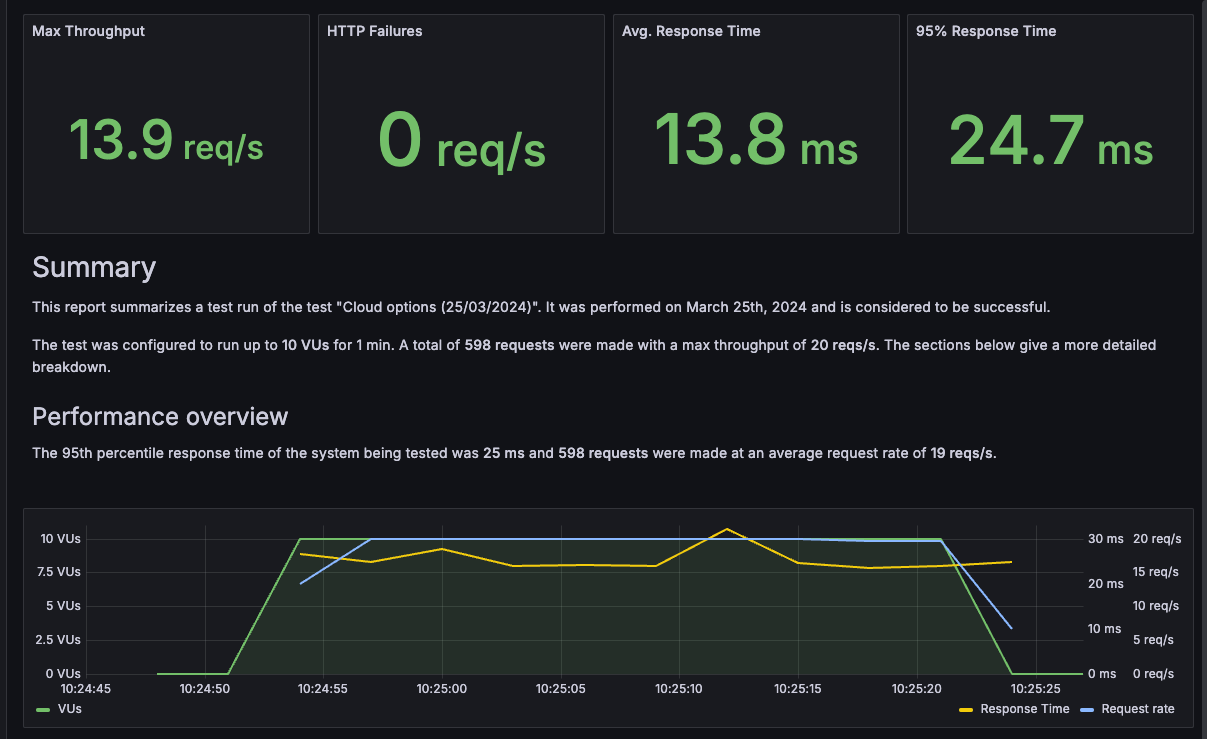
Export a Grafana Cloud k6 test result to a dashboard summary
After you run a performance test in Grafana Cloud k6, the next step is to analyze the results and share any findings with your team. Sometimes, you don’t need your team members to view all the resulting metrics, or you might want to generate a PDF in an accessible, easy-to-read format to share with external stakeholders.
The new export summary functionality in Grafana Cloud k6 allows you to export your test results as a Grafana dashboard. This dashboard includes panels and charts with key metrics from your test, such as max throughput, HTTP failures, average response time, and more. You can then share it with other team members, edit it, or export it as a PDF.
To learn more, refer to the Export test results documentation.


