What’s new in Grafana Cloud
Grafana Labs products, projects, and features can go through multiple release stages before becoming generally available. These stages in the release life cycle can present varying degrees of stability and support. For more information, refer to release life cycle for Grafana Labs.
No results found. Please adjust your filters or search criteria.
One-click data links in visualizations
You can now configure data links to be accessed with a single click. We’ve added the One click switch to data links for the following visualizations:
- Time series
- Bar chart
- Candlestick
- State timeline
- Status history
- Trend
- XY chart
You can only have one One click data link, so if you enable it for one, the feature is automatically disabled for others.
Grafana Cloud Integrations now available in Grafana Fleet Management
Grafana Fleet Management now includes the Grafana Cloud Integrations catalog, combining the preconfigured functionality of Integrations and the scalability of remote configuration.
Choose from a list of platform-specific integration templates to automatically build configuration pipelines in Fleet Management and then assign attributes to match those pipelines to specific collectors.
Grafana Fleet Management now supports Terraform
You can now provision your Grafana Fleet Management collectors and configuration pipelines using the Grafana Terraform provider (v3.19.0 or later).
Use Terraform to preregister new collectors for the Fleet Management service, add remote attributes to collectors that are already registered, and build configuration pipelines to remotely configure your fleet. With Terraform and Fleet Management, you can create a stable, consistent, scalable observability setup.
Canvas one-click data links and actions
Last year we introduced one-click data links and actions for canvas visualizations in public preview and experimentally respectively. With the One click switch toggled on, it takes just a single click to open a data link or trigger an action. Now, both of these features are generally available for the canvas visualization.
With the promotion to general availability, the One click switch has been moved into the dialog box where you configure the data link or action, at element level. You can only have one One click data link or action, so if you enable it for one, the feature is automatically disabled for others.
There’s supposed to be a video here, but for some reason there isn’t. Either we entered the id wrong (oops!), or Vimeo is down. If it’s the latter, we’d expect they’ll be back up and running soon. In the meantime, check out our blog!
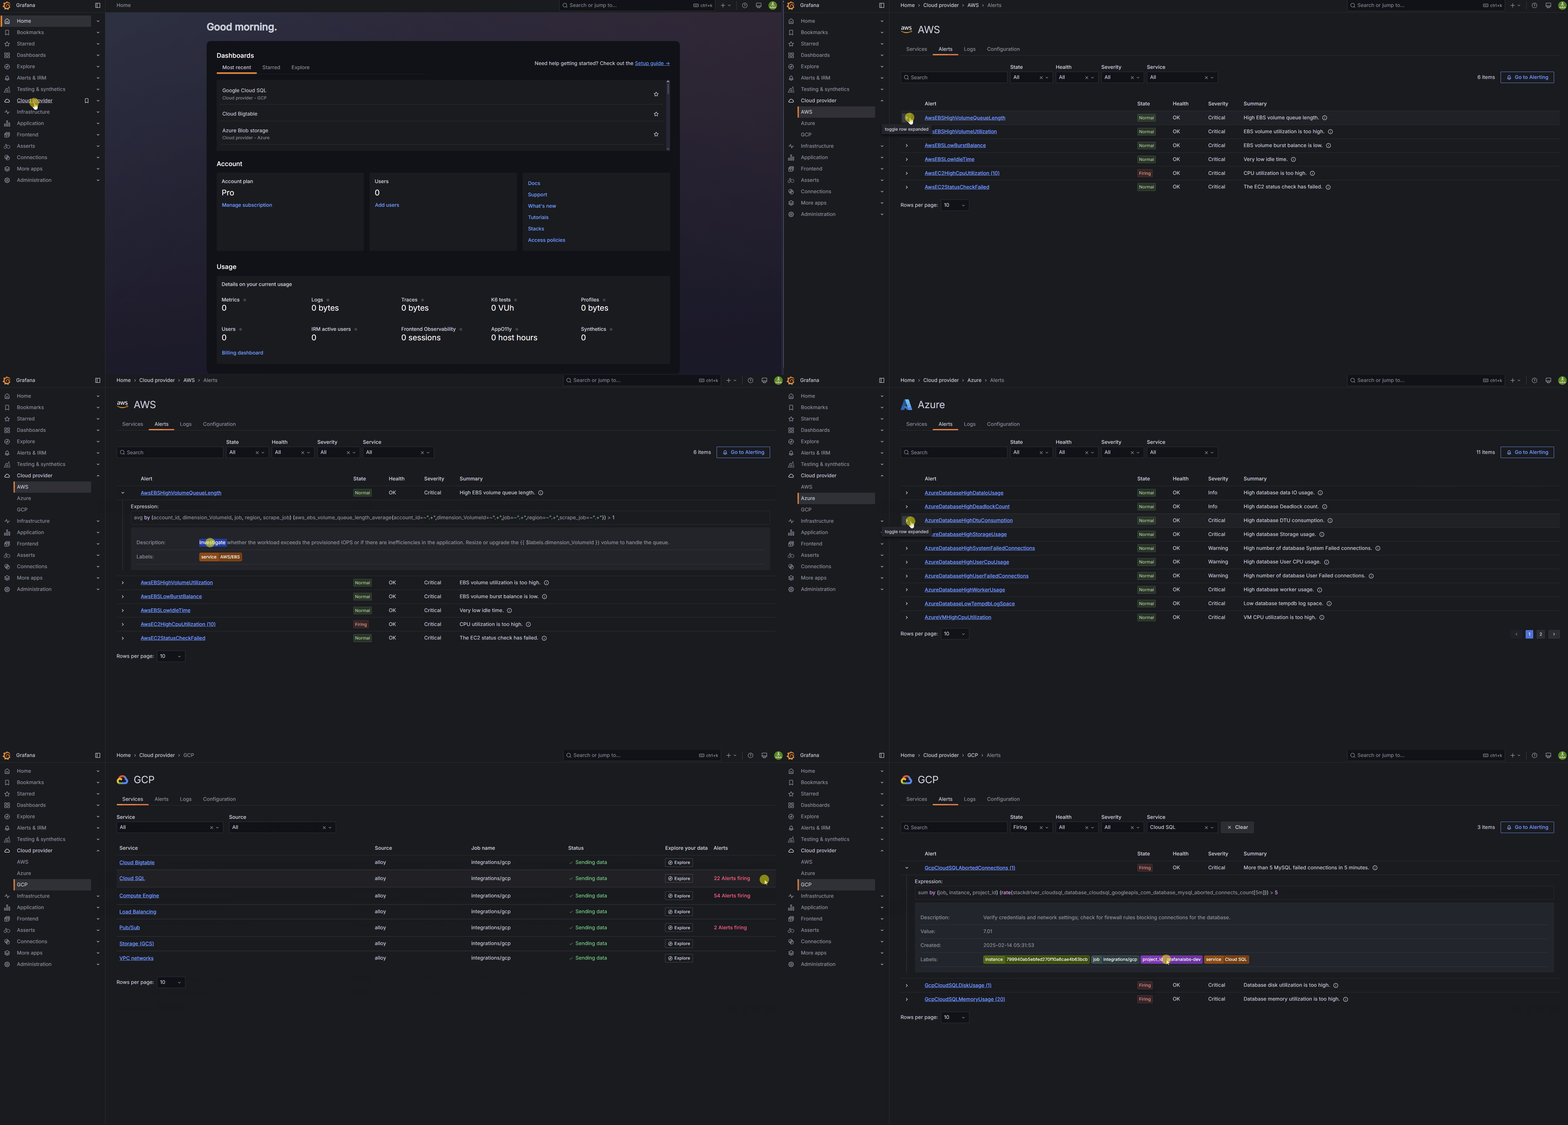
Prebuilt alerts in Cloud Provider Observability
Out-of-the-box, built-in alerts help you spend less time troubleshooting and more time focusing on what matters.
- Prevent slowdowns: Get alerts for high CPU usage in AWS EC2, Azure VMs, and GCP Compute Engine.
- Keep databases running smoothly: Avoid failures with alerts for deadlocks, failed connections, and disk space limits.
- Optimize storage and messaging: Stay ahead of storage constraints and ensure messages are delivered on time.

Whether you’re running on AWS, Azure, or GCP, you can fix issues faster because of real-time notifications, including:
- High CPU usage
- Storage limits
- Failed connections
Generative AI Observability, now with GPU monitoring
We’re excited to unveil our latest update to the Generative AI Observability Cloud integration.
AI Observability is a Grafana Cloud integration we released late last year, designed to provide insights into gen AI application performance.
By leveraging OpenLIT, the OpenTelemetry-native, open-source SDK, it simplifies the monitoring, diagnosis, and optimization of generative AI systems. This integration automatically instruments over 50 gen AI tools, including LLMs, vector databases (vector DBs), and frameworks like LangChain and LlamaIndex, streamlining your setup process.
Our integration not only guides you through the setup but also offers pre-built dashboards that can be customized to fit your needs. These dashboards, focused on LLM & VectorDB Observability, now include an exciting new feature: OpenTelemetry-based GPU monitoring! This new capability enables you to track GPU performance through key metrics such as utilization percentage, temperature, power consumption, and more, allowing you to optimize the efficiency of your AI workloads.
Track persistent storage in Kubernetes Monitoring
View how persistent volume (PV) changes over a specific time range in the storage tab on the Cluster, Namespace, Workload, Node, and Pod detail pages.
The insights you gain into storage include PVC storage classes, inodes, the status of binding, and comparison of PVC requests, data capacity, and usage.
Grafana Service Center
Grafana Service Center is now in public preview. The Service Center provides users a single pane of glass into key operational resources, including SLOs, Incidents, and Dashboards with more resources coming soon.
Define the labels and tags that represent your services and the Service Center will generate a service resource and a service landing page. Additionally, informative attributes can be added to the service definition such as: Documentation links, Repository links, Backlog, and any other custom attribute you would like to add.
SIFT integration for Grafana SLO
All Grafana SLO dashboards are now natively integrated with a Grafana SIFT panel. SIFT automatically checks burning SLOs for common issues and reports back using the SIFT panel in all auto-generated SLO dashboards. You can also manually run SIFT checks from the Grafana SLO dashboard.
Introducing RBAC for Synthetic Monitoring (Private Preview)
We’re excited to announce that Role-Based Access Control (RBAC) for Synthetic Monitoring is now available in private preview! This gives you the ability to fine-tune access and permissions within Synthetic Monitoring, offering greater control over who can access specific features.
With RBAC, you can assign different roles and permissions to users and teams, ensuring the right people have the right access. This makes managing your monitoring workflows more secure and flexible.
How it Works
Integrate Grafana Cloud k6 and Grafana Pyroscope
One of the basic goals of performance testing is to ensure your applications perform well under various levels of traffic. However, most performance tests are conducted with minimal insight into why a system performs a certain way during testing.
This is where continuous profiling comes in. Profiling provides unparalleled visibility into how your code behaves under load, pinpointing CPU bottlenecks, memory leaks, and inefficient function calls.
Datadog Flex Logs
We’re excited to roll out Flex Logs, a powerful new feature for storing logs long-term while ensuring they’re available for urgent queries when needed. Ideal for critical logs like security, transaction, and network data, Flex Logs combine retention with quick access during important events.
To enable Flex Logs in your queries, just select the “flex” storage tier—simple as that!

Filter recommendations by usage for Adaptive Logs
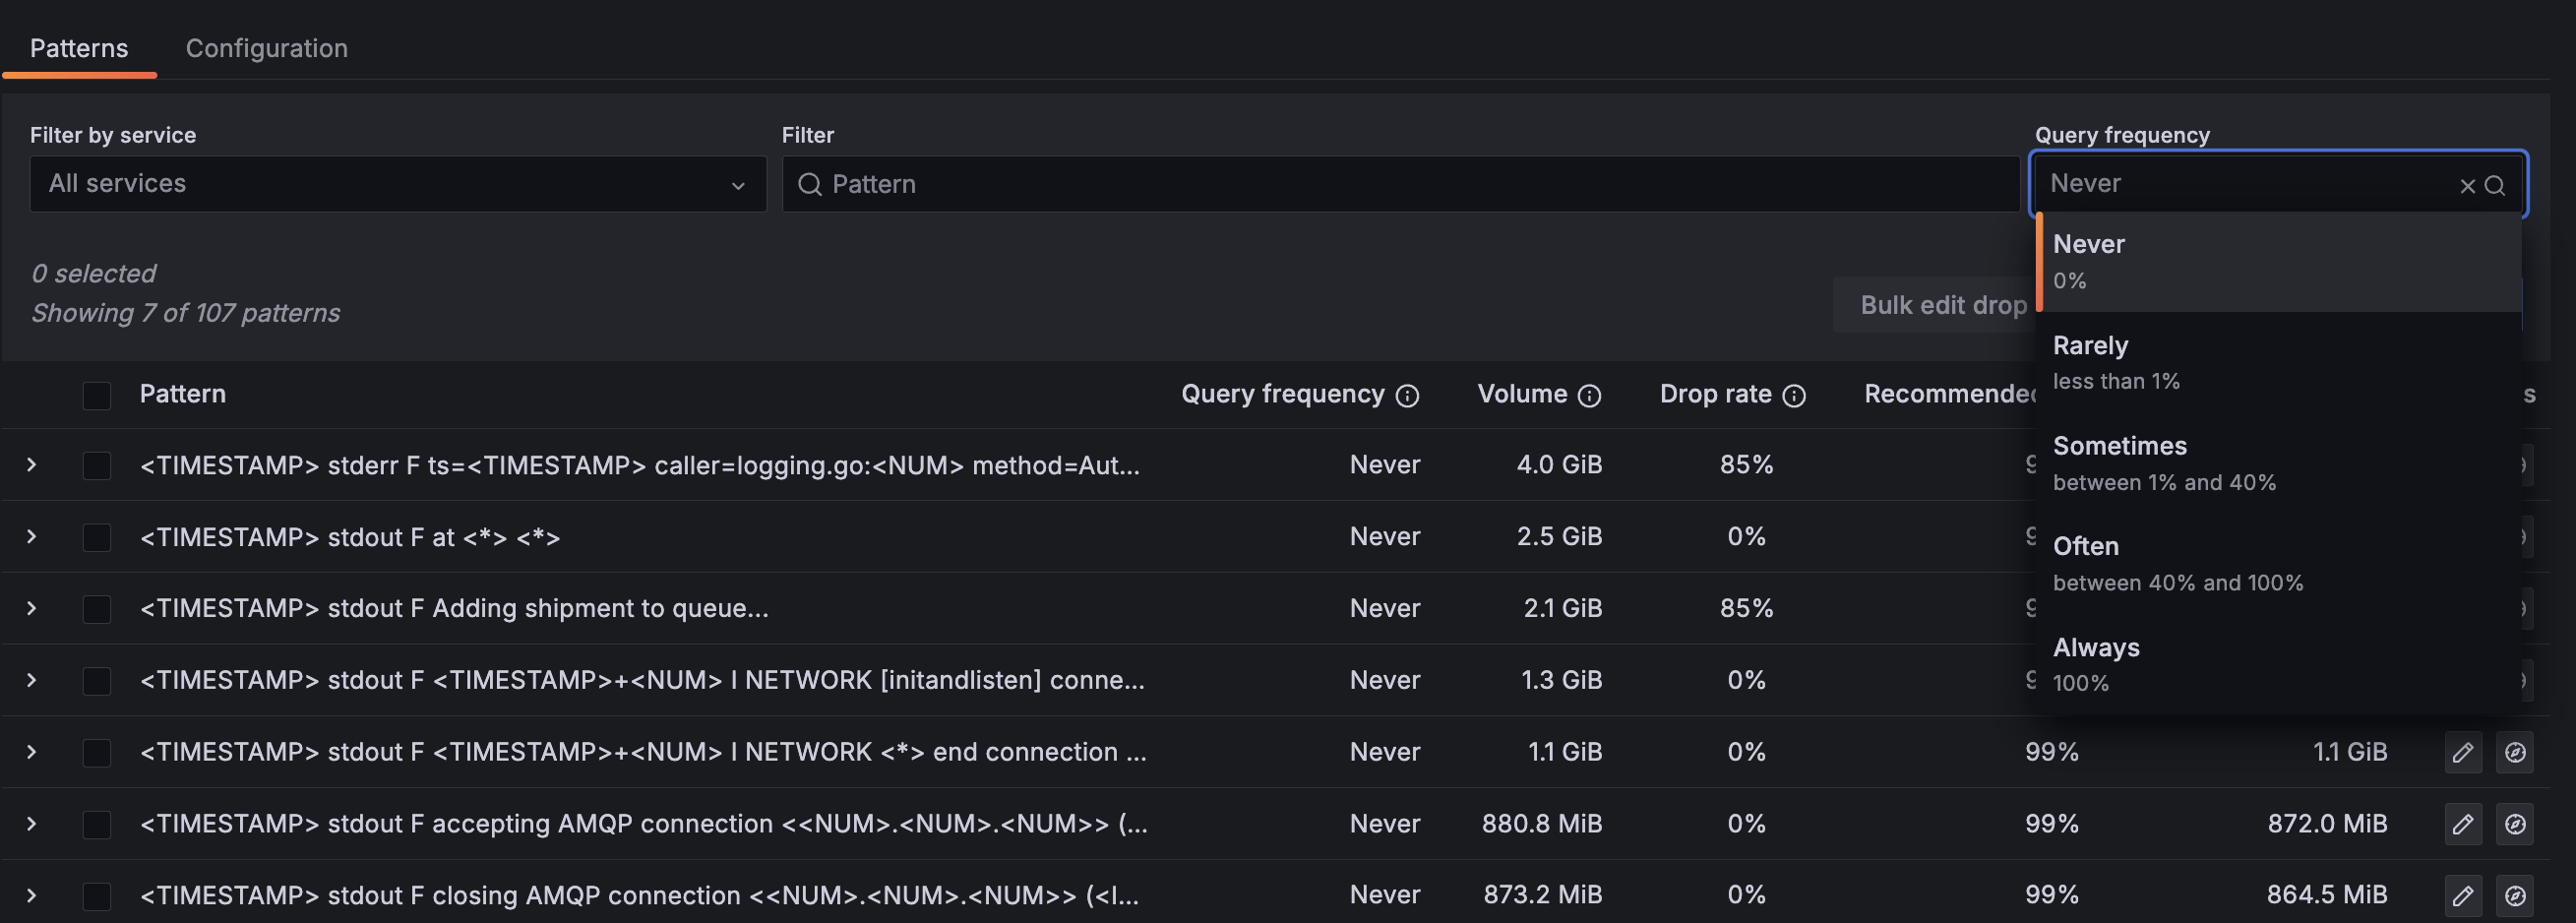
Want to easily stop ingesting your low usage log lines? Adaptive Logs now makes this even easier, allowing you to filter recommendations by how often they are queried. Now, even fewer clicks to apply recommendations for logs which are never queried or rarely queried. This UI enhancement makes it easy to quickly get started with, and get value from, Adaptive Logs.

Exemptions for Adaptive Logs
Adaptive Logs introduces support for exempting specified logs from drop recommendations to Grafana, giving you greater control of your data.
You can tell Adaptive Logs to not drop log lines from certain streams using the Stream selector. This ensures specified logs are ingested into Grafana Cloud, and not dropped by Adaptive Logs, no matter what our usage recommendations initially suggest. Our recommendation engine also updates to include the exemptions you specify.
RBAC for notification policies
Manage notification policies through Role-Based Access Control (RBAC). Choose who can create, edit, and read notification policies using fixed roles.
You can only grant different access levels to the entire notification policy tree; not to individual notification policies.


