Labels and Fields
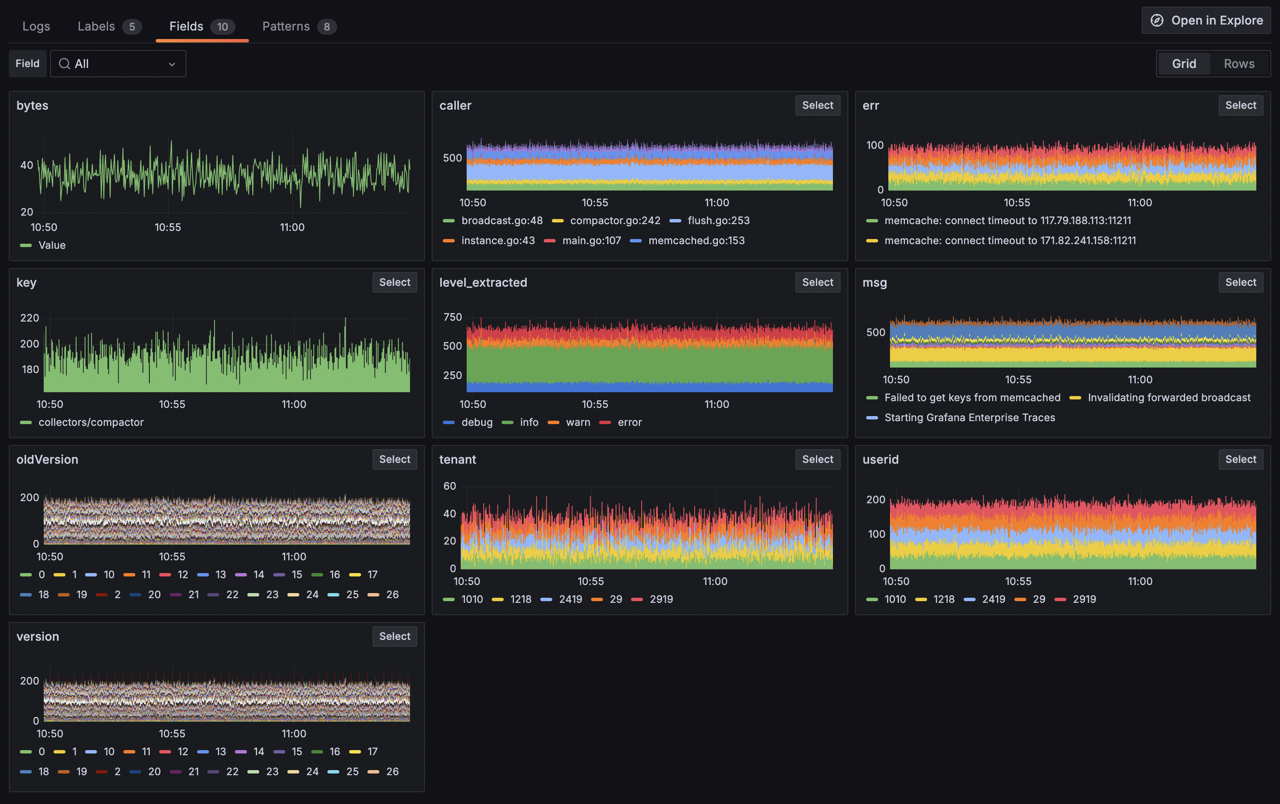
Grafana Logs Drilldown visualises log volumes for the labels attached to your log lines, and fields automatically extracted from the text of the line itself.

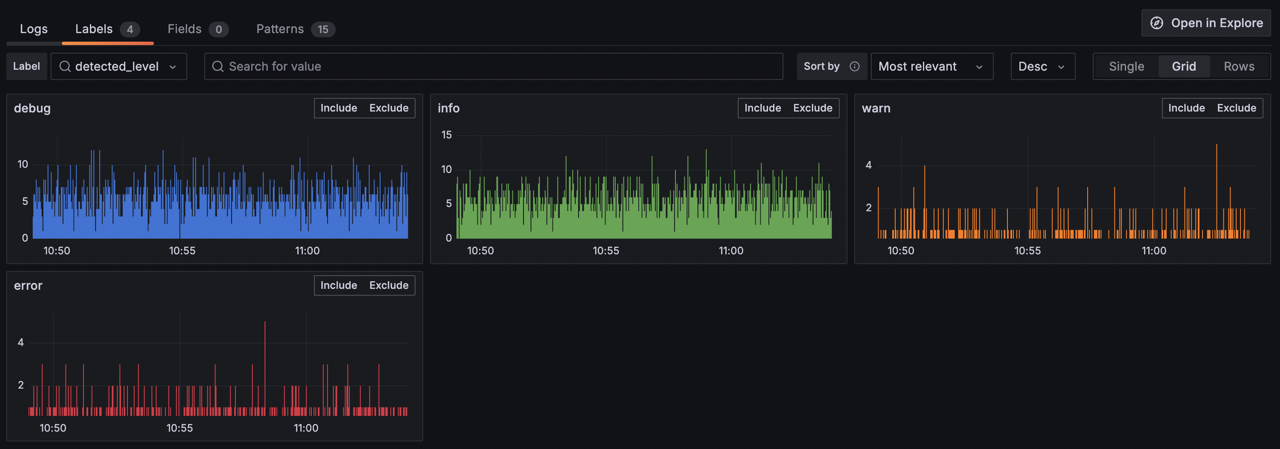
Grafana Logs Drilldown adds a special detected_level label to all log lines where Loki assigns a level of the log line, including debug, info, warn, error, fatal, critical, trace, or unknown if no level could be determined.
You can click Select on a Label or Field to access a breakdown of its values, seeing the log volumes visualized along the way. This can be useful for understanding the traits of your system, and for spotting spikes or other changes.
Note
The type of data being expressed in a label or field may require different treatments. For example, fields expressing
bytesare visualized differently than other types of data. Please share your feedback if you have suggestions for how to improve this experience.
Guided tour of labels and fields
To explore labels with your own data, follow these steps:
- From the Grafana main menu, select Explore > Logs.
- Click the Select button for the Service you want to explore. (No services?)
- Click the Labels tab.
- Browse the labels detected for this service. (No labels?)
- Look for an interesting label and click the Select button.
You will see a selection of visualizations showing the volume of each label.
These visualizations are great for:
- Spotting unexpected spikes in log volume.
- Noticing dips or outages in your services.
- Understanding the distribution of log lines across your labels.
- Identifying labels that might be useful for filtering or grouping your logs.
You also have a range of sorting and ordering options to help you focus on the most important areas.
You can repeat the same steps in the Fields tab to see fields that were extracted from your log lines.

What next?
Learn about how Log patterns can help you deal with different types of log lines in bulk.


