Inspect test results
When running a cloud test, Grafana Cloud stores the test metrics generated by the k6 instances running the test. Grafana Cloud k6 provides views that visualize, analyze, and present trends for the test results.
This topic describes the primary sections of the Test Result view, also known as Test Run view.
Navigate to the Test Result view
There are two ways to navigate to the Test Result view. From the project view:
- Select the test that want to view its test run results.
- On the Test view, select the test run from the Test Runs table.

Performance overview
The Performance Overview section displays high-level data for your test. While the test runs, it displays live metrics.

Indicators of good and bad results
The first sign of a good or bad result is usually in the Performance Overview panel.
Typical signs of a good result:
- Response time has a flat trend for the duration of the test.
- Request rates follow the same ramping pattern as Virtual Users (if VUs increase, so does the request rate).
Typical signs of a performance issue or bottleneck:
- Response times increase during the test.
- Response times increase, then quickly bottom out and stay flat.
- Request rates don’t increase with VUs (and response times start to increase).
This is a non-exhaustive list. You should use these patterns as a first indicator of good or bad performance of your test.
Cloud Insights
Below the Performance Overview panel, the Cloud Insights section lists any issues that the cloud service algorithms detect. Refer to Get Cloud Insights for more details.
Inspect browser results
When you run a browser test, you can find new browser metrics and sections in the Test Result view:
- Browser Timeline: A timeline view that shows details for each page in your browser test run, including load time, Web Vitals metrics, and screenshots.
- Browser Metrics: A table view that shows the Web Vital metrics for each page accessed during the test run.
- Browser Screenshots: A table view that shows all the screenshots taken during the test run.
Refer to Inspect browser test results for details about these sections and the Web Vital metrics collected in browser tests.
Request and test data
The last section of the Test Result view displays several tabs with information about the request data, such as HTTP, gRPC, or WebSocket requests, and other test data from your script, such as Checks, Thresholds, and Logs.
For more details, refer to:
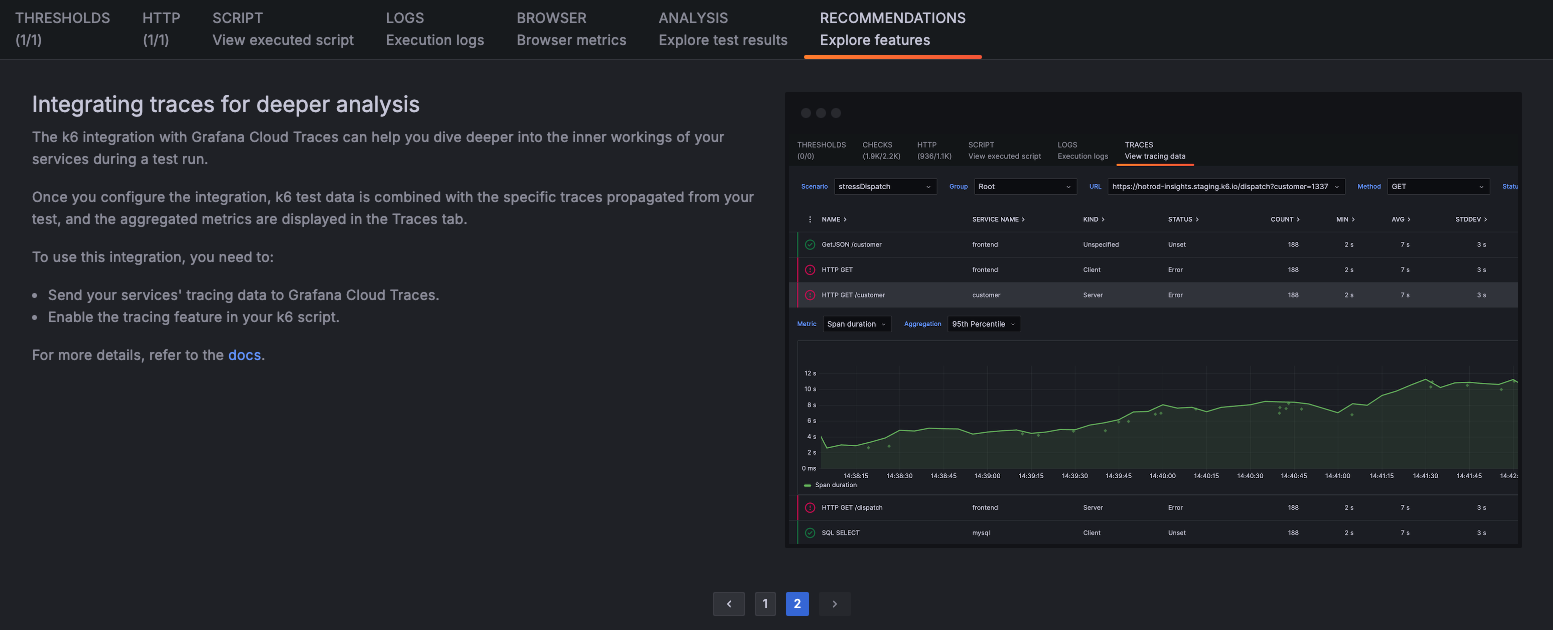
Recommendations
The Recommendations tab is an intelligent tool that analyzes telemetry data, such as metrics, logs, and traces, to provide tailored best practices to help you get the most out of Grafana Cloud k6. For example, it might suggest:
- Using Grafana Cloud products like Synthetic Monitoring
- Exploring Grafana Cloud k6 features such as Private Load Zones
- Correlating Results with Grafana Cloud Traces
You can find the Recommendations tab on the Test run results page.


