Google Cloud Platform
Google Cloud Platform (GCP) enables you to monitor GCP metrics and view GCP logs.
GCP Metrics
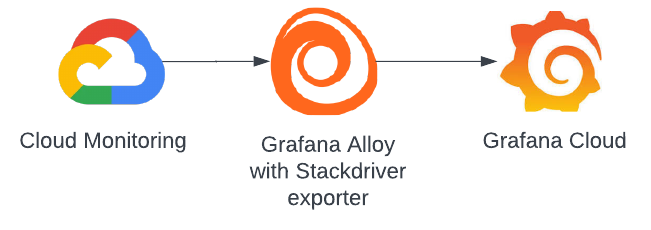
Grafana Alloy sends metrics from Cloud Monitoring to Grafana Cloud. Alloy uses its embedded stackdriver-exporter to export metrics from Cloud Monitoring and then send them to Grafana Cloud.
To get GCP Metrics running, refer to Configure GCP Metrics.
Preconfigured dashboards
You can use the filters on any dashboard to refine your data. Filters are appropriate for each dashboard, and may include:
- Data source
- Job
- Project ID
- Instance
- Database ID
- Bucket name
- Country
- Backend target
- Subscription ID

Additionally, use the time range selector to change time period of your data.
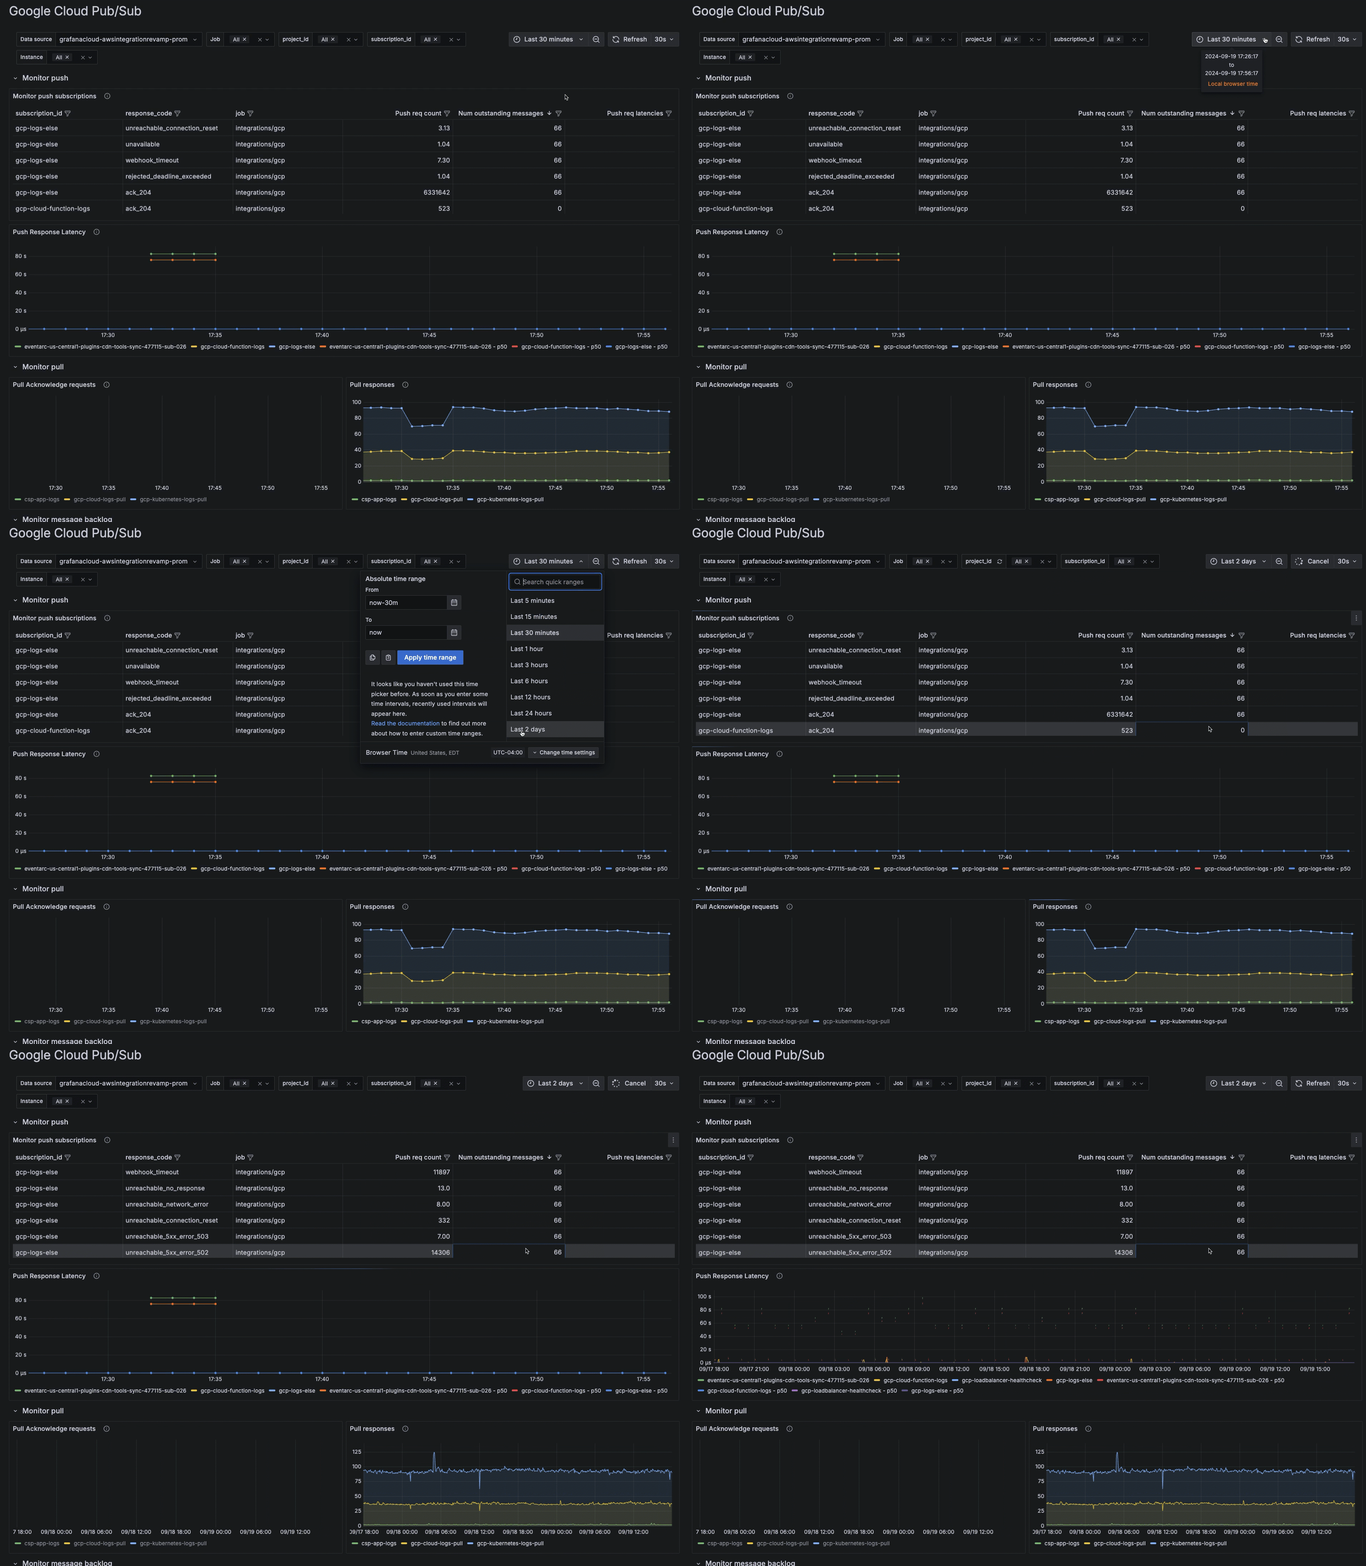
Go to a GCP dashboard
- To see any metrics dashboard, configure GCP metrics.
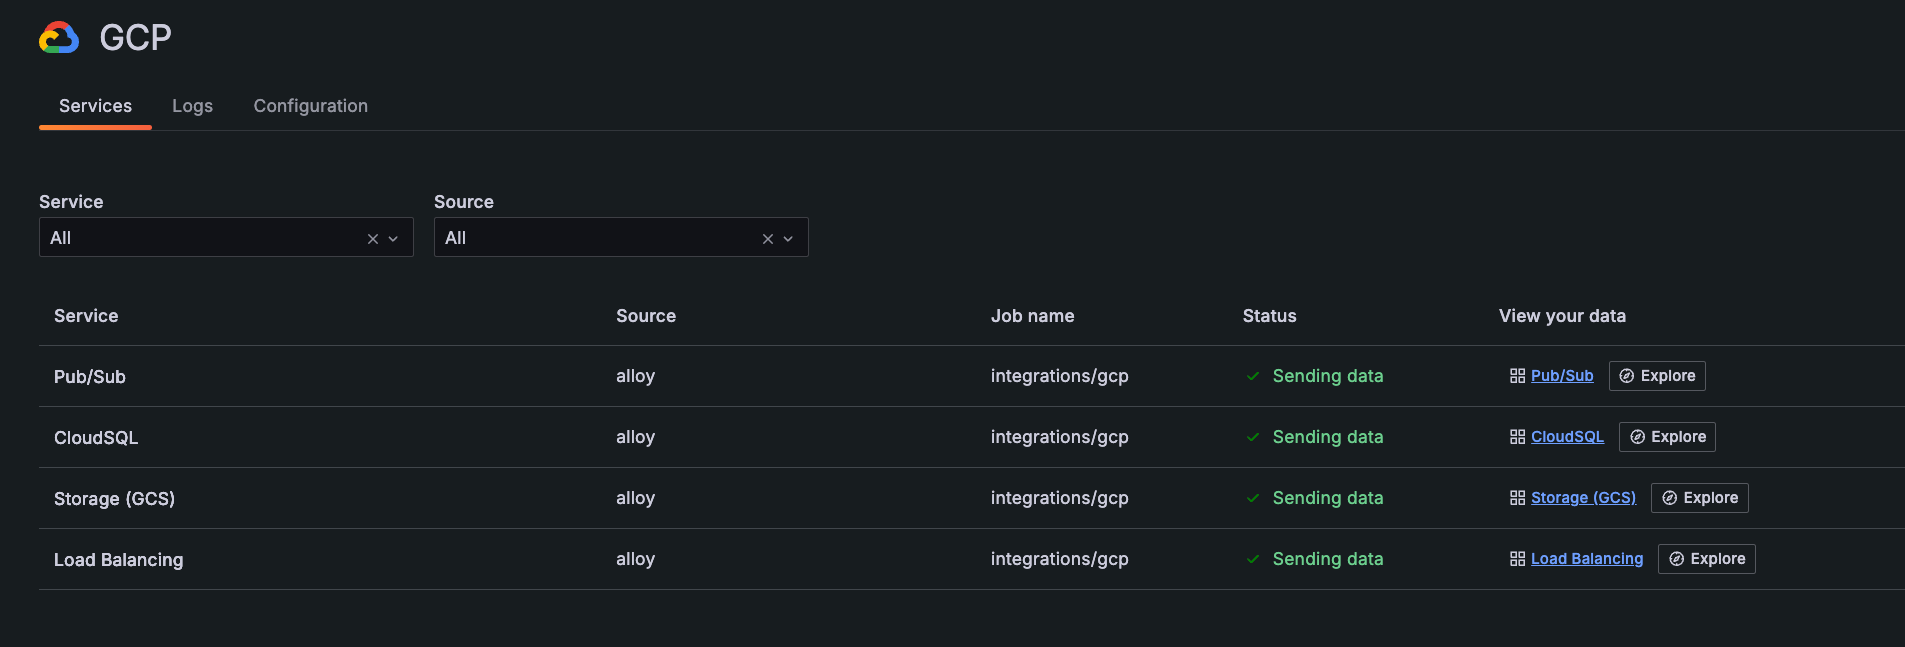
- In the main menu, click GCP to open the Services tab.
![List of available services on **Services** tab List of available services on **Services** tab]()
List of available services on Services tab - Locate the specific service in the list, and click the dashboard in the View your data column of the table.
The following dashboards are available out of the box.
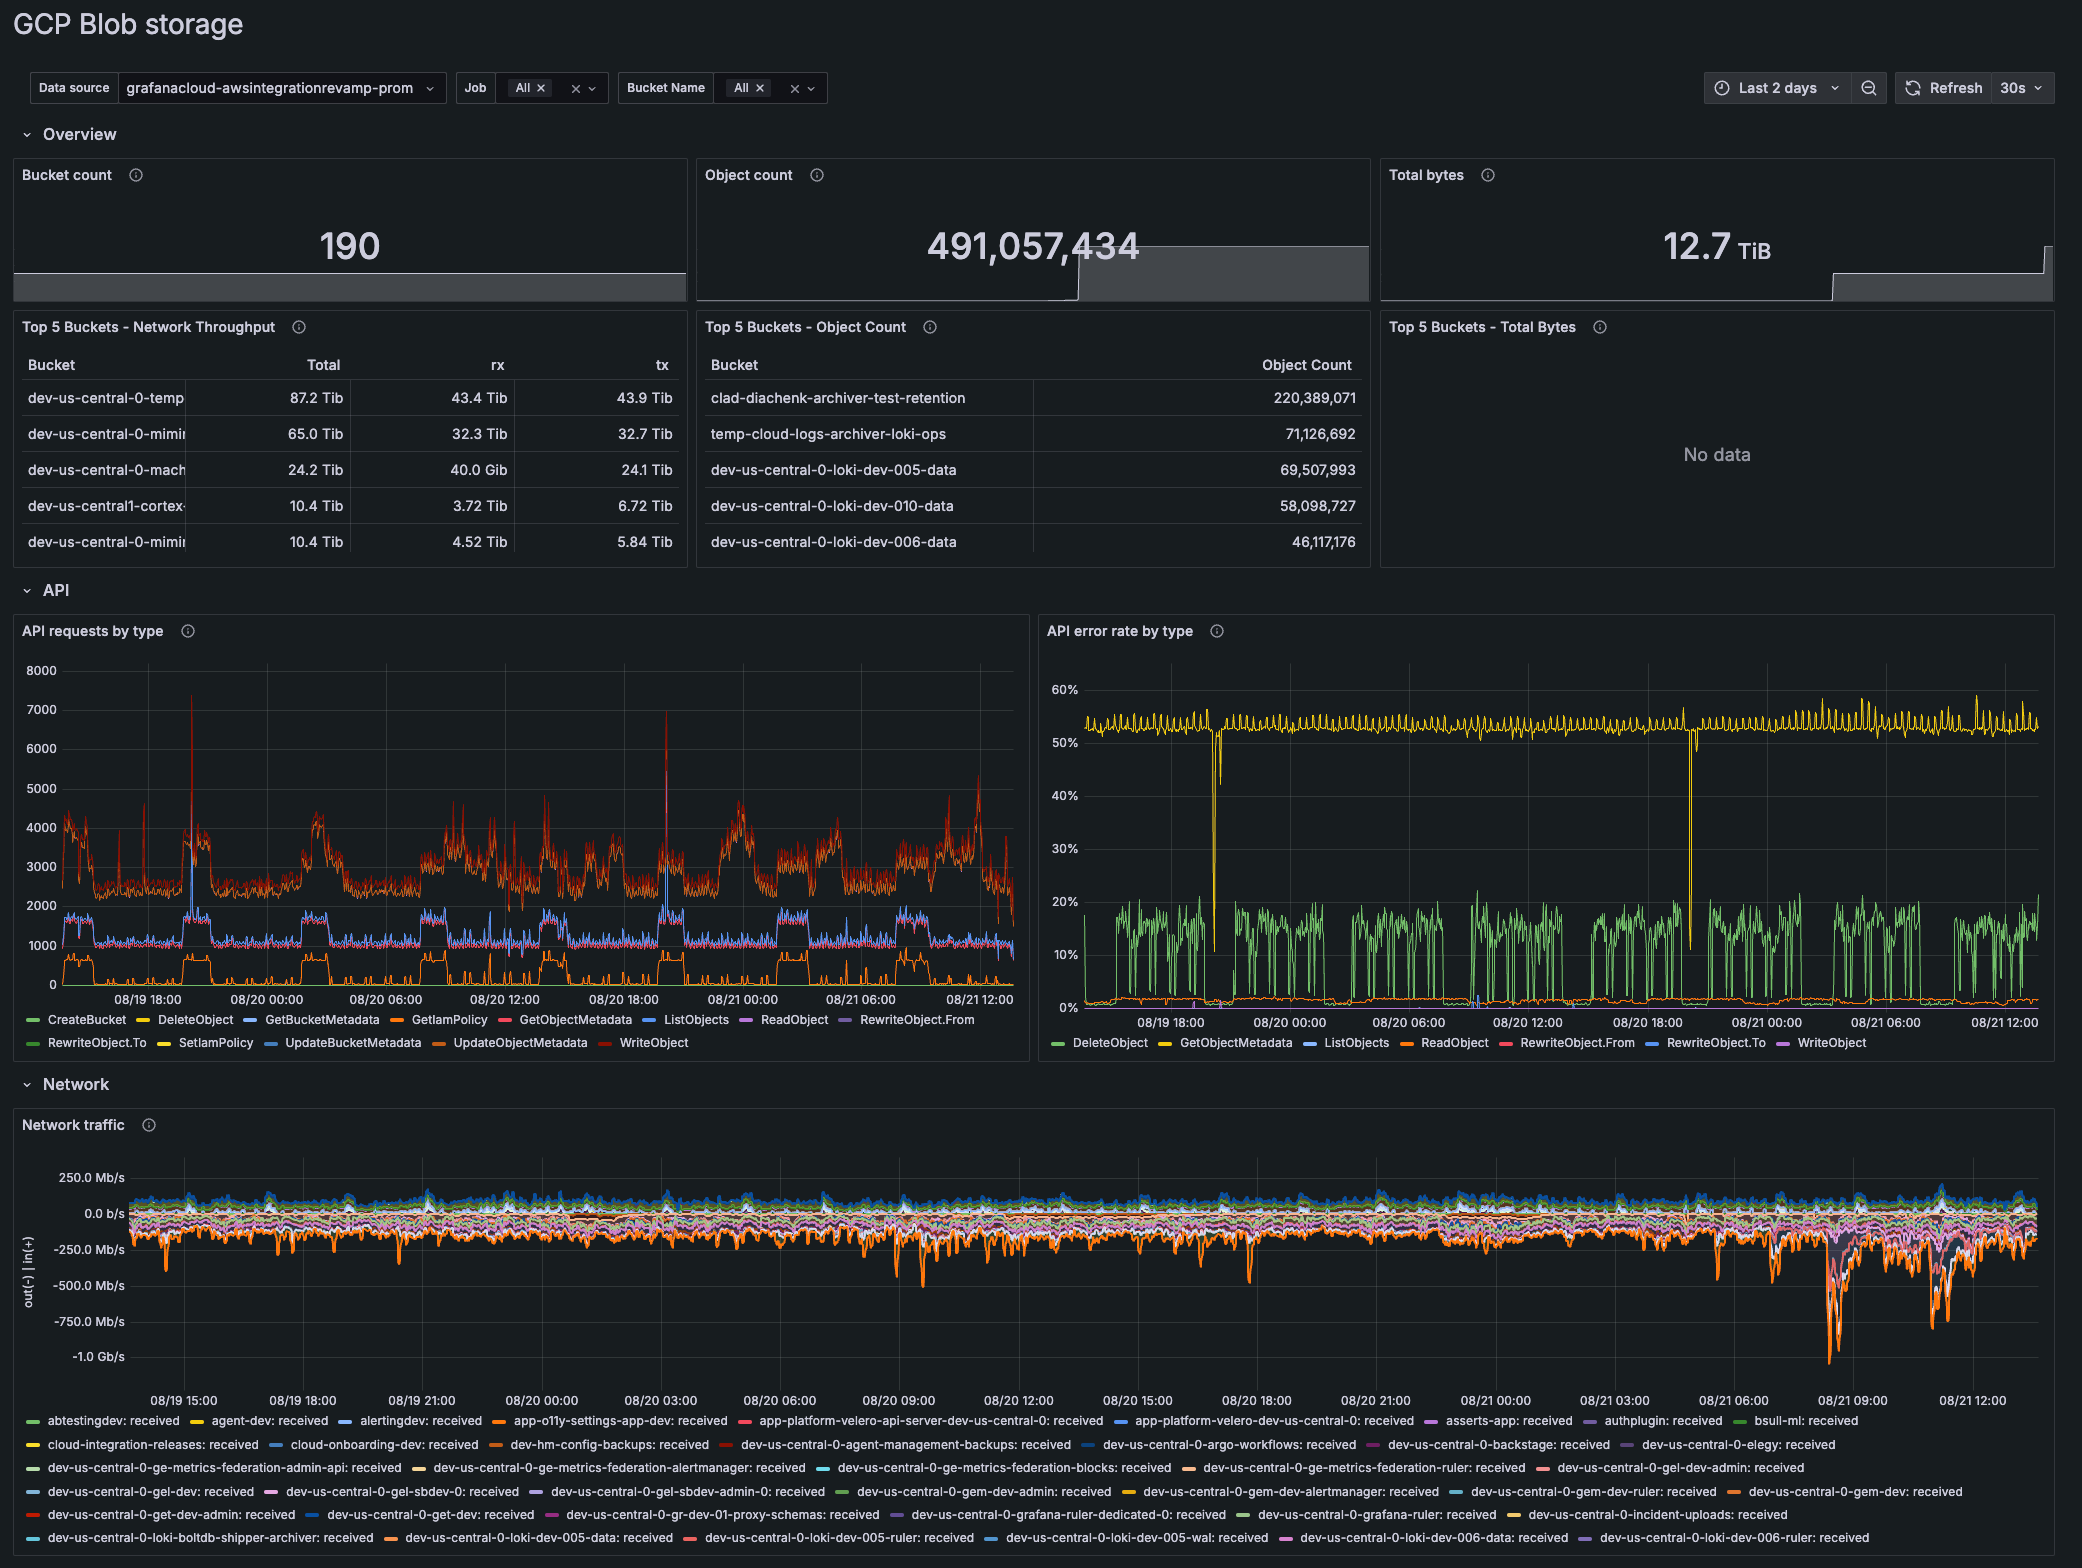
GCP Blob Storage
The GCP Blob Storage dashboard shows the following metrics:
- Number of storage buckets
- Number of objects stored
- Top five buckets with total bytes stored
- API requests by type
- API error rate by type
- Network traffic sent/recieved
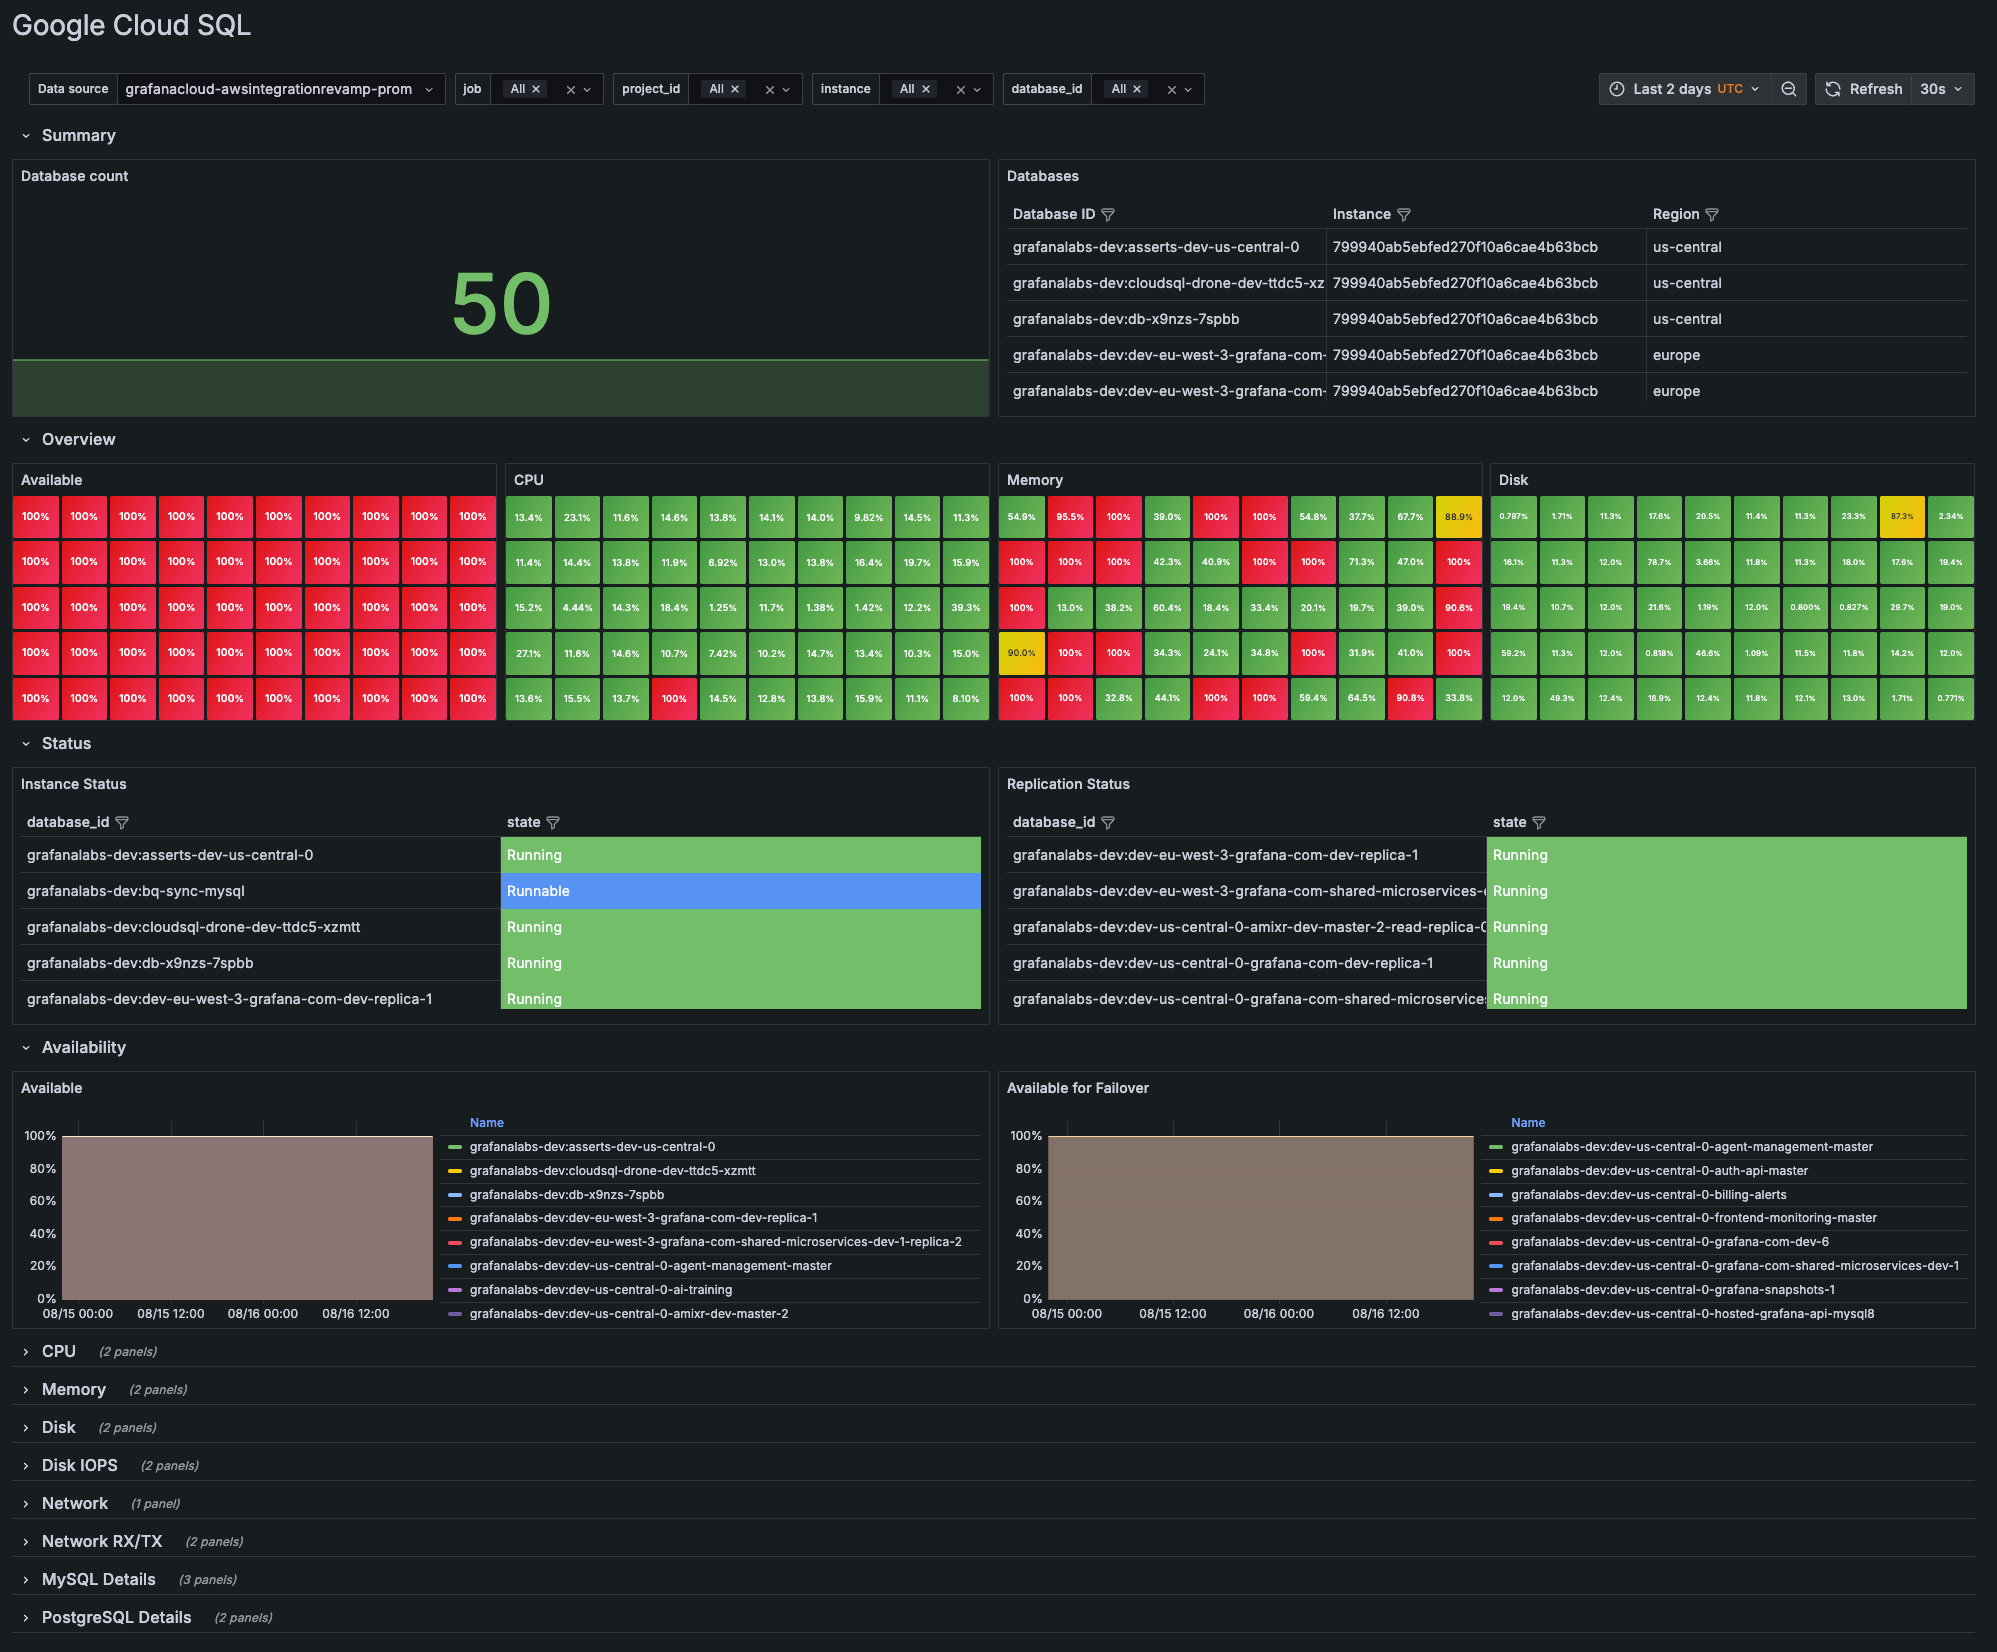
GCP Cloud SQL
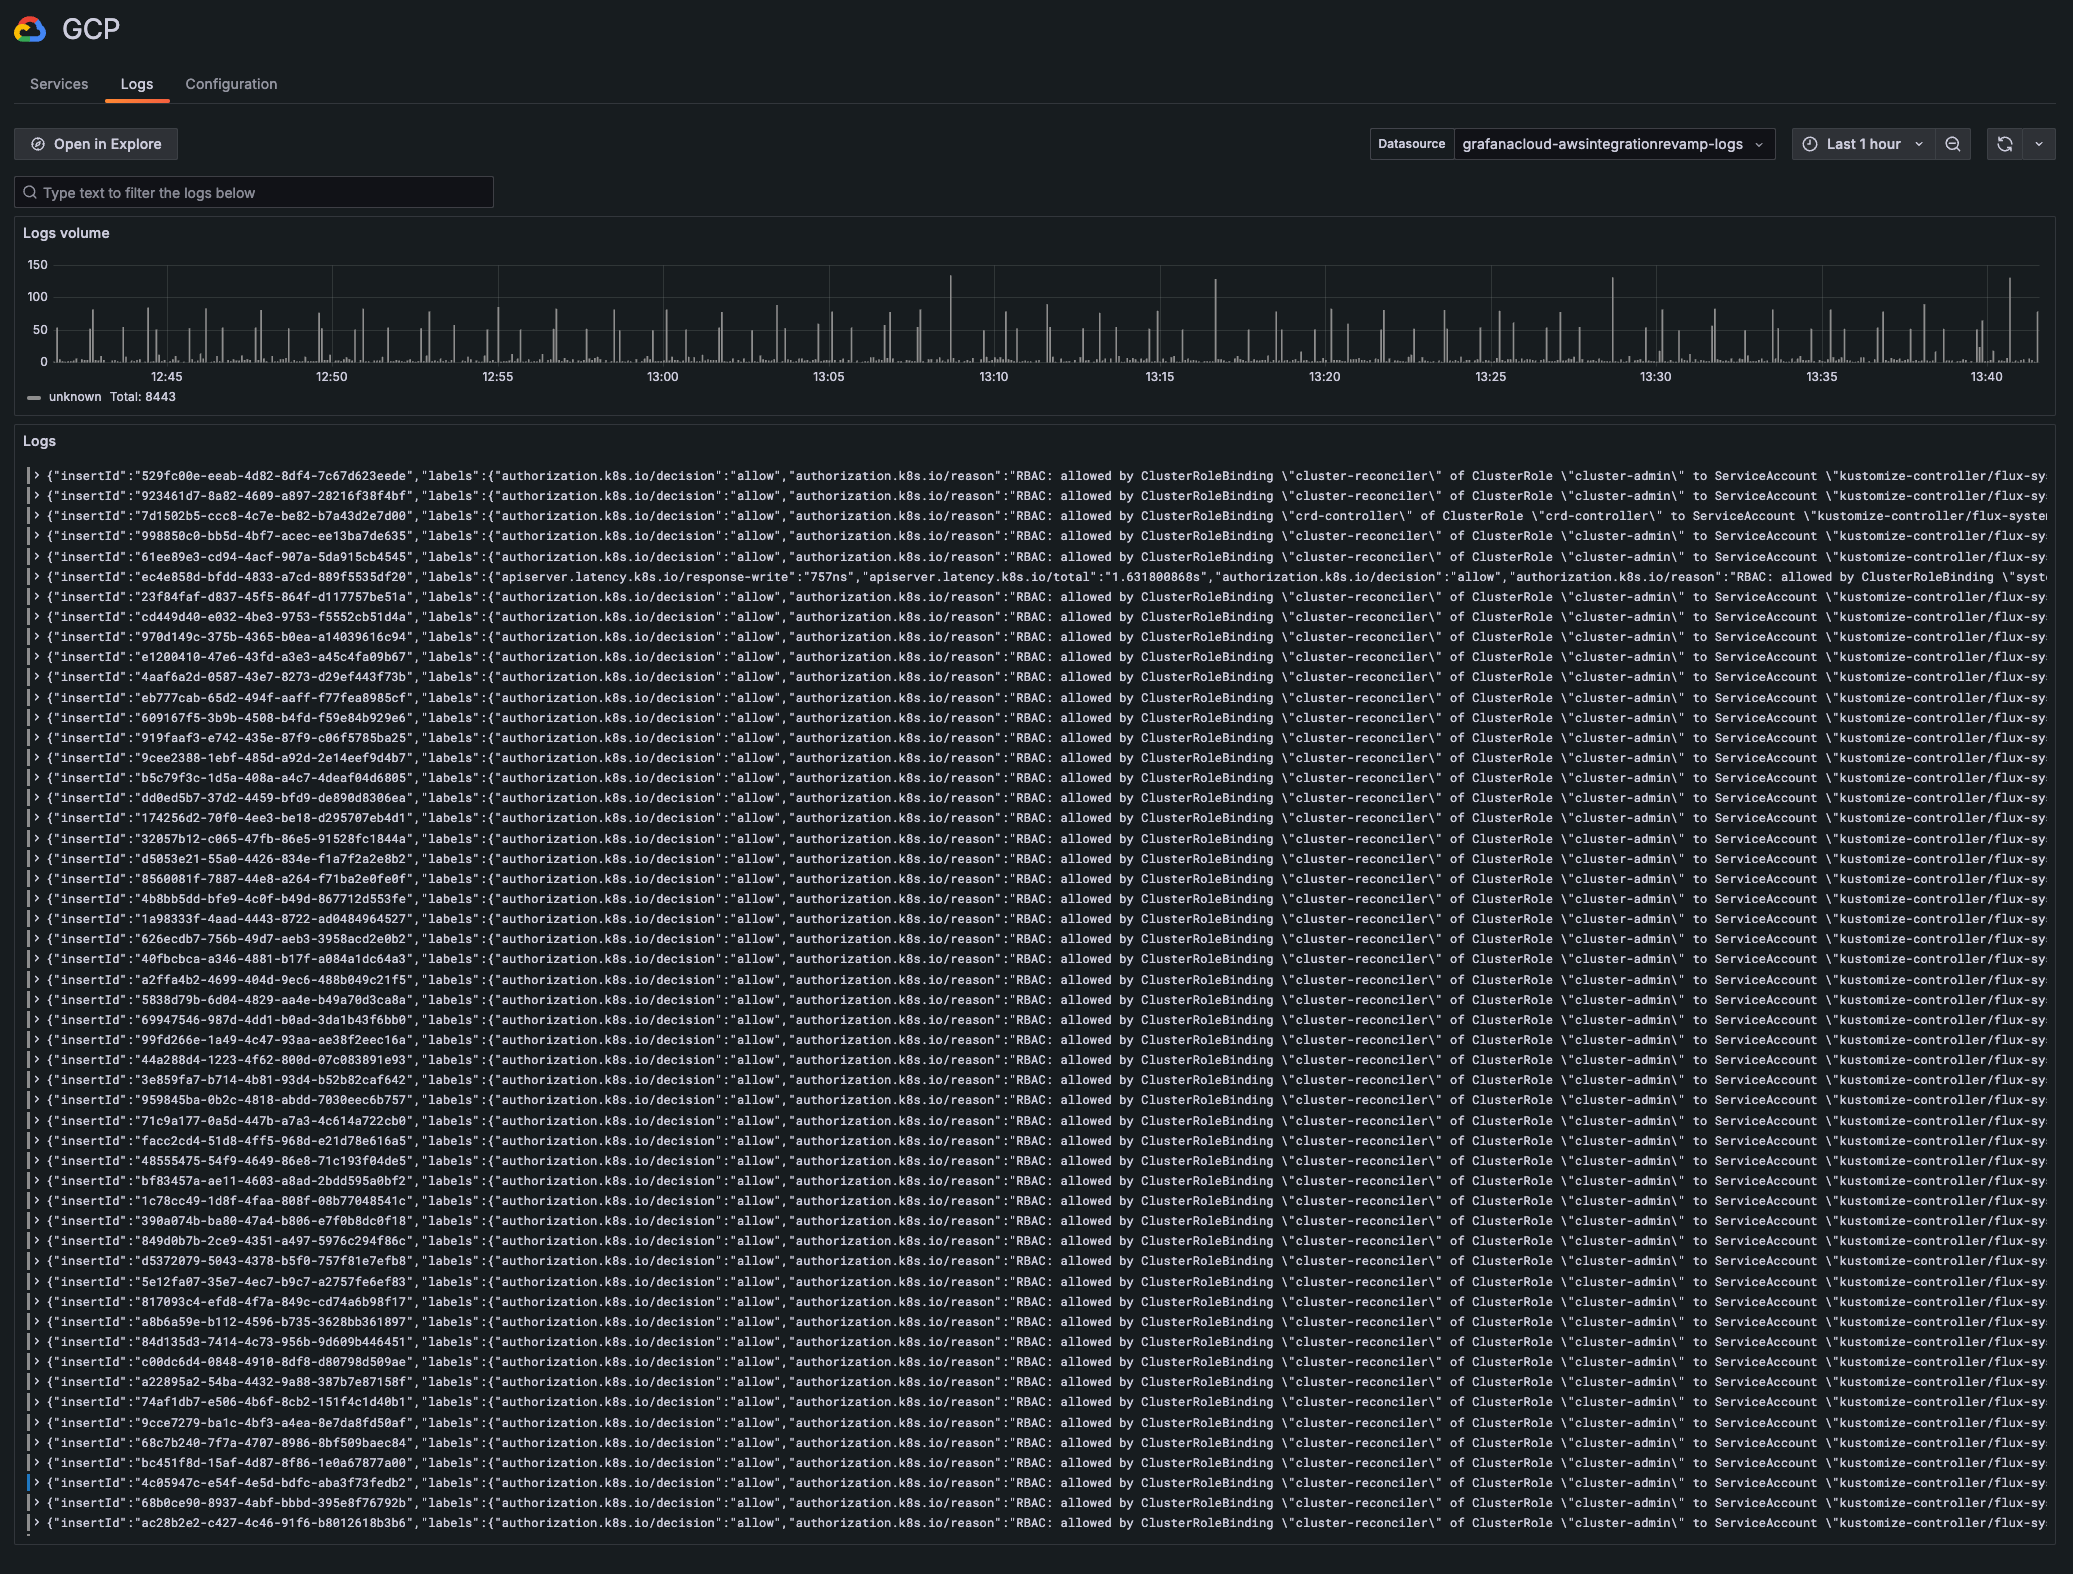
GCP Logs
Grafana Alloy sends logs from Cloud Monitoring to Grafana Cloud. Logs are sent from Cloud Monitoring through a log sink to a Pub/Sub topic. The GCP SDK is used for pulling and receiving messages from Pub/Sub. The service account enables Alloy to read the logs from the Pub/Sub subscription. Alloy then sends the logs to Grafana Cloud.

To get GCP Logs running, refer to Configure GCP Logs.
GCP Logs view
