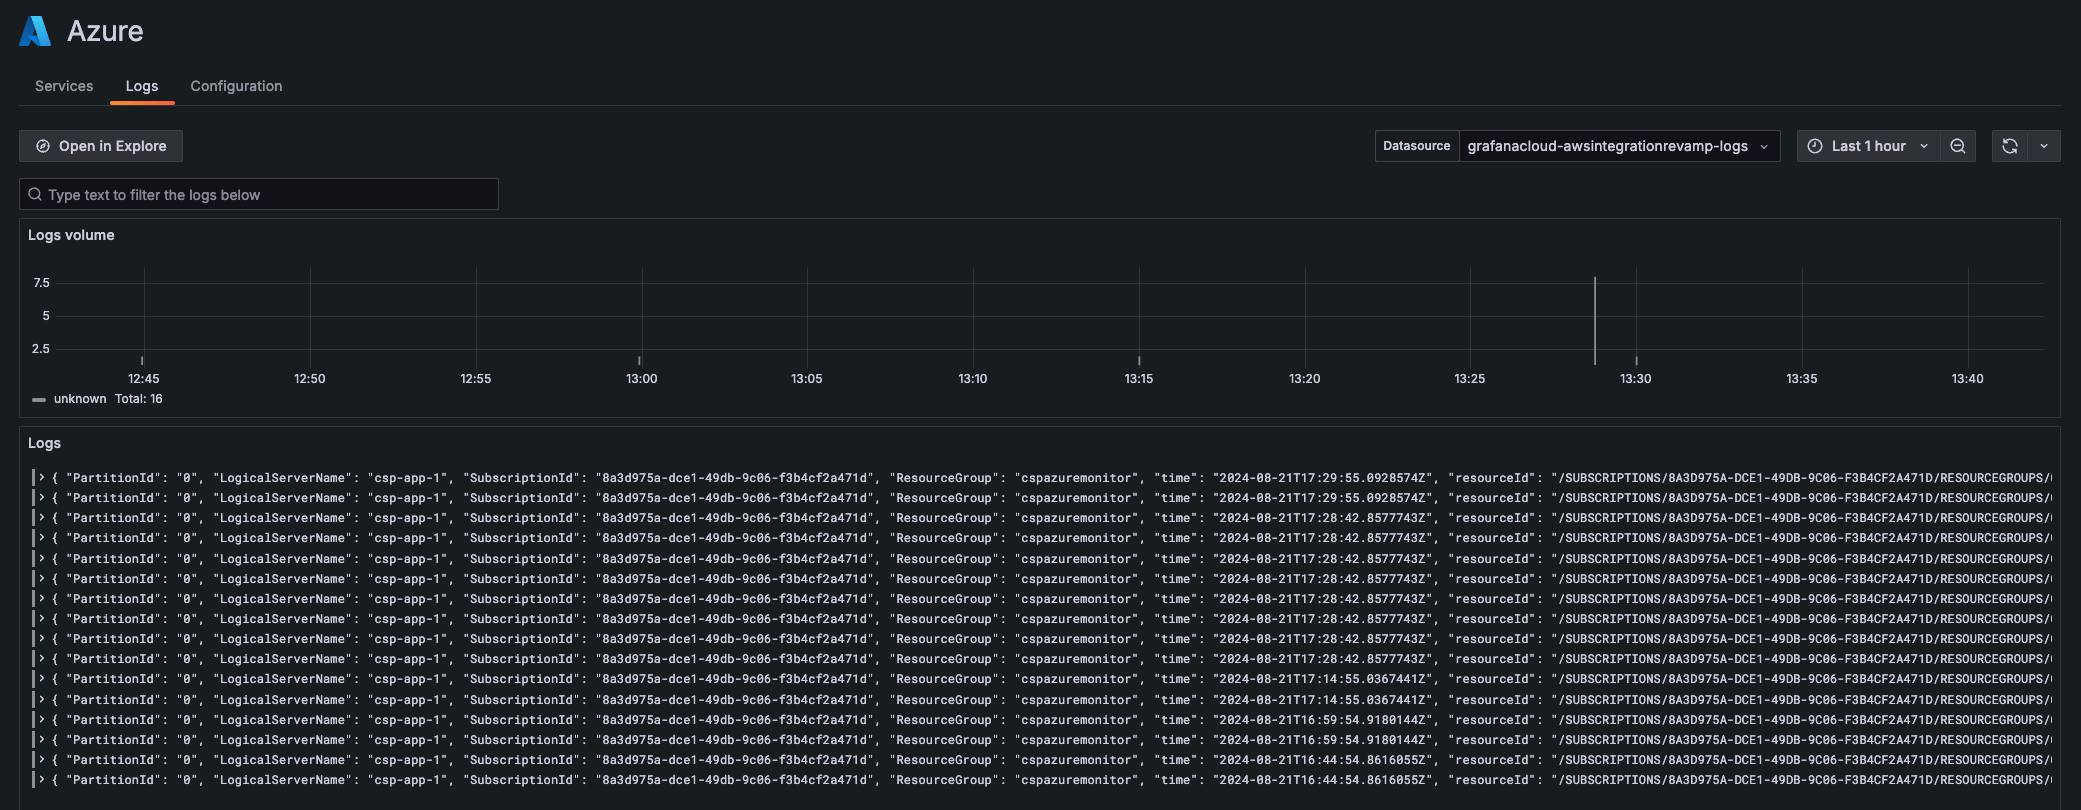
Azure
With Azure, you can monitor Azure metrics and view Azure logs.
Azure Metrics
Grafana Alloy enables you to send metrics from Azure resources to Grafana Cloud. The Resource Graph identifies which resources to gather metrics from. Grafana Alloy, embedded with the azure-metrics-exporter, gathers metrics and sends them to Grafana Cloud.
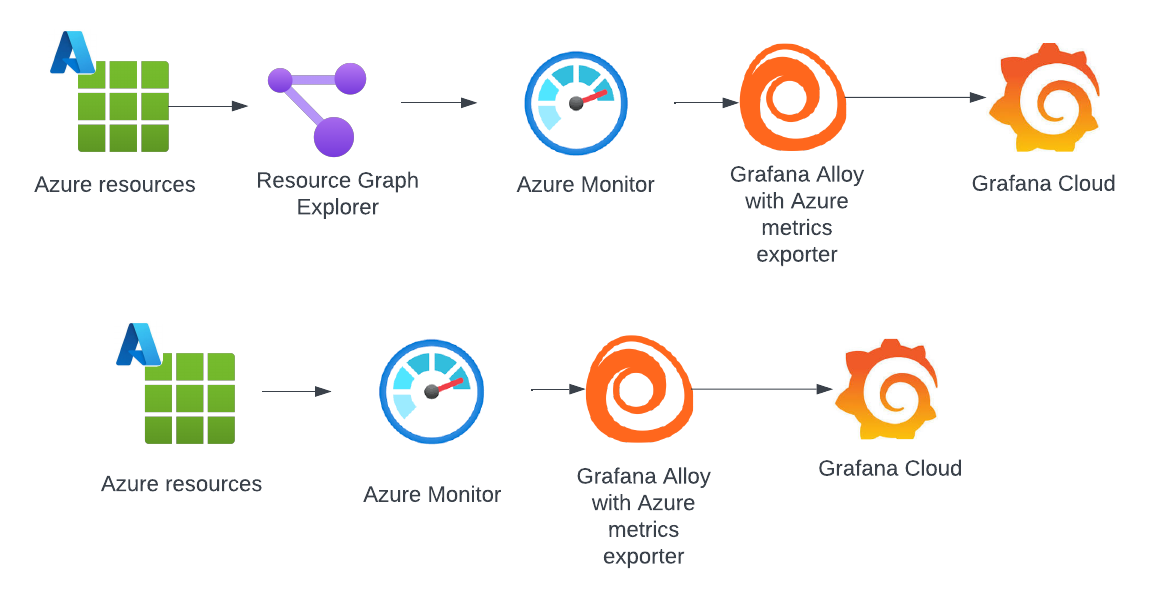
To get Azure Metrics running with Alloy, refer to Configure Azure Metrics.
You can also configure Azure metrics without using a collector, to learn more, refer to Azure Metrics with Grafana Cloud Provider.
Preconfigured dashboards
You can use the filters on any dashboard to refine your data. Filters are appropriate for each dashboard, and may include:
- Data source
- Job
- Resource group
- Subscription name
- Resource name
- Bucket name
- Instance
- Namespace
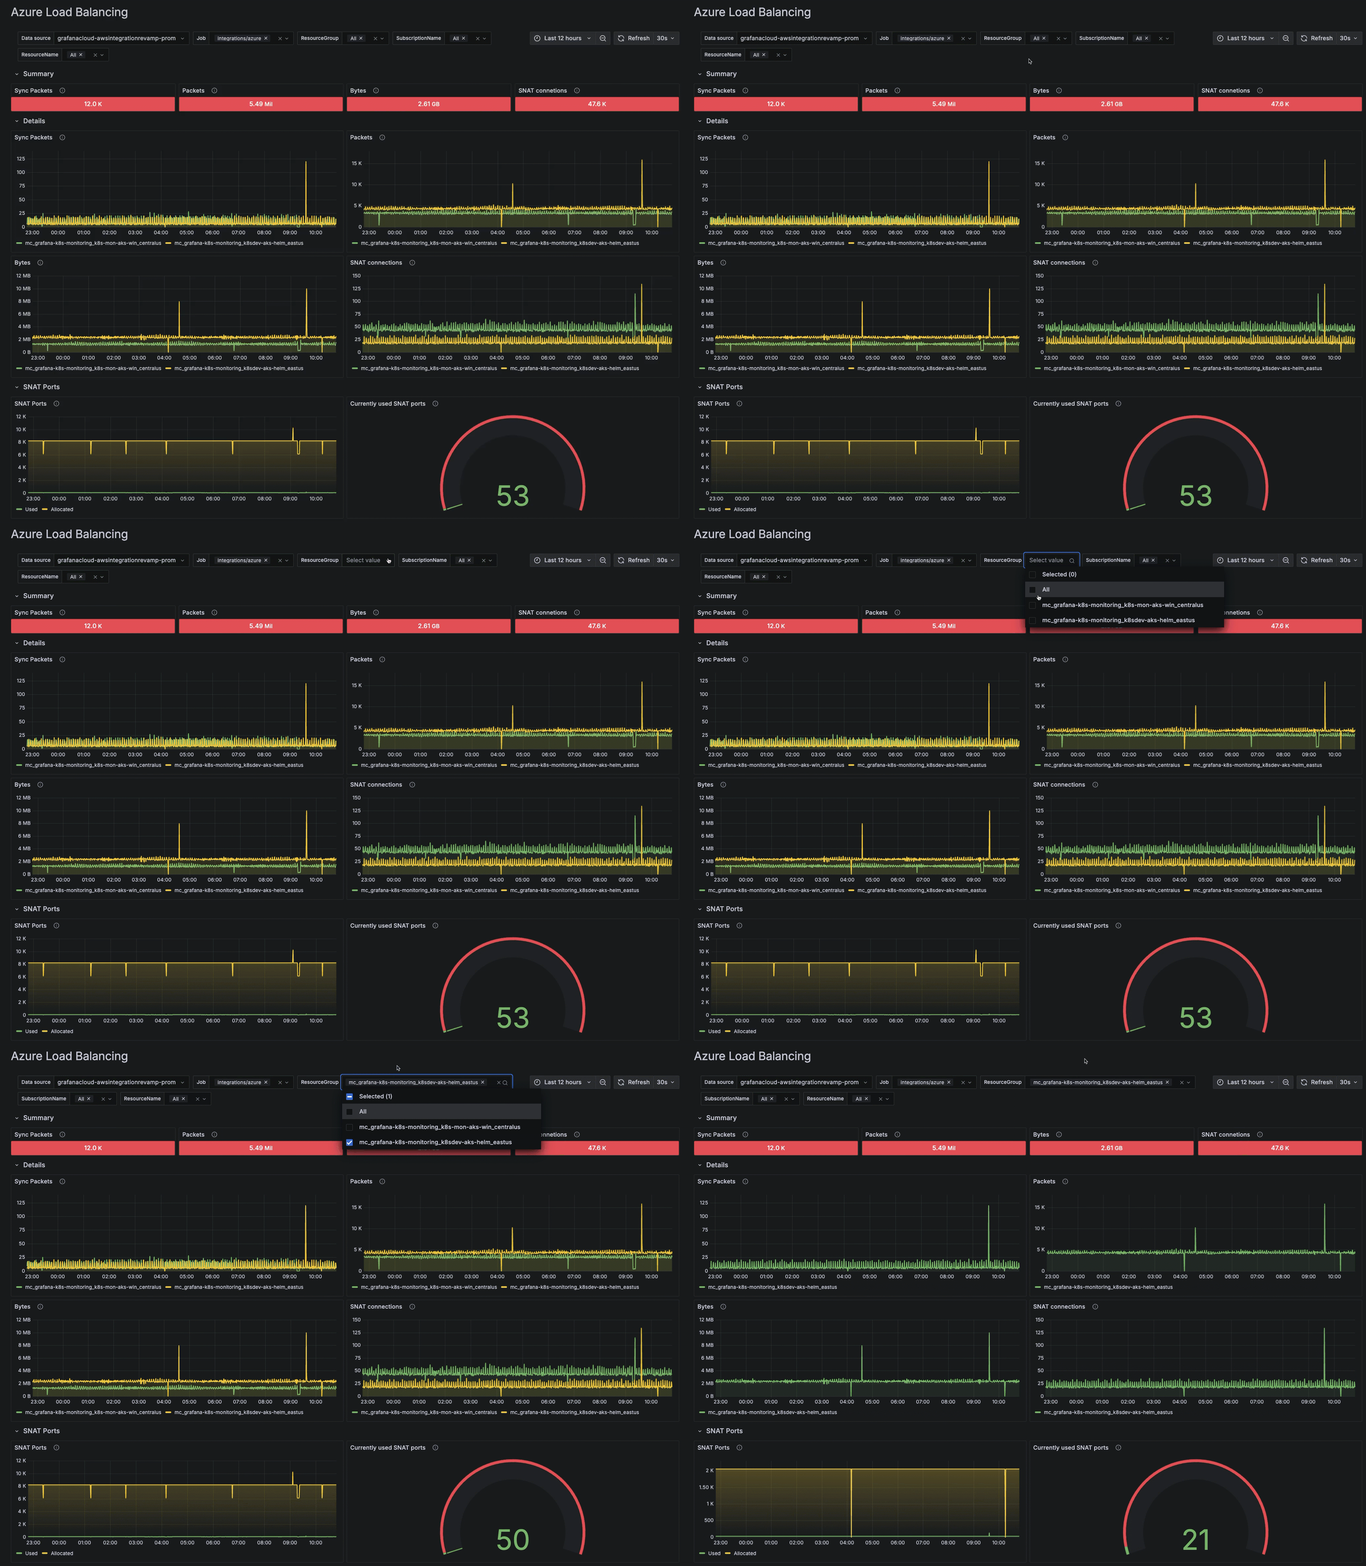
Additionally, use the time range selector to change time period of your data.
Go to an Azure dashboard
- To see any metrics dashboard, configure Azure metrics.
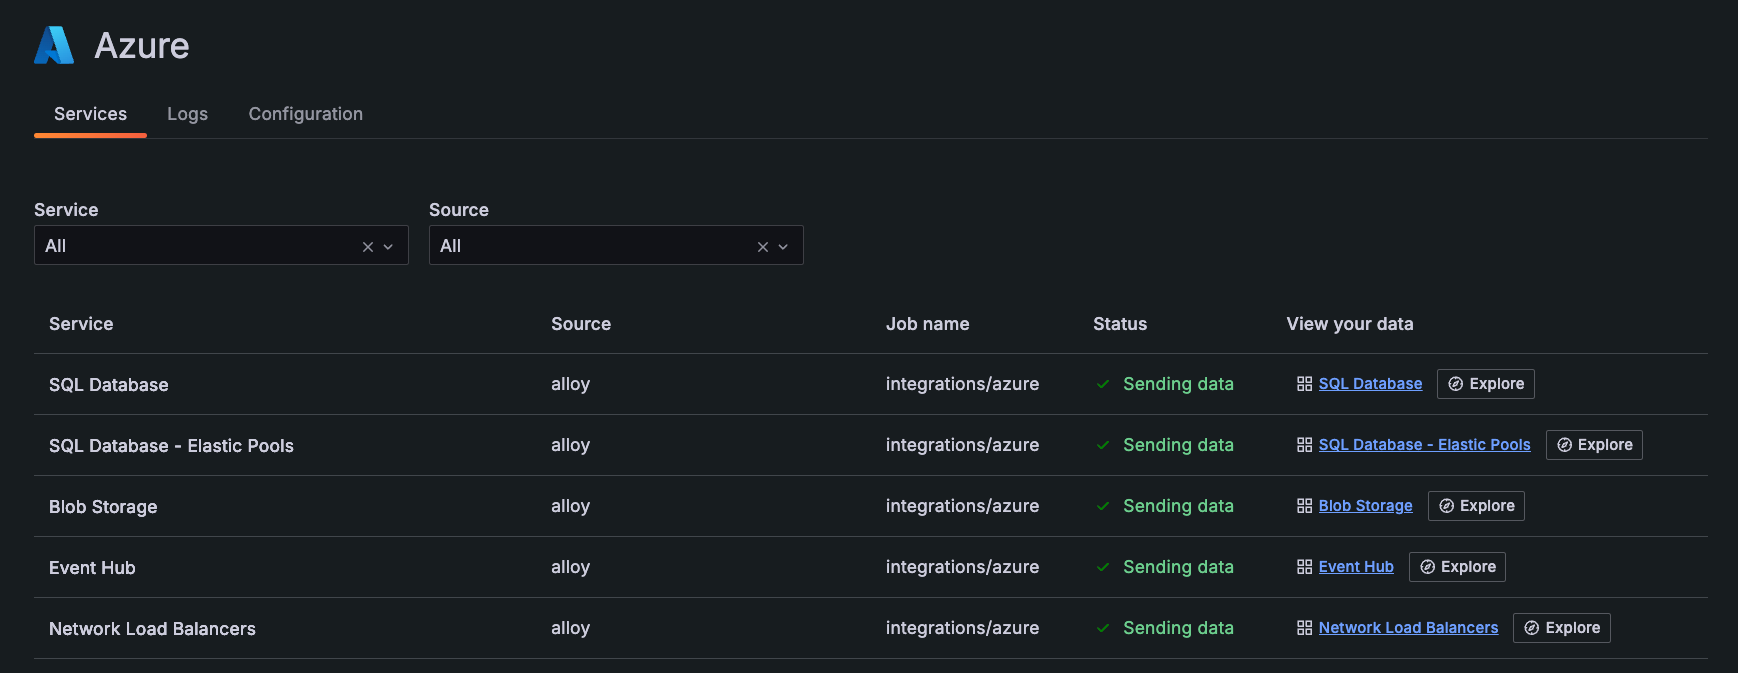
- In the main menu, click Azure to open the Services tab.
![List of available services on **Services** tab List of available services on **Services** tab]()
List of available services on Services tab - Locate the specific service in the list, and click the dashboard in the View your data column of the table.
The following dashboards are available out of the box.
Azure API Gateway
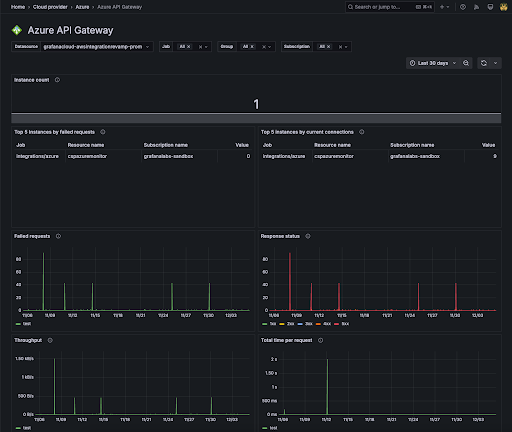
The Azure API Gateway dashboard shows the following data:
- The number of API Gateway instances
- The top 5 api gateway instances by the number of failed requests
- The top 5 api gateway instances by the number of current connections
- Failed requests
- Response status by code
- Throughput
- Total time per request
You can filter the view and see data by job, group, or subscription.
Azure Blob Storage
Azure Elastic Pool
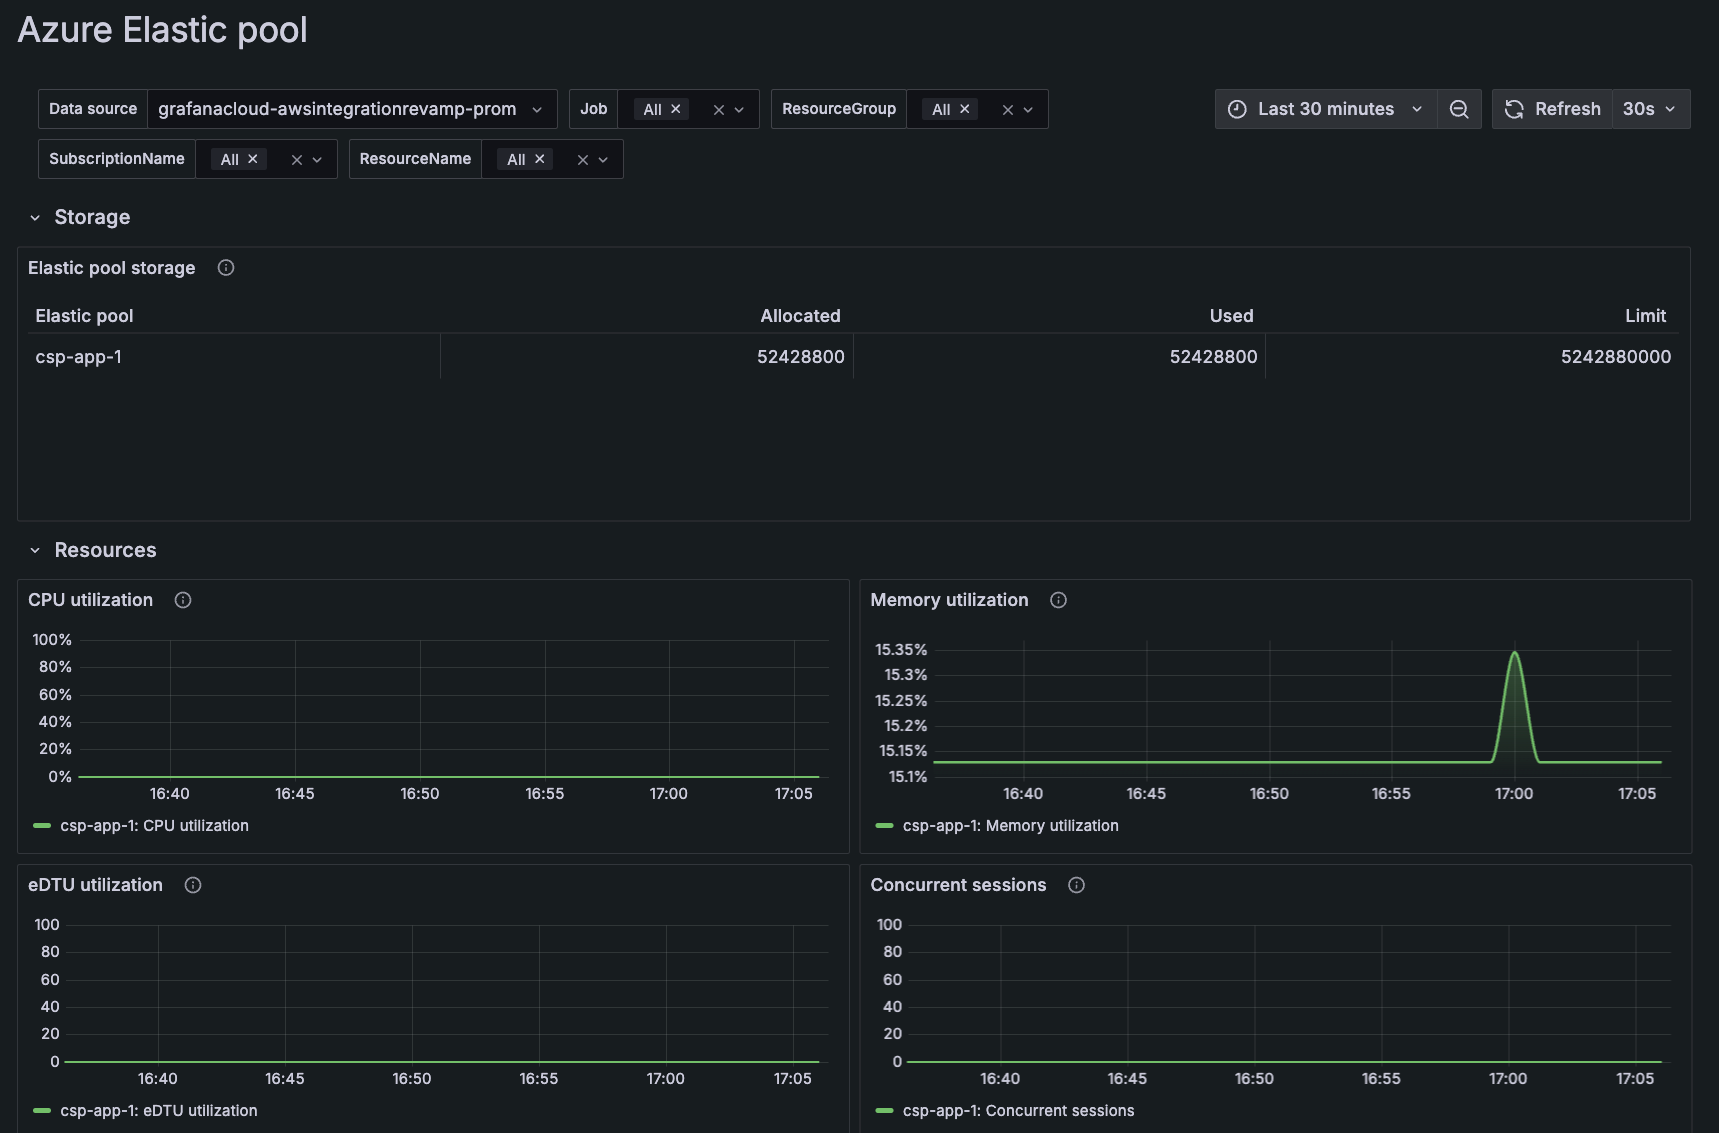
The Azure Elastic Pool dashboard shows the following per elastic pool:
- CPU utilization
- Memory utilization
- eDTU utilization
- Concurrent sessions average
Azure Event Hub
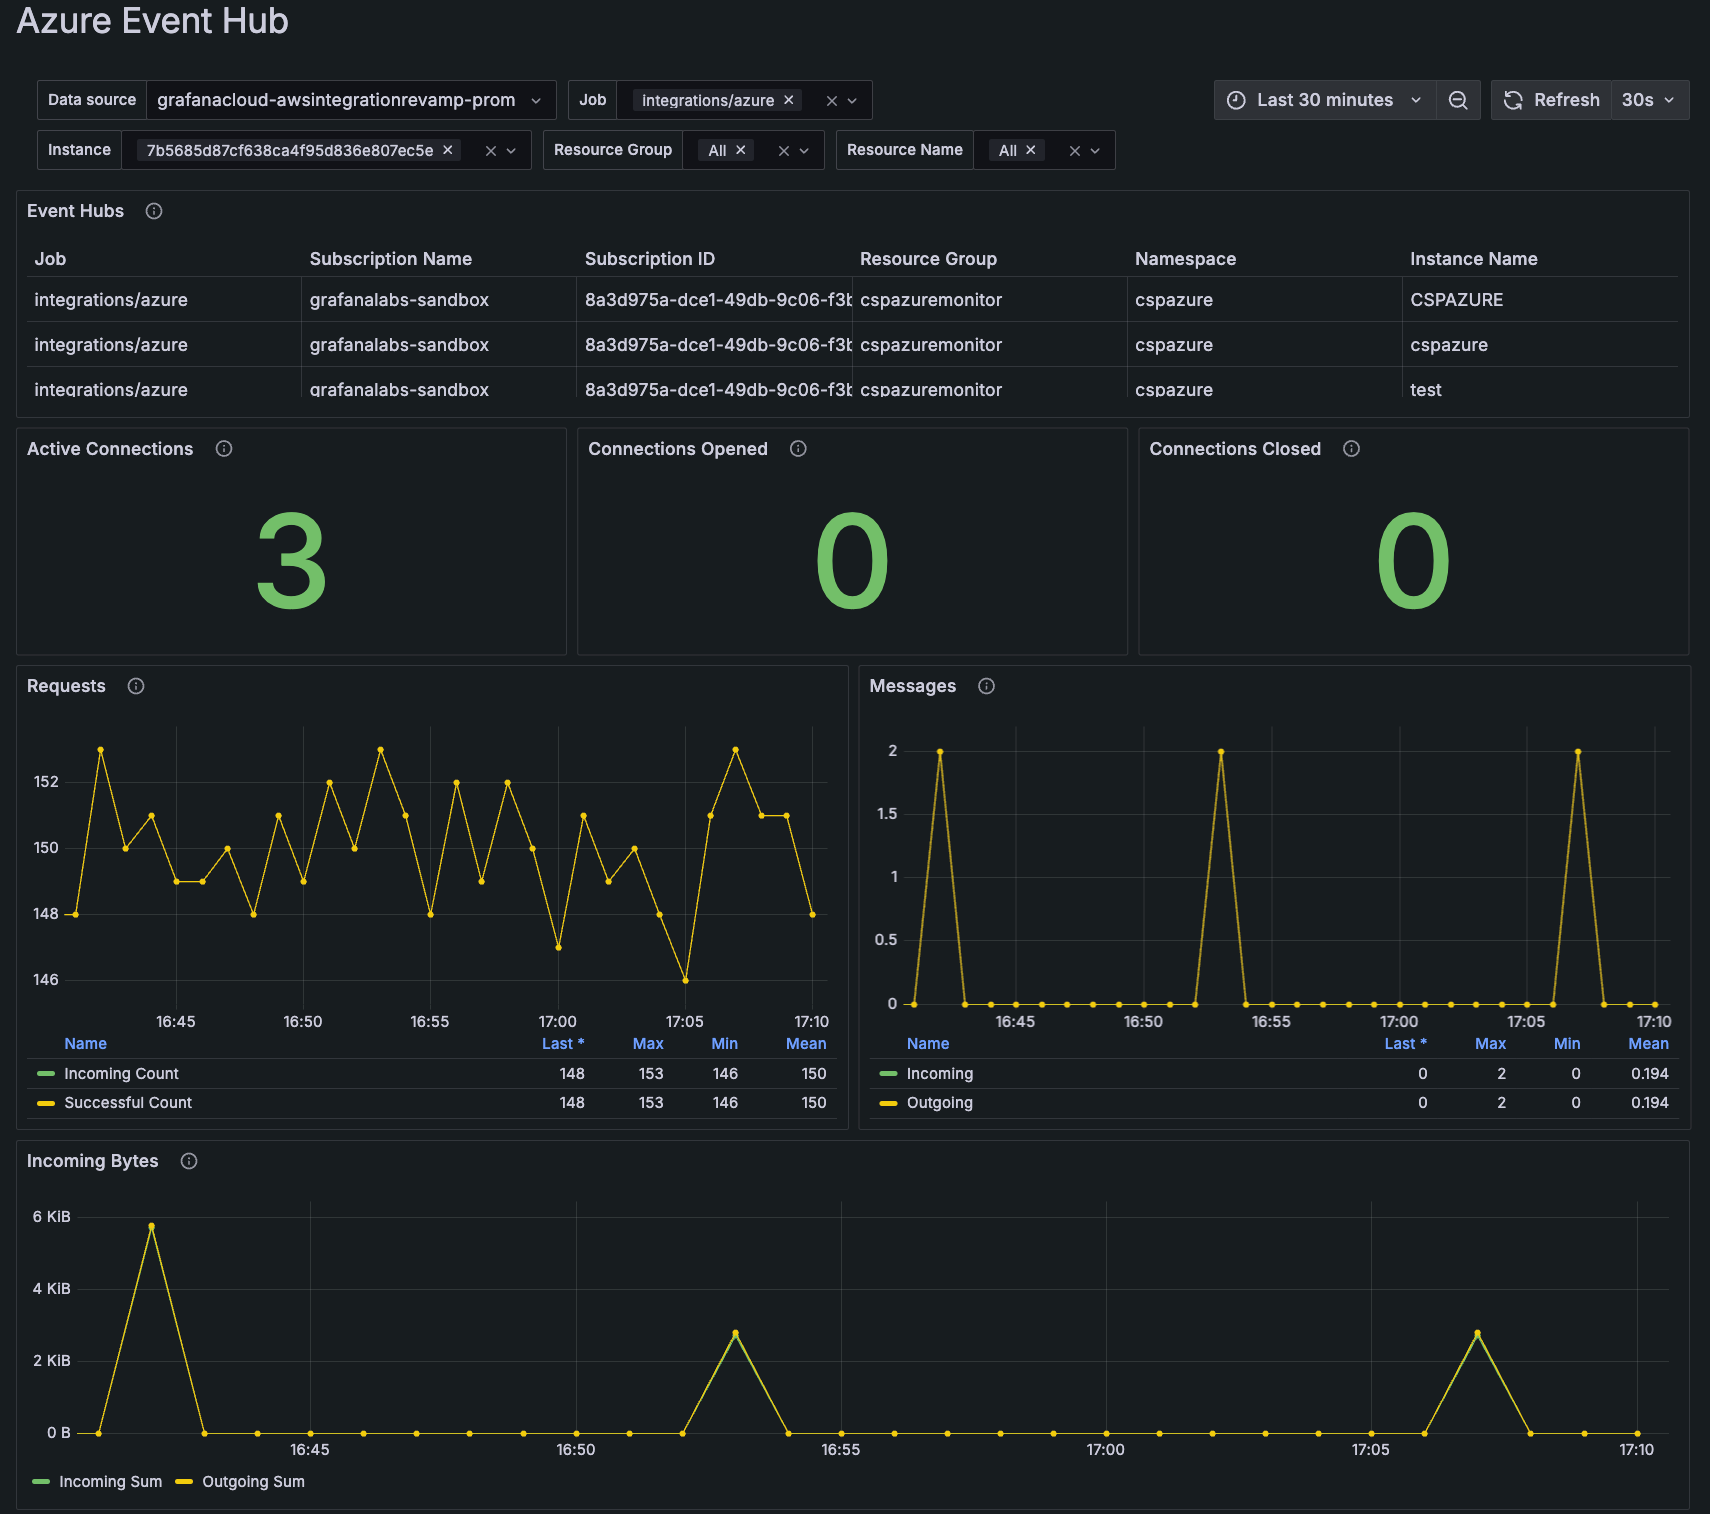
The Azure Event Hub dashboard shows the following about the Event Hub namespace:
- Requests: Number of API requests received by the namespace
- Messages: Number of messages processed by the namespace
- Incoming bytes: Total bytes processed by the namespace
- Errors: Errors reported by the namespace
Azure Front Door
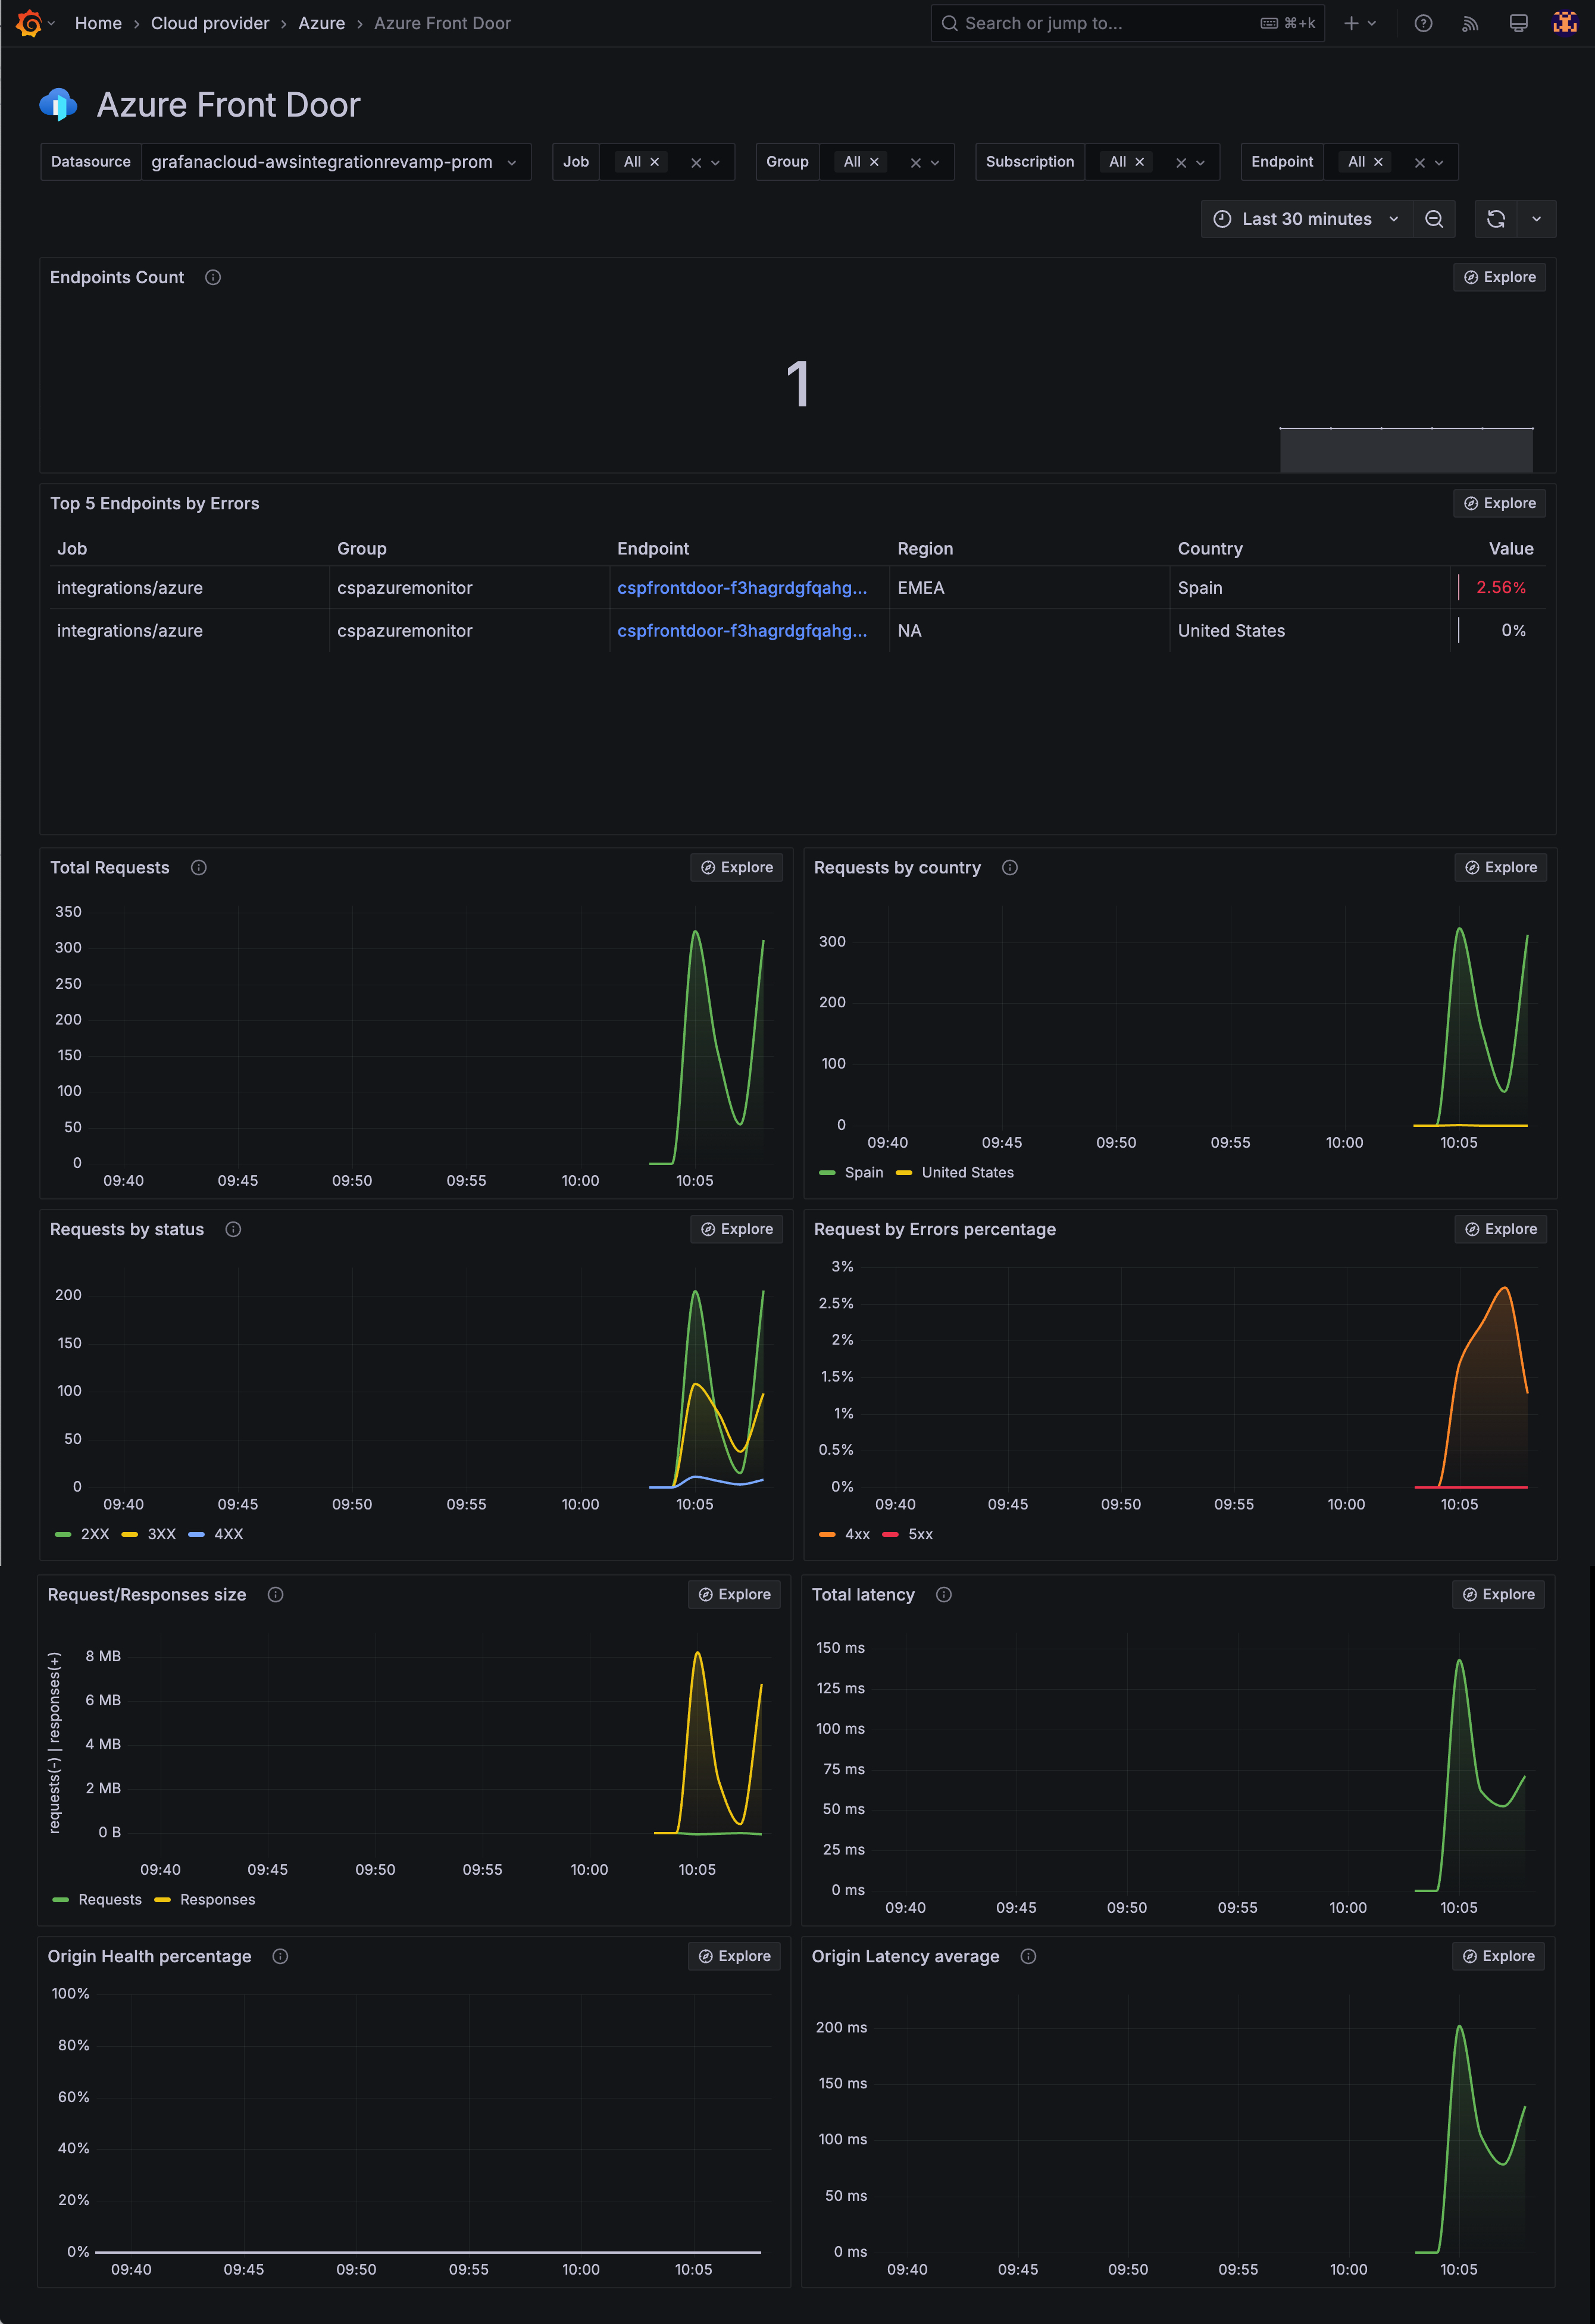
The Azure Front Door dashboard consists of an overview page that shows the following data:
- General information about the number of endpoints
- The percentage of errors by endpoint
- Total requests by country
- Status and errors
- Total latency
- Size of requests and responses
- Health and latency of the origin
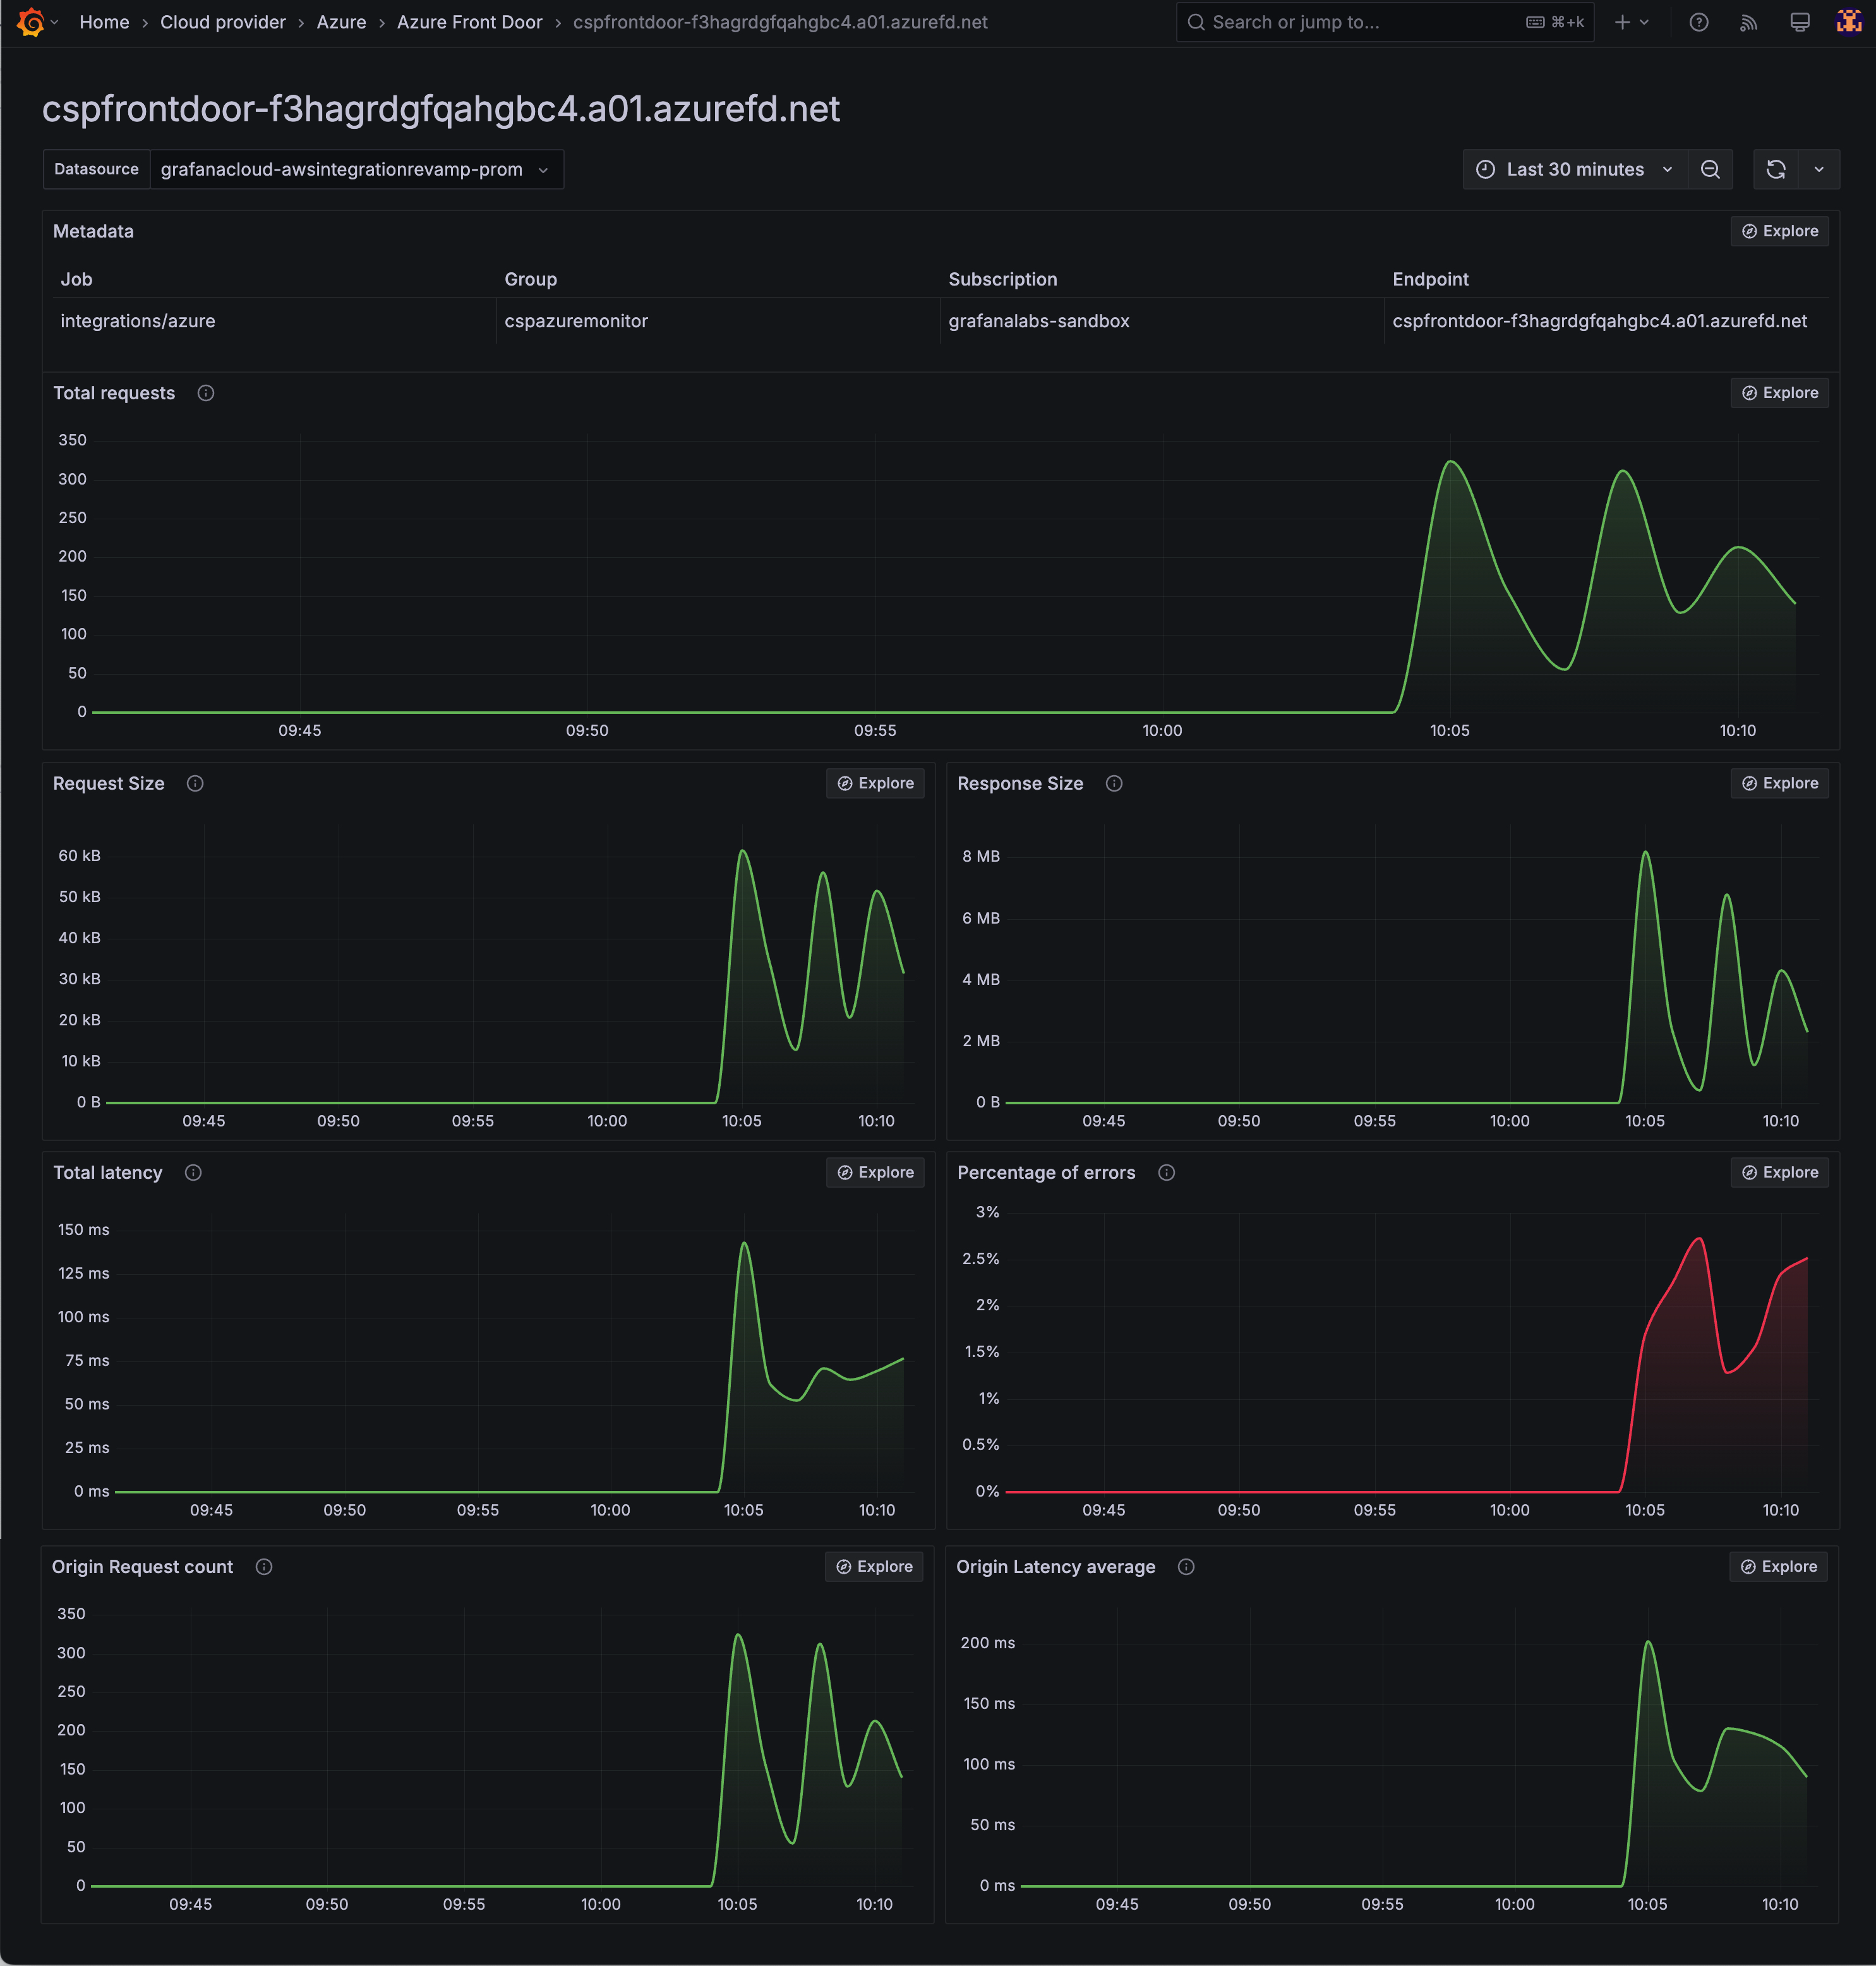
You can access a more detailed page using the links in Top 5 Endpoints by Errors which will display requests specifically associated with that endpoint.
Azure Load Balancing
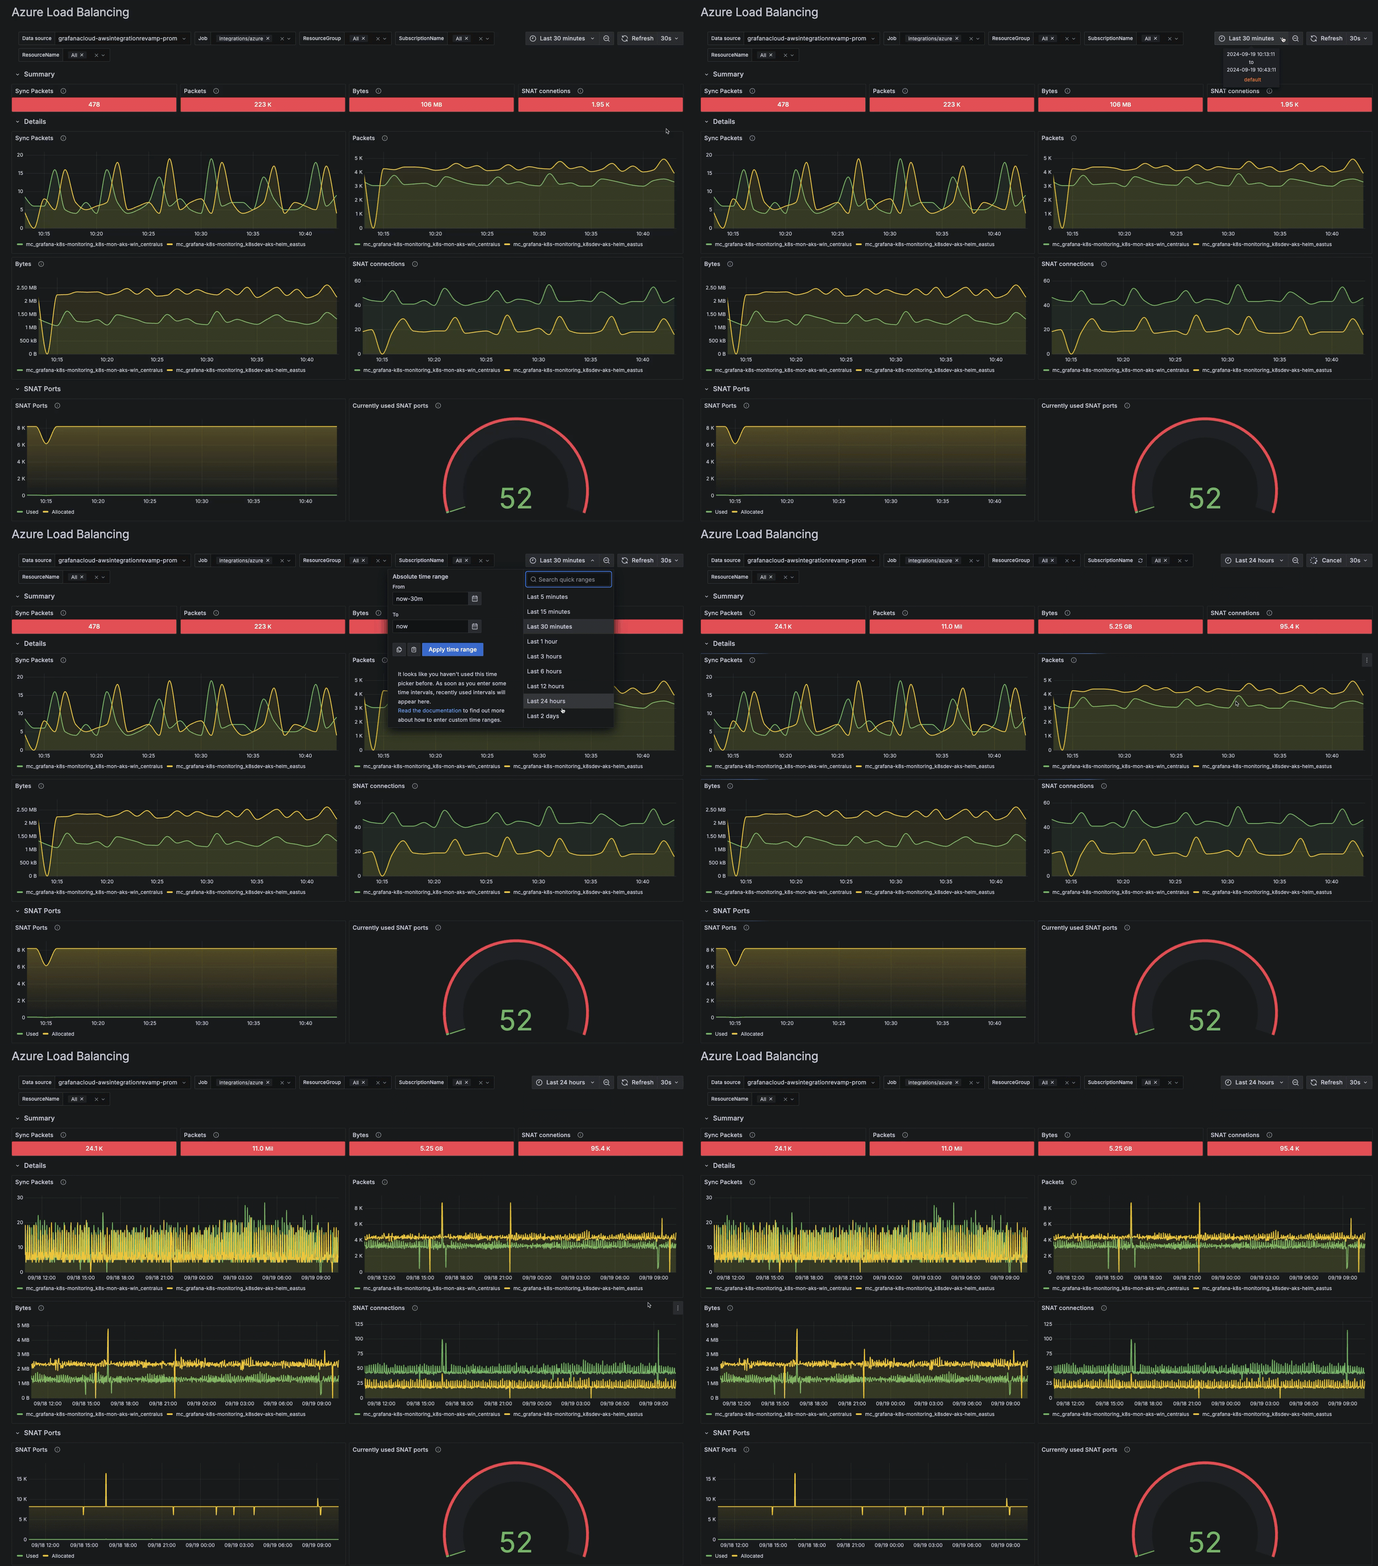
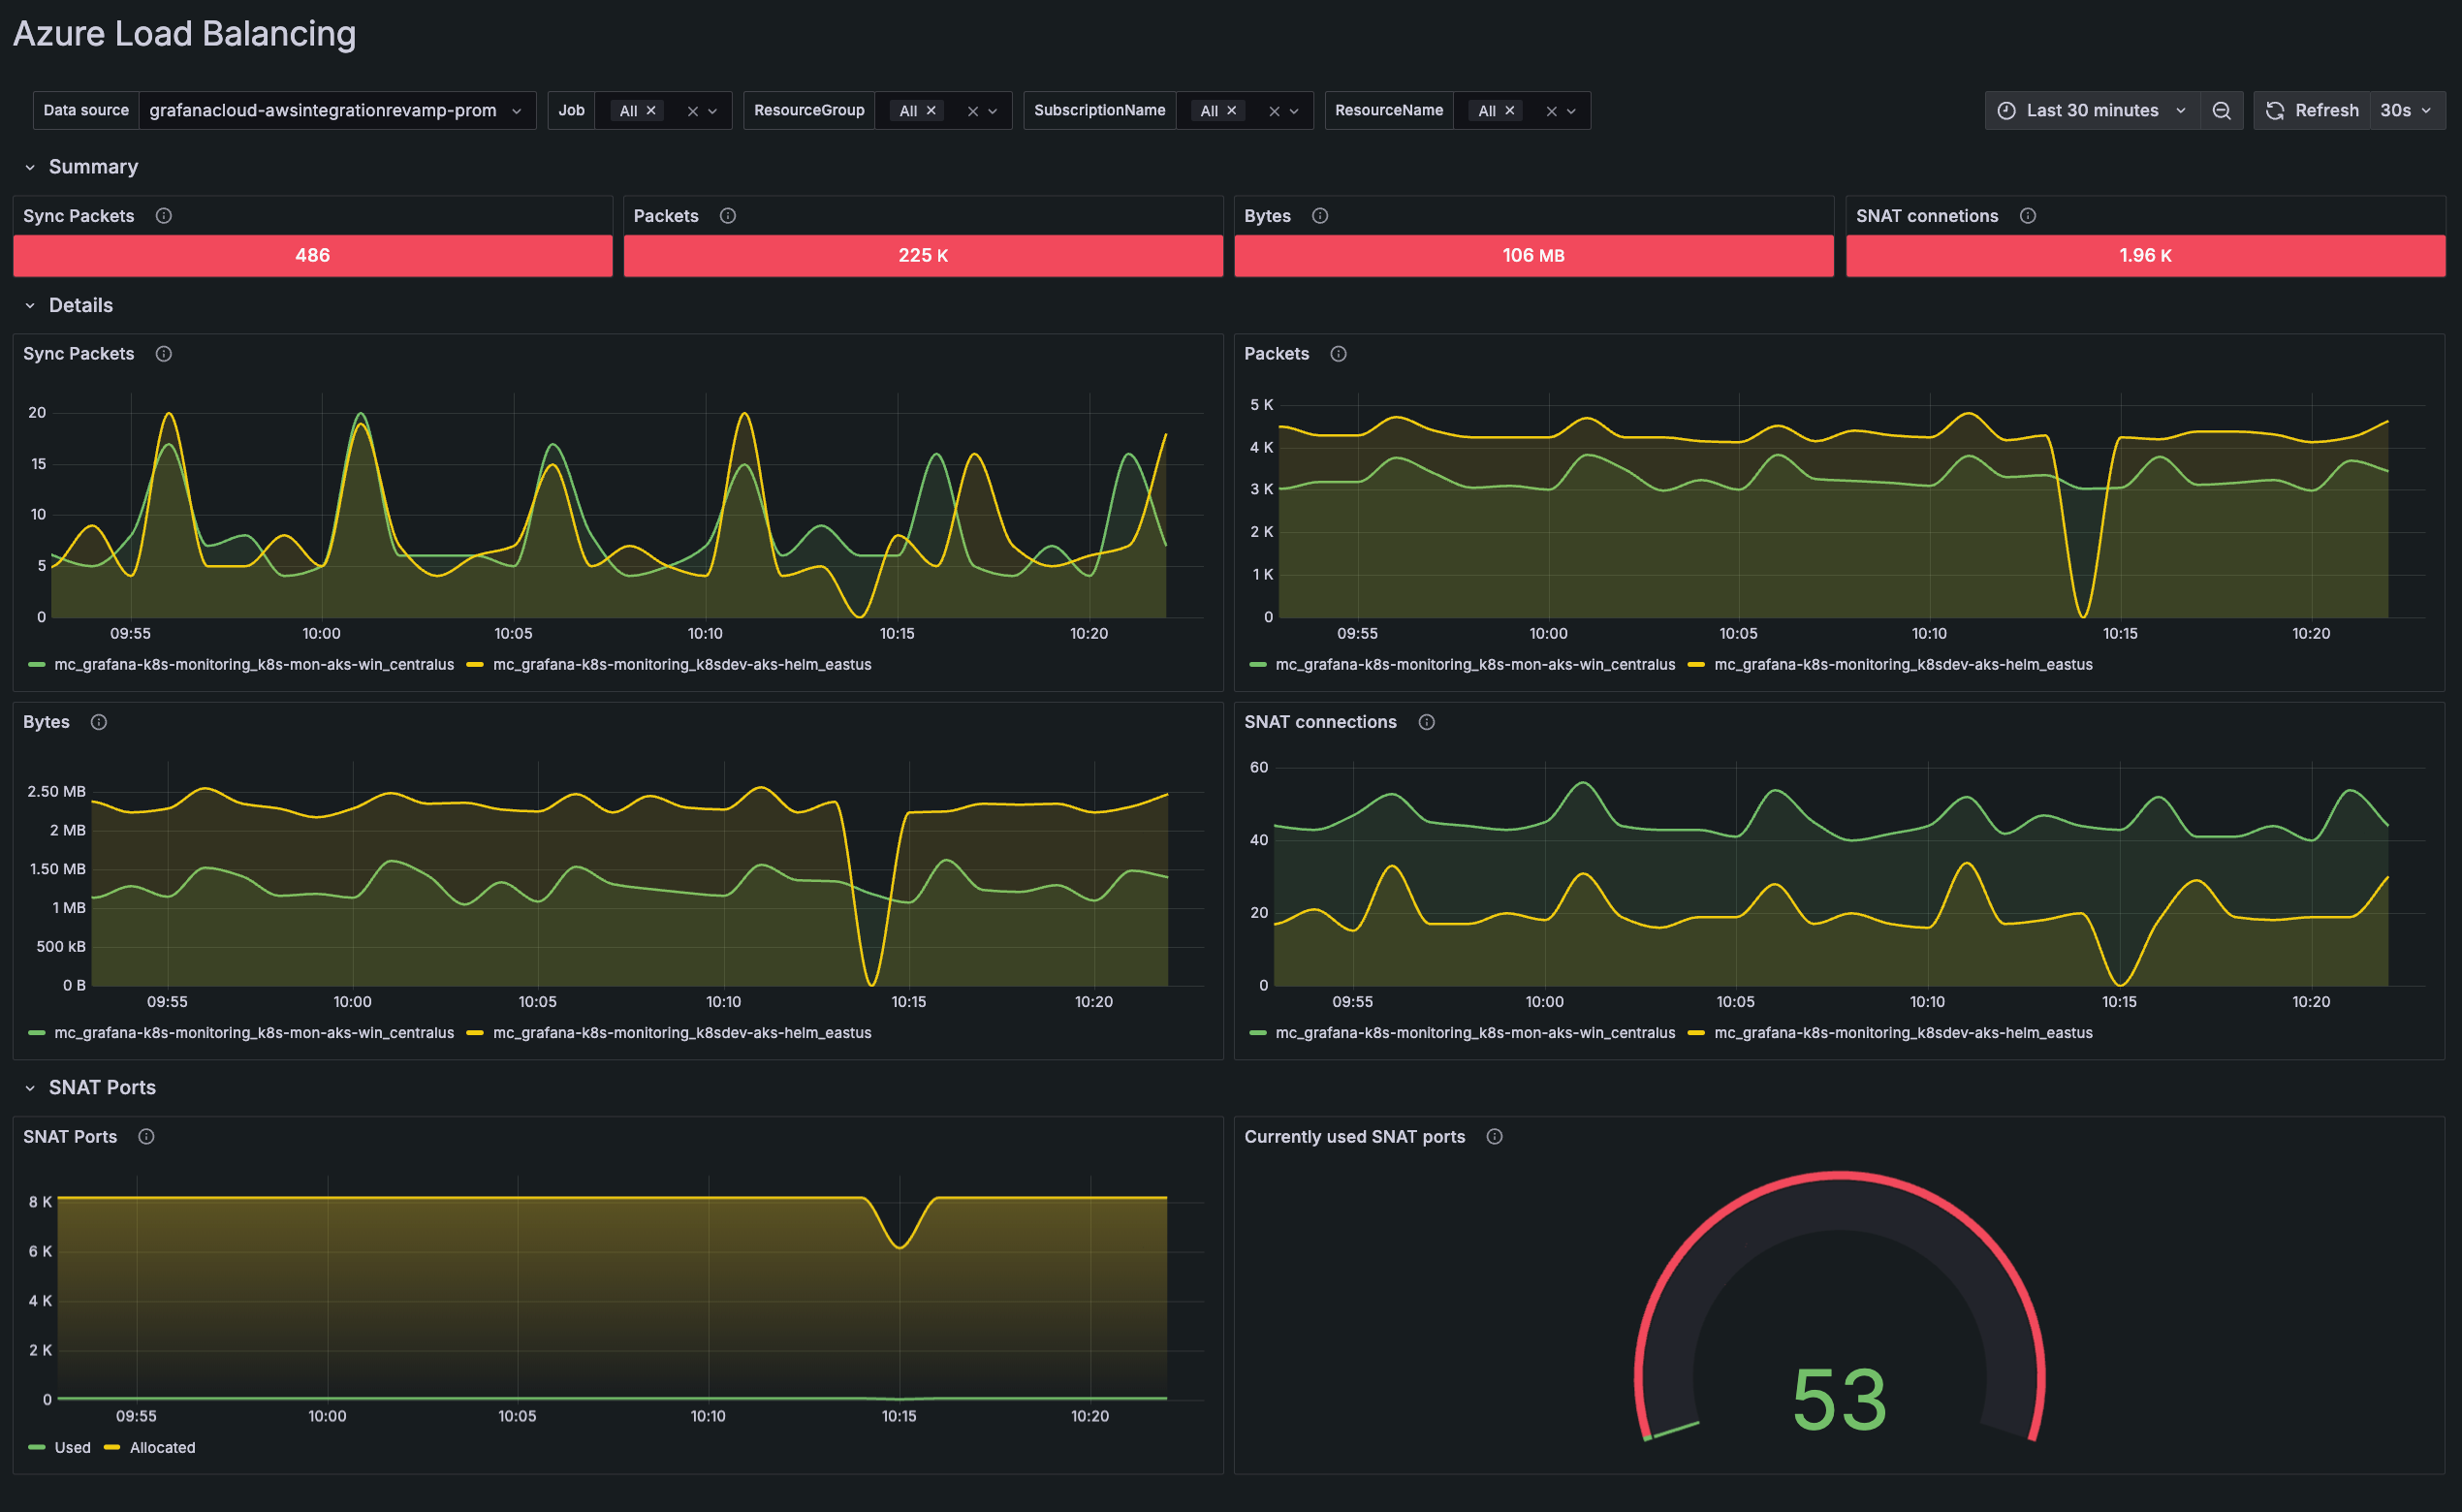
The Azure Load Balancing dashboard shows the following data:
- A summary of the total number of sync packets, packets, bytes, and SNAT connections
- Sync packets transmitted within the time range selected
- Packets transmitted within the time range selected
- Bytes transmitted within the time range selected
- New SNAT connections created within the time range selected
- SNAT ports used and allocated within the time range selected
- Total SNAT ports currently used
Azure Service Bus
The Azure Service Buss dashboard shows the following data:
- Total incoming and outgoing messages, and requests success rate
- Active connections by namespace
- Successful requests
- Incoming requests
- Incoming messages
- Average active messages
- Outgoing messages
- Average message size
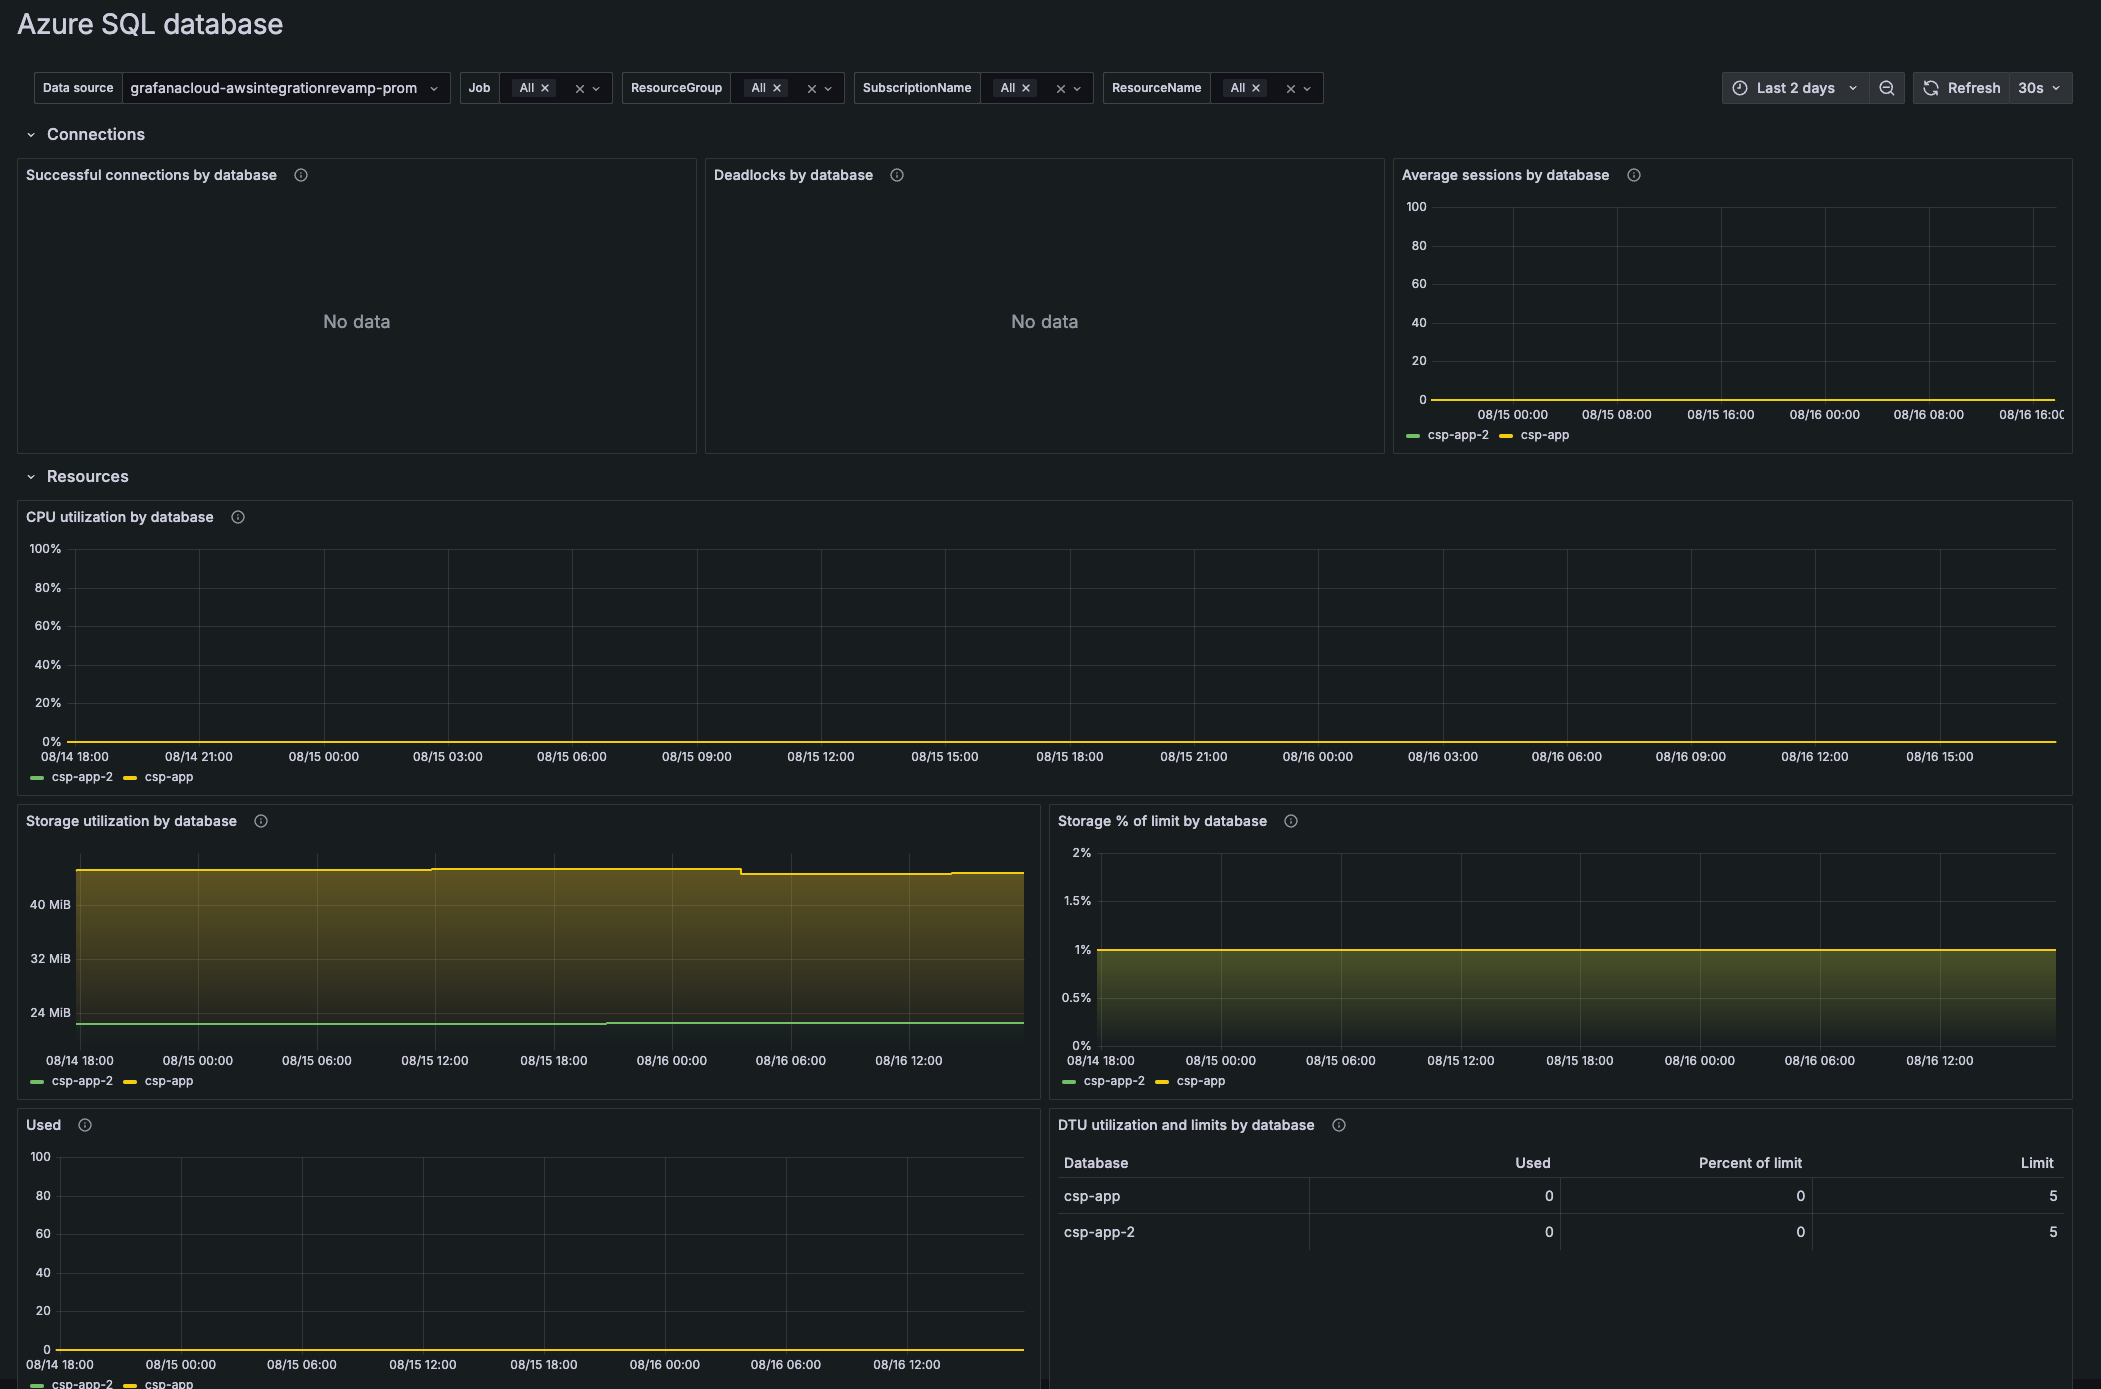
Azure SQL Database
The Azure SQL Database dashboard shows the following data by database:
- Successful connections
- Deadlocks
- Average sessions
- Percent of CPU utilization
- Bytes of storage utilization
- Percent used of storage limit
- Average number of database transaction units used
- Statistics on utilization and limits of database transaction units
Azure Virtual Machines
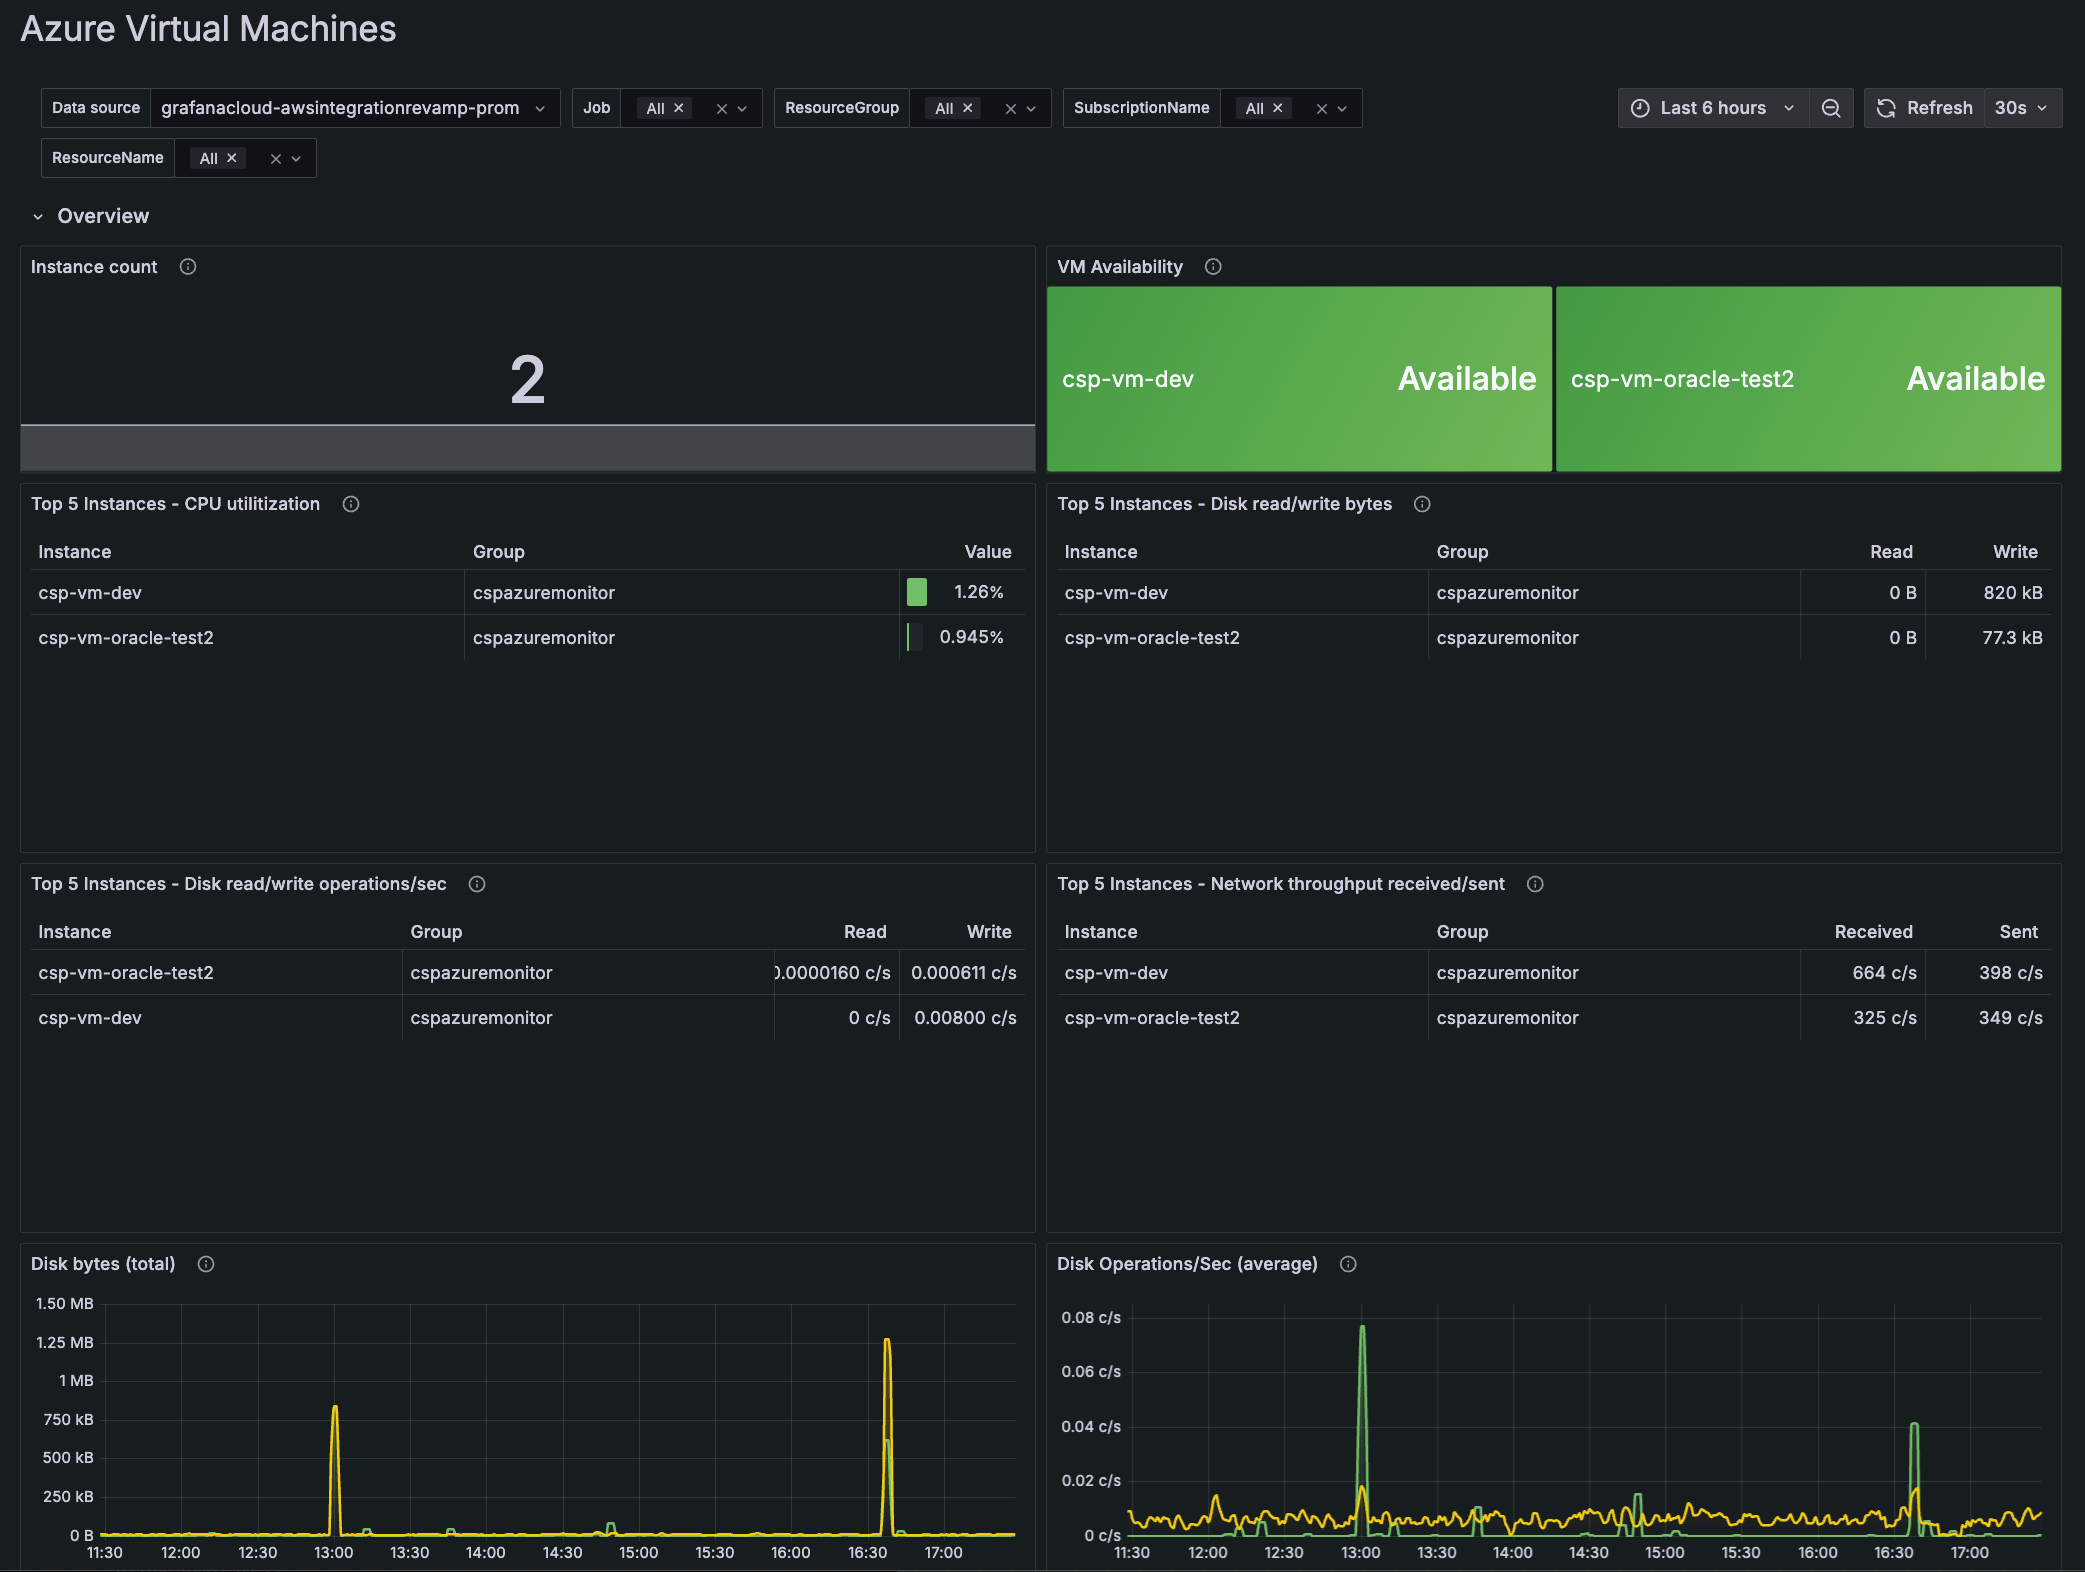
The Azure Virtual Machines dashboard shows the following data:
- Number of VM instances
- Availability of virtual machines
- Top five instances of CPU utilization
- Top five instances of disk read/write bytes
- Top five instances of disk read/write operations per second
- Top five instances of network throughput received/sent
- Total disk bytes
- Average of disk operations per second
- Network throughput sent/received
- Inbound and outbound connections
Azure Virtual Network
The Azure Virtual Network dashboard shows the following data:
- Current DDoS status
- Round trip time for pings to a VM
- DDoS trigger packets by type
- Bytes by DDoS action
- Bytes dropped in DDoS by protocol
- Bytes forwarded in DDoS by protocol
- Packets by DDoS action
- Packets dropped in DDoS by protocol
- Packets forwarded in DDoS by protocol
Azure Event Hub
Grafana Alloy enables you to send data from the Azure Event Hubs to Grafana Cloud. Azure Monitor streams log data from configured sources to an Event Hub namespace that has been created with a Kafka endpoint. Grafana Alloy pulls the data from the Event Hub namespace and sends it to Grafana Cloud.

To get Azure Event Hubs running, refer to Configure Azure Event Hubs for logs.
Azure logs
